

調達部門が低コスト代替品の採用を強く求める中、高品質な空気圧部品への投資を正当化できずに悩んでいませんか?多くのエンジニアリングおよびメンテナンス担当者は、シリンダー選定の決定がもたらす真の経済的影響を、初期購入価格を超えて示す際に重大な課題に直面しています。.
包括的な ライフサイクルコスト分析1 ロッドレスシリンダーの分析によると、初期購入価格は総所有コストのわずか12~18%を占めるに過ぎず、エネルギー消費(35~45%)と保守費用(25~40%)が生涯コストの大部分を構成する。これにより、高効率・高信頼性を備えたプレミアムシリンダーは、10年間の運用期間において最大42%もコスト削減が可能となる。.
最近、ある食品加工工場と仕事をした際、同社はプレミアム部品の導入により初期コストが651万3000円高くなることを理由に、空気圧システムの更新に消極的でした。以下に説明するライフサイクルコスト分析手法を導入した結果、彼らが「経済的」と考えていたシリンダーが、実際には年間1億4327万円の追加エネルギー費とメンテナンス費を負担させていることが判明しました。貴社の業務においても同様の知見を明らかにする方法をご紹介します。.
目次
- 正確な初期コスト比較マトリックスを作成するにはどうすればよいですか?
- エネルギー効率コストを計算する最も実用的な方法は何ですか?
- 長期的な維持管理コストを最も正確に予測できる手法はどれか?
- 結論
- ロッドレスシリンダーのライフサイクルコスト分析に関するよくある質問
正確な初期コスト比較マトリックスを作成するにはどうすればよいですか?
初期コスト比較マトリクスは包括的なライフサイクル分析の基盤となるが、単純な購入価格の検討を超えていなければならない。.
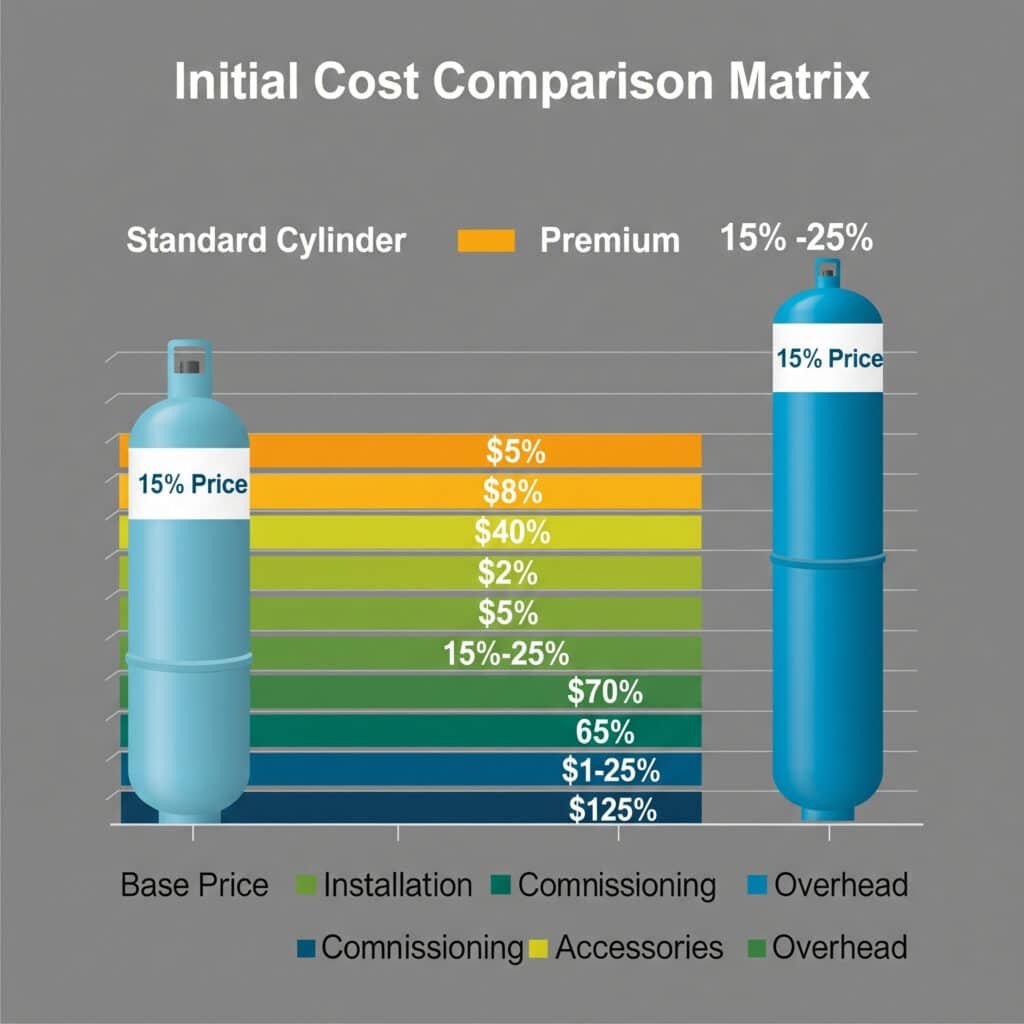
ロッドレスシリンダーの正確な初期コスト比較マトリックスには、基本部品価格だけでなく、設置費用、試運転要件、付属品コスト、調達間接費を定量化して組み込む必要がある。これにより、プレミアムシリンダーは購入価格が高いにもかかわらず、初期導入コストを15~25%削減できることが明らかになる。.
複数の産業分野における空気圧システムの調達戦略を策定する中で、多くの組織が部品の購入価格のみに焦点を当てることで、実際の初期コストを大幅に過小評価していることが判明しました。重要なのは、選定から試運転までの全関連費用を網羅する包括的なマトリックスを構築することです。.
包括的な初期費用フレームワーク
適切に構築された初期コスト比較マトリックスには、以下の必須要素が含まれます:
1. 直接部品コスト分析
基本構成部品のコストは徹底的に検証されなければならない:
| コスト区分 | 標準部品 | プレミアムコンポーネント | 評価アプローチ |
|---|---|---|---|
| ベースシリンダー | 単位コストの削減 | 単位当たりのコストが高い | 直接引用比較 |
| 必須付属品 | しばしば別売り | しばしば含まれる | 付属品明細リスト |
| 取付金具 | 基本オプション | 包括的な選択肢 | アプリケーション固有の要件 |
| 接続コンポーネント | 標準装備品 | 最適化された継手 | 完全な空気回路解析 |
| 制御コンポーネント | 基本機能 | 高度な機能 | 制御システム統合評価 |
| スペアパーツパッケージ | 初期予備部品は限定的 | 包括的なスペアパーツ | 業務リスク評価 |
実装上の考慮事項:
- 複数のサプライヤーから詳細な明細付き見積もりを依頼する
- 完全なシステム間の同等比較を確保する
- 数量割引とパッケージ価格を考慮に入れる
- プロジェクトスケジューリングにおけるリードタイムの影響を考慮する
2. 設置および導入コスト分析
設置費用は、選択肢によって大きく異なることがよくあります:
設置作業要員要件
– 複雑性の増大評価
– 接続および統合時間の推定
– 専門的な技能要件
– 設置用工具および機器の必要性
– アクセス要件と制約システム統合費用
– 制御システムのプログラミング要件
– インターフェース適応の必要性
– 通信プロトコルの互換性
– ソフトウェア構成の複雑さ
– 試験および検証手順文書化とトレーニングの必要性
– 必要な技術文書
– 操作者訓練要件
– メンテナンス要員研修
– 専門知識の移転
– 継続的なサポート要件
3. 試運転2 および立ち上げコスト評価
シリンダーの選択肢によって試運転費用は大きく異なる場合があります:
調整および校正の要件
– 初期設定の複雑さ
– 校正手順の要件
– 専用工具が必要
– 技術的専門知識の要件
– 検証および確認手順試験および認定費用
– 性能テストの要件
– 信頼性検証手順
– コンプライアンス検証の必要性
– 書類の提出要件
– 第三者認証費用生産量増加の影響
– 学習曲線に関する考慮事項
– 初期生産効率への影響
– スタートアップ時の廃棄物と品質問題
– 試運転中の生産性
– フル生産能力達成までの時間
実世界での応用例:製造工場の拡張
私が実施した最も包括的な初期コスト分析の一つは、ドイツにおける製造工場の拡張計画に関するものでした。彼らの要求事項には以下が含まれていました:
- 3種類のロッドレスシリンダー技術の比較
- 5社の潜在的なサプライヤーの評価
- 既存の自動化システムとの統合
- 厳格な内部基準への遵守
包括的な比較マトリクスを開発したところ、驚くべき結果が明らかになりました:
| コスト区分 | エコノミーオプション | ミドルレンジオプション | Premium Option |
|---|---|---|---|
| Base Component Cost | €156,000 | €217,000 | €284,000 |
| Installation Expenses | €87,000 | €62,000 | €43,000 |
| Commissioning Costs | €112,000 | €76,000 | €51,000 |
| Administrative Overhead | €42,000 | €38,000 | €32,000 |
| Total Initial Cost | €397,000 | €393,000 | €410,000 |
The key insight was that while the premium option had an 82% higher component cost, the total initial cost was only 3.3% higher than the economy option due to significantly reduced installation, commissioning, and administrative expenses. This challenged their procurement-driven decision process that had historically focused exclusively on component pricing.
エネルギー効率コストを計算する最も実用的な方法は何ですか?
Energy consumption represents the largest operational expense for most pneumatic systems, making accurate efficiency calculations essential for lifecycle cost analysis.
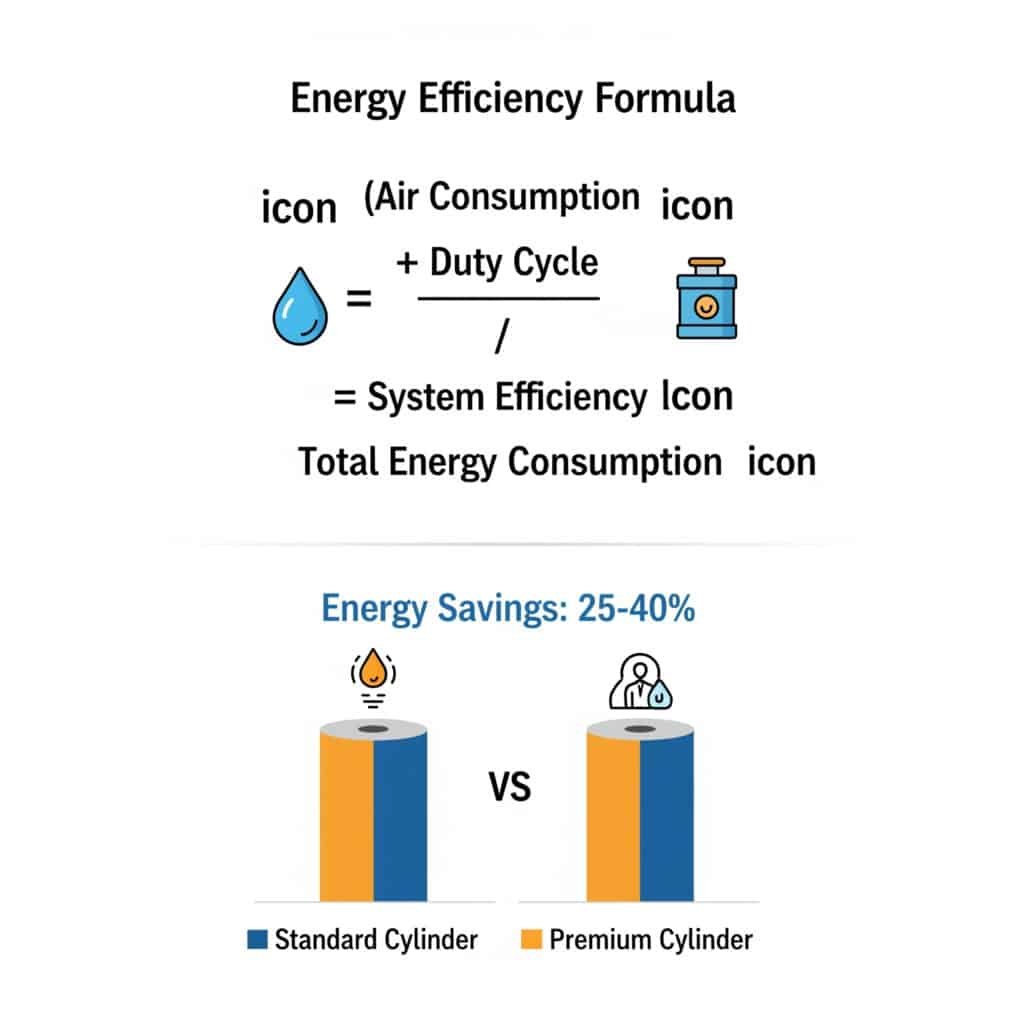
The most practical energy efficiency calculation for rodless cylinders combines basic air consumption measurement with duty cycle analysis and system efficiency factors – revealing that premium cylinders typically reduce energy costs by 25-40% compared to standard alternatives through reduced air consumption, lower operating pressures, and improved system efficiency.
Having conducted energy audits for pneumatic systems across diverse industries, I’ve found that most organizations significantly underestimate energy costs by using simplified calculations that fail to account for real-world operating conditions. The key is developing a practical approach that captures all relevant factors affecting consumption.
Practical Energy Cost Calculation Approach
An effective energy cost calculation includes these key elements:
1. Basic Air Consumption Measurement
Start with straightforward air consumption measurement:
Cycle Consumption Testing
– Measure air consumption per cycle (liters)
– Test at actual operating pressure
– Include both extension and retraction
– Account for any mid-position stopsConversion to Standard Conditions
– Convert to standard conditions (ANR)3
– Account for actual operating pressure
– Consider temperature effects
– Establish comparable baseline metricsSimple Calculation Method
– Air consumption per cycle (L)
– Cycles per hour
– Operating hours per day
– Operating days per year
2. Efficiency Factor Incorporation
Account for key efficiency factors:
Cylinder Efficiency Considerations
– Seal design and friction impact
– Bearing design efficiency
– Material and construction quality
– Operating pressure requirementsSystem Efficiency Factors
– Valve selection and sizing
– Supply line sizing and routing
– Connection and fitting quality
– Control system efficiencyPractical Efficiency Comparison
– Relative efficiency ratings
– Percentage improvement metrics
– Comparative testing results
– Real-world performance data
3. Energy Cost Calculation
Calculate actual costs using a straightforward approach:
Annual Consumption Calculation
– Daily consumption: Consumption per cycle × Cycles per hour × Hours per day
– Annual consumption: Daily consumption × Operating days per year
– Adjusted consumption: Annual consumption ÷ System efficiencyEnergy Cost Conversion
– Conversion factor: kWh per 1,000 liters of compressed air
– Energy cost: Adjusted consumption × Conversion factor × Cost per kWh
– Annual energy cost: Energy cost × (1 + Inflation factor)Lifecycle Projection
– Simple multiplication for estimated lifecycle
– Basic present value calculation
– Consideration of energy price trends
– Comparative analysis between options
実世界での応用:自動車部品製造
One of my most practical energy efficiency analyses was for an automotive component manufacturer in Mexico. Their requirements included:
- 3種類のロッドレスシリンダー技術の比較
- Evaluation across multiple operating pressures
- Analysis of various duty cycles
- Projection of 10-year energy costs
We implemented a practical analysis approach:
Consumption Measurement
– Installed flow meters on supply lines
– Measured consumption at actual operating pressure
– Tested with typical production loads
– Recorded cycles per hour during normal operationEfficiency Evaluation
– Compared cylinder designs and specifications
– Evaluated operating pressure requirements
– Measured system efficiency factors
– Determined overall efficiency ratingsCost Calculation
– Energy cost: $0.112/kWh
– Conversion factor: 0.12 kWh per 1,000 liters
– Annual operating hours: 7,920
– 10-year projection with 3.5% annual energy inflation
The results revealed dramatic differences:
| メートル法 | Economy Cylinder | Mid-Range Cylinder | Premium Cylinder |
|---|---|---|---|
| Air Consumption per Cycle | 3.8 L | 2.9 L | 2.2 L |
| Operating Pressure Required | 6.5 bar | 5.8 bar | 5.2 bar |
| システム効率 | 43% | 56% | 67% |
| 年間エネルギーコスト | $12,840 | $8,760 | $6,240 |
| 10-Year Energy Cost | $147,800 | $100,900 | $71,880 |
The key insight was that the premium cylinder, despite costing $1,850 more initially, would save $75,920 in energy costs over its lifecycle compared to the economy option. This 41:1 return on the incremental investment transformed their procurement approach from price-based to value-based decision making.
長期的な維持管理コストを最も正確に予測できる手法はどれか?
Maintenance expenses often represent the most unpredictable aspect of lifecycle costs, making practical prediction approaches essential for informed decision-making.
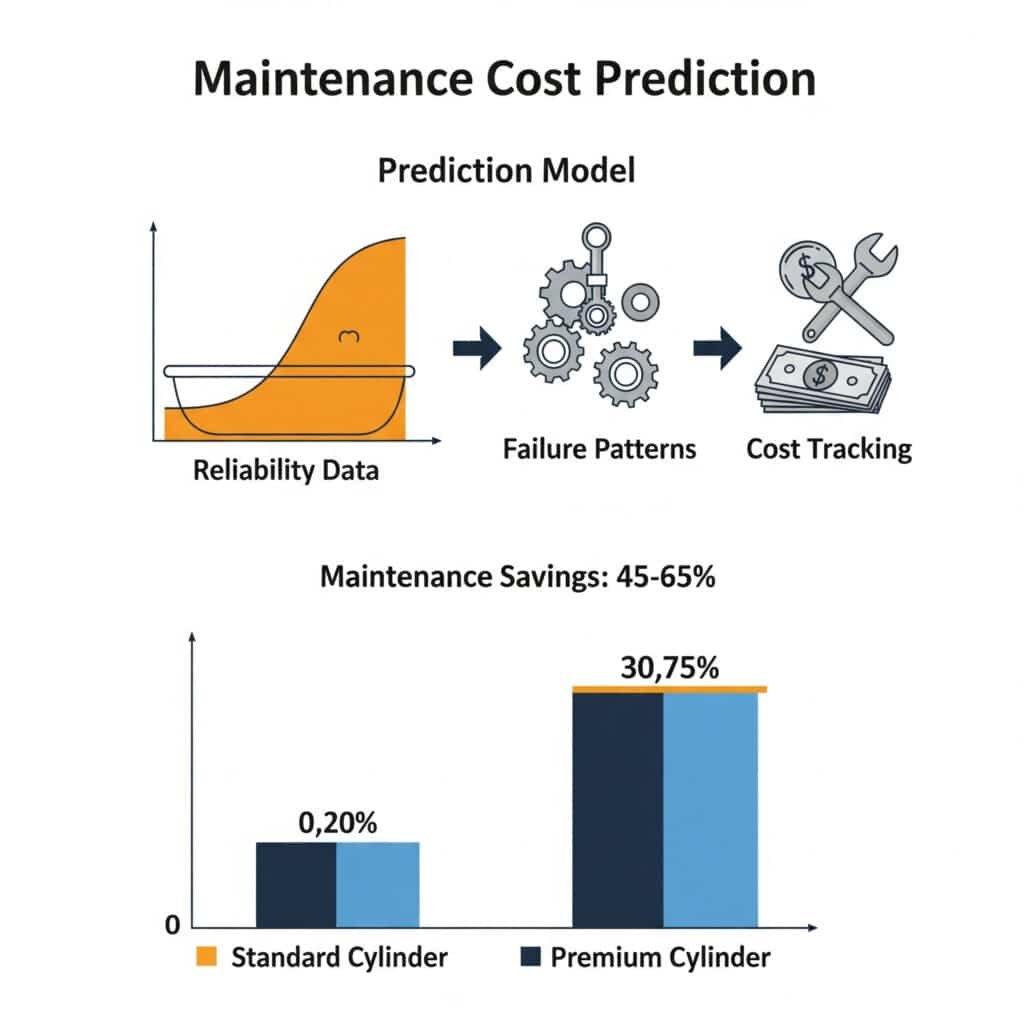
The most effective maintenance cost prediction approaches for rodless cylinders combine reliability data analysis, failure pattern recognition, and comprehensive cost tracking – revealing that premium cylinders typically reduce maintenance costs by 45-65% through extended service intervals, reduced failure rates, and simplified maintenance procedures.
Having developed maintenance strategies for pneumatic systems across multiple industries, I’ve found that most organizations significantly underestimate lifetime maintenance costs by failing to account for both direct and indirect expenses. The key is implementing a practical prediction approach that captures all relevant cost factors.
Practical Maintenance Cost Prediction Approach
An effective maintenance cost prediction model includes these key elements:
1. Reliability Data Analysis
Start with straightforward reliability assessment:
Failure Frequency Analysis
– Track mean time between failures (MTBF)4
– Calculate failure rates
– Identify common failure modes
– Compare reliability across optionsService Life Evaluation
– Determine typical service life
– Identify key limiting factors
– Compare manufacturer specifications
– Validate with real-world experienceMaintenance Interval Comparison
– Document recommended service intervals
– Compare actual maintenance frequency
– Identify preventive maintenance requirements
– Evaluate service complexity
2. Direct Maintenance Cost Tracking
Capture all direct maintenance expenses:
Labor Cost Analysis
– Track maintenance hours per event
– Document skill level requirements
– Calculate labor cost per intervention
– Project annual labor expensesParts and Materials Expenses
– List required replacement components
– Document consumable materials
– Calculate average parts cost per repair
– Project annual parts expensesExternal Service Requirements
– Identify specialized service needs
– Document contractor costs
– Calculate annual service expenses
– Include emergency service provisions
3. Indirect Cost Evaluation
Account for often-overlooked indirect costs:
Production Impact Assessment
– Calculate downtime cost per hour
– Document average repair duration
– Determine production loss per failure
– Project annual production impactQuality and Scrap Considerations
– Identify quality impact of degradation
– Calculate scrap and rework costs
– Document customer impact
– Project annual quality-related expensesInventory and Administrative Overhead
– Determine spare parts inventory requirements
– Calculate inventory carrying costs5
– Document administrative overhead
– Project annual overhead expenses
Real-World Application: Manufacturing Plant Comparison
One of my most practical maintenance cost analyses was for a manufacturing plant comparing three different rodless cylinder options. Their requirements included:
- Projection of 12-year maintenance costs
- Evaluation across multiple maintenance strategies
- Analysis of direct and indirect costs
- Consideration of production impact
We implemented a practical analysis approach:
Reliability Assessment
– Collected historical failure data
– Calculated average MTBF for each option
– Identified common failure modes
– Projected failure frequencyDirect Cost Analysis
– Documented average repair time
– Calculated typical parts costs
– Determined maintenance labor rates
– Projected annual direct maintenance expensesIndirect Cost Evaluation
– Calculated production impact per failure
– Determined quality-related costs
– Assessed inventory requirements
– Projected total maintenance impact
The results revealed dramatic differences:
| メートル法 | Economy Cylinder | Mid-Range Cylinder | Premium Cylinder |
|---|---|---|---|
| MTBF (operating hours) | 4,200 | 7,800 | 12,500 |
| Average Repair Time | 4.8時間 | 3.2 hours | 2.5 hours |
| Parts Cost per Repair | $720 | $890 | $1,150 |
| Annual Direct Maintenance Cost | $9,850 | $5,620 | $3,480 |
| Annual Production Impact Cost | $42,300 | $18,700 | $9,200 |
| 12-Year Maintenance Cost | $625,800 | $291,840 | $152,160 |
The key insight was that the premium cylinder, despite having 60% higher parts costs per repair, would save $473,640 in maintenance costs over 12 years compared to the economy option. The majority of these savings came from reduced production impact rather than direct maintenance expenses, highlighting the importance of considering the complete cost picture.
結論
Comprehensive lifecycle cost analysis for rodless cylinder systems reveals that initial purchase price is often the least significant factor in total ownership costs. By creating accurate initial cost comparison matrices, implementing practical energy efficiency calculations, and developing effective maintenance cost prediction approaches, organizations can make truly informed decisions that optimize long-term financial performance.
The most important insight from my experience implementing these analyses across multiple industries is that premium pneumatic components almost always deliver the lowest total lifecycle cost despite higher initial prices. The combination of reduced energy consumption, lower maintenance requirements, and decreased production impact typically results in 30-50% lower total ownership costs over a 10-year period.
ロッドレスシリンダーのライフサイクルコスト分析に関するよくある質問
プレミアムロッドレスシリンダーの一般的な回収期間は、エコノミーオプションと比較してどの程度ですか?
プレミアムロッドレスシリンダーの一般的な投資回収期間は、ほとんどの産業用途で8~18ヶ月です。エネルギー節約が通常最も早い回収をもたらし、メンテナンスコスト削減はより長期にわたって貢献します。高稼働率用途(稼働率>60%)またはダウンタイムコストが高い運用(>1,000円/時間)では、投資回収期間は3~6ヶ月と短くなります。 正確な投資回収期間の算出において重要なのは、すべてのコスト要因、特に信頼性低下による生産への影響(見過ごされがち)を含めることです。.
ライフサイクルコスト分析において、エネルギーコストの変動をどのように考慮しますか?
ライフサイクルコスト分析におけるエネルギーコスト変動を反映させるため、過去の傾向分析と感度モデリングを組み合わせた手法を推奨します。現在のエネルギーコストを基準値として設定し、地域別の過去データに基づく予測インフレ率(通常年率2~5%)を適用します。異なるインフレ率を用いた複数のシナリオを作成し、結果の感度を把握してください。複数拠点での運用時は、各地域のエネルギーコストを用いて個別に分析を実施します。 エネルギーコストが上昇するほど、エネルギー効率改善の価値はさらに高まることを念頭に置いてください。.
ロッドレスシリンダーのライフサイクル分析において、最も見過ごされがちなコストは何ですか?
ロッドレスシリンダーのライフサイクル分析において最も見過ごされがちなコストには以下が含まれる:計画外ダウンタイム中の生産損失(直接修理費用の5~10倍に及ぶ場合が多い)、性能劣化による品質への影響(通常、生産価値の2~5%)、予備部品の在庫保管コスト(部品価値の年間10~25%)、および保守管理のための管理間接費。 性能劣化による品質への影響(通常、生産価値の2~5%)、予備部品の在庫維持コスト(部品価値の年間10~25%)、保守管理の管理間接費(直接保守コストの15~30%)。さらに、多くの分析では、技術サポート費用、トラブルシューティング時間、新規設備導入に伴う学習曲線のコストが考慮されていない。.
ライフサイクル分析において、予想寿命が異なるシリンダーをどのように比較しますか?
To compare cylinders with different expected lifespans, use a consistent analysis period equal to the longest expected life or a common multiple of the different lifespans. Include replacement costs for shorter-lived components at appropriate intervals. Calculate the net present value (NPV) of all costs using a discount rate that reflects your organization’s cost of capital (typically 8-12%). This approach allows fair comparison by accounting for the timing of expenses and the time value of money. For example, if comparing cylinders with 5-year vs. 10-year lifespans, use a 10-year analysis period and include replacement costs for the 5-year option.
保守コスト予測の精度を向上させるために、どのようなデータを収集すべきか?
保守コスト予測の精度向上のため、以下の主要データポイントを収集する:詳細な故障記録(日付、稼働時間、故障モード、原因)、修理情報(所要時間、部品、工数、必要な技能レベル)、保守履歴(予防保全活動、発見事項、調整内容)、運転条件(圧力、温度、サイクル率、負荷)、生産への影響(ダウンタイム期間、生産損失、品質への影響)。 季節変動を把握するため、このデータを少なくとも12か月間追跡する。最も価値ある知見は、異なる用途や運転条件下にある類似設備を比較し、主要な性能要因を特定することで得られることが多い。.
-
Provides a detailed explanation of Lifecycle Cost Analysis or Total Cost of Ownership (TCO), a financial principle that includes the initial purchase price of an asset plus all direct and indirect operating and maintenance costs over its lifespan. ↩
-
Explains the commissioning phase of a project, which is the systematic process of ensuring that all systems and components are designed, installed, tested, operated, and maintained according to the operational requirements of the owner. ↩
-
Details the difference between ANR (conditions normales de référence), the European standard for “normal” reference conditions (0°C, 1013.25 mbar), and SCFM (Standard Cubic Feet per Minute), the common North American standard. ↩
-
Offers a clear definition of Mean Time Between Failures (MTBF), a key reliability metric that represents the predicted elapsed time between inherent failures of a mechanical or electronic system during normal system operation. ↩
-
Describes inventory carrying costs (or holding costs), which are the total expenses related to storing unsold inventory, including storage space, labor, insurance, and the cost of obsolescence or damage. ↩
