

Every engineer I’ve spoken with faces the same dilemma: you need absolute confidence in your pneumatic components, but traditional reliability testing can delay projects by months. Meanwhile, production deadlines loom closer, and pressure mounts from management wanting results yesterday. This reliability verification gap creates enormous risk.
Effective pneumatic cylinder reliability verification combines accelerated vibration testing1 with appropriate spectrum selection, standardized salt spray exposure cycles, and comprehensive failure mode analysis to compress months of real-world validation into weeks while maintaining statistical confidence.
Last year, I consulted with a medical device manufacturer in Switzerland who was struggling with this exact problem. Their production line was ready, but they couldn’t launch without validating their rodless pneumatic cylinders would maintain precision for at least 5 years. Using our accelerated verification approach, we compressed what would have been 6 months of testing into just 3 weeks, allowing them to launch on schedule while maintaining full confidence in their system reliability.
Table of Contents
- Vibration Test Spectrum Selection
- Salt Spray Test Cycle Comparison
- Failure Mode and Effects Analysis Template
- Conclusion
- FAQs About Reliability Verification
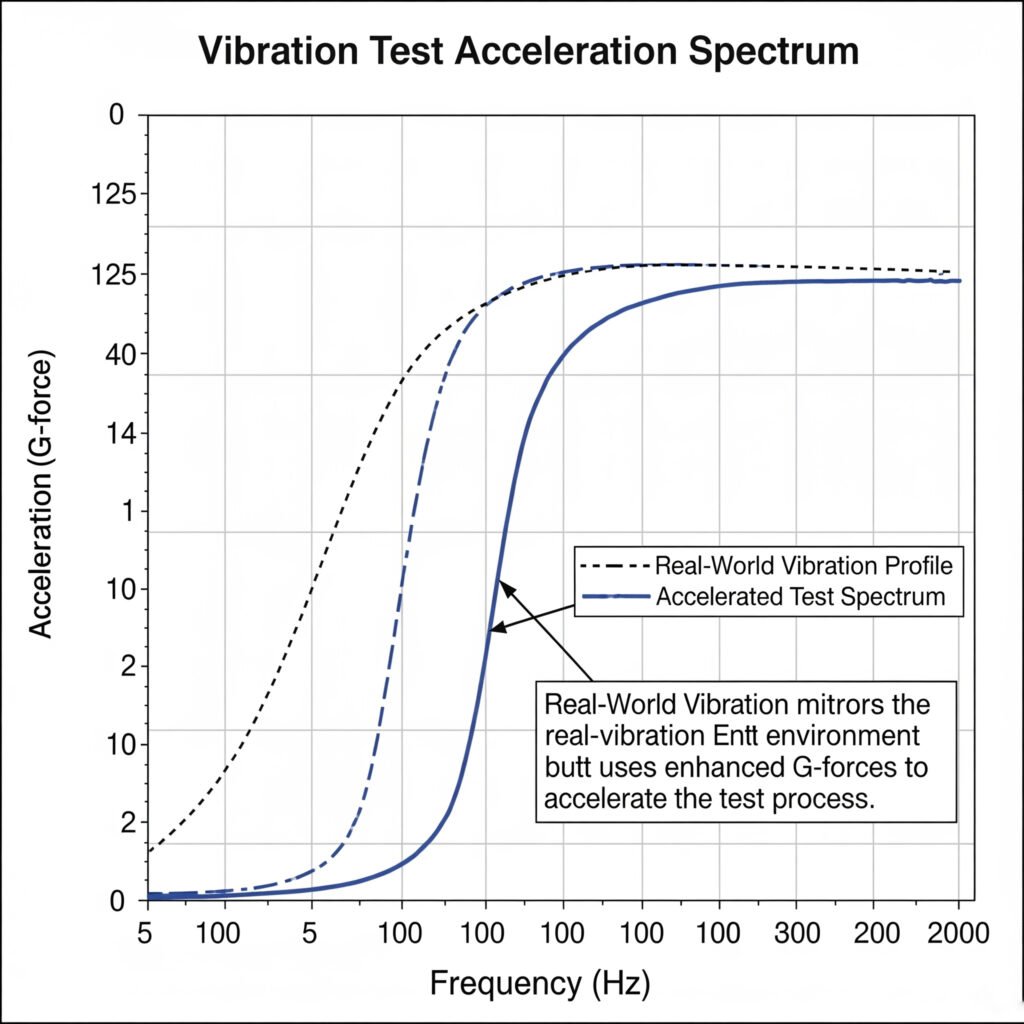
How Do You Select the Right Vibration Test Acceleration Spectrum?
Choosing the wrong vibration test spectrum is one of the most common mistakes I see in reliability verification. Either the spectrum is too aggressive, causing unrealistic failures, or too gentle, missing critical weaknesses that will emerge in real-world use.
The optimal vibration test acceleration spectrum must match your specific application environment while amplifying forces to accelerate testing. For pneumatic systems, a spectrum that covers 5-2000 Hz with appropriate G-force multiplication factors based on the installation environment provides the most accurate predictive results.
Understanding Vibration Profile Categories
After analyzing hundreds of pneumatic system installations, I’ve categorized vibration environments into these profiles:
| Environment Category | Frequency Range | Peak G-Force | Test Duration Factor |
|---|---|---|---|
| Light Industrial | 5-500 Hz | 0.5-2G | 1x |
| General Manufacturing | 5-1000 Hz | 1-5G | 1.5x |
| Heavy Industrial | 5-2000 Hz | 3-10G | 2x |
| Transportation/Mobile | 5-2000 Hz | 5-20G | 3x |
Spectrum Selection Methodology
When helping clients select the right vibration spectrum, I follow this three-step process:
Step 1: Environment Characterization
First, measure or estimate the actual vibration profile in your application environment. If direct measurement isn’t possible, use industry standards as a starting point:
- ISO 20816 for industrial machinery
- MIL-STD-810G2 for transportation applications
- IEC 60068 for general electronic equipment
Step 2: Acceleration Factor Determination
To compress testing time, we need to amplify the vibration forces. The relationship follows this principle:
Test Time = (Actual Life Hours × Actual G-Force²) ÷ (Test G-Force²)
For example, to simulate 5 years (43,800 hours) of operation at 2G in just 168 hours (1 week), you would need to test at:
G-Force = √[(43,800 × 2²) ÷ 168] = approximately 32.3G
Step 3: Spectrum Shaping
The final step is to shape the frequency spectrum to match your application. This is critical for rodless pneumatic cylinders, which have specific resonant frequencies that vary by design.
Case Study: Packaging Equipment Verification
I recently worked with a packaging equipment manufacturer in Germany who was experiencing mysterious failures in their rodless cylinders after approximately 8 months in the field. Their standard testing hadn’t identified the issue.
By measuring the actual vibration profile of their equipment, we discovered a resonant frequency at 873 Hz that was exciting a component in their cylinder design. We developed a custom test spectrum that emphasized this frequency range, and within 72 hours of accelerated testing, we replicated the failure. The manufacturer modified their design, and the problem was solved before affecting additional customers.
Vibration Test Implementation Tips
For the most accurate results, follow these guidelines:
Multi-Axis Testing
Test in all three axes sequentially, as failures often occur in non-obvious directions. For rodless cylinders specifically, torsional vibration can cause failures that pure linear vibration might miss.
Temperature Considerations
Conduct vibration testing at both ambient and maximum operating temperatures. We’ve found that combining elevated temperatures with vibration can reveal failures 2.3x faster than vibration alone.
Data Collection Methods
Use these measurement points for comprehensive data:
- Acceleration at mounting points
- Displacement at mid-span and endpoints
- Internal pressure fluctuations during vibration
- Leak rate before, during, and after testing
What Salt Spray Test Cycles Actually Predict Real-World Corrosion?
Salt spray testing is often misunderstood and misapplied in pneumatic component validation. Many engineers simply follow standard test durations without understanding how they correlate to actual field conditions.
The most predictive salt spray test cycles match your specific operating environment’s corrosion factors. For most industrial pneumatic applications, a cyclic test alternating between 5% NaCl spray (35°C) and dry periods provides significantly better correlation to real-world performance than continuous spray methods.

Correlation Between Test Hours and Field Performance
This comparison table shows how different salt spray test methods correlate to real-world exposure in various environments:
| Environment | Continuous ASTM B1173 | Cyclic ISO 9227 | Modified ASTM G85 |
|---|---|---|---|
| Indoor Industrial | 24h = 1 year | 8h = 1 year | 12h = 1 year |
| Outdoor Urban | 48h = 1 year | 16h = 1 year | 24h = 1 year |
| Coastal | 96h = 1 year | 32h = 1 year | 48h = 1 year |
| Marine/Offshore | 200h = 1 year | 72h = 1 year | 96h = 1 year |
Test Cycle Selection Framework
When advising clients on salt spray testing, I recommend these cycles based on component type and application:
Standard Components (Aluminum/Steel with Basic Finishes)
| Application | Test Method | Cycle Details | Pass Criteria |
|---|---|---|---|
| Indoor Use | ISO 9227 NSS | 24h spray, 24h dry × 3 cycles | No red rust, <5% white rust |
| General Industrial | ISO 9227 NSS | 48h spray, 24h dry × 4 cycles | No red rust, <10% white rust |
| Harsh Environment | ASTM G85 A5 | 1h spray, 1h dry × 120 cycles | No base metal corrosion |
Premium Components (Enhanced Corrosion Protection)
| Application | Test Method | Cycle Details | Pass Criteria |
|---|---|---|---|
| Indoor Use | ISO 9227 NSS | 72h spray, 24h dry × 3 cycles | No visible corrosion |
| General Industrial | ISO 9227 NSS | 96h spray, 24h dry × 4 cycles | No red rust, <5% white rust |
| Harsh Environment | ASTM G85 A5 | 1h spray, 1h dry × 240 cycles | No visible corrosion |
Interpreting Test Results
The key to valuable salt spray testing is proper interpretation of results. Here’s what to look for:
Visual Indicators
- White Rust: Early indicator on zinc surfaces, generally not functional concern
- Red/Brown Rust: Base metal corrosion, indicates coating failure
- Blistering: Indicates coating adhesion failure or subsurface corrosion
- Creep from Scribe: Measures coating protection at damaged areas
Performance Impact Assessment
After salt spray testing, always evaluate these functional aspects:
- Seal Integrity: Measure leak rates before and after exposure
- Actuation Force: Compare required force before and after testing
- Surface Finish: Evaluate changes that might affect mating components
- Dimensional Stability: Check for corrosion-induced swelling or distortion
Case Study: Automotive Component Testing
A major automotive supplier was experiencing premature corrosion failures of pneumatic components in vehicles exported to Middle Eastern countries. Their standard 96-hour salt spray test wasn’t identifying the issue.
We implemented a modified cyclic test that included:
- 4 hours salt spray (5% NaCl at 35°C)
- 4 hours dry-off at 60°C with 30% humidity
- 16 hours humidity exposure at 50°C with 95% RH
- Repeated for 10 cycles
This test successfully identified the failure mechanism within 7 days, revealing that the combination of high temperature and salt was breaking down a specific seal material. After switching to a more suitable compound, field failures dropped by 94%.
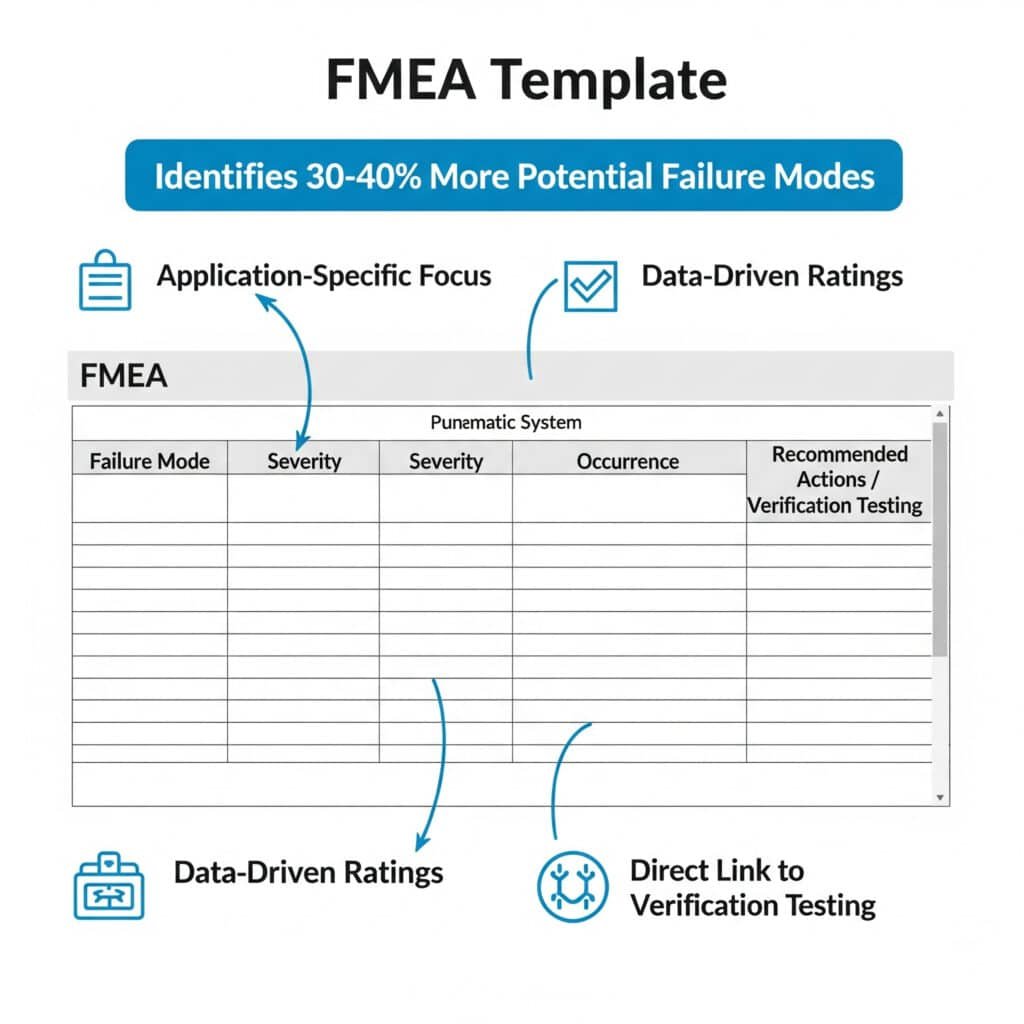
How Can You Create an FMEA4 That Actually Prevents Field Failures?
Failure Mode and Effects Analysis (FMEA) is often treated as a paperwork exercise rather than a powerful reliability tool. Most FMEAs I review are either overly generic or so complex they’re unusable in practice.
An effective FMEA for pneumatic systems focuses on application-specific failure modes, quantifies both likelihood and consequence using data-driven ratings, and directly links to verification testing methods. This approach typically identifies 30-40% more potential failure modes than generic templates.
FMEA Structure for Pneumatic Components
The most effective FMEA template for pneumatic systems includes these key elements:
| Section | Purpose | Key Benefit |
|---|---|---|
| Component Breakdown | Identifies all critical parts | Ensures comprehensive analysis |
| Function Description | Defines intended performance | Clarifies what constitutes failure |
| Failure Modes | Lists specific ways function can fail | Guides targeted testing |
| Effects Analysis | Describes impact on system and user | Prioritizes critical issues |
| Causes Analysis | Identifies root causes | Directs preventive actions |
| Current Controls | Documents existing safeguards | Prevents duplicate efforts |
| Risk Priority Number5 | Quantifies overall risk | Focuses resources on highest risks |
| Recommended Actions | Specifies mitigation steps | Creates actionable plan |
| Verification Method | Links to specific tests | Ensures proper validation |
Developing Application-Specific Failure Modes
Generic FMEAs often miss the most important failure modes because they don’t account for your specific application. I recommend this approach for developing comprehensive failure modes:
Step 1: Function Analysis
Break down each component function into specific performance requirements:
For a rodless pneumatic cylinder, functions include:
- Provide linear motion with specified force
- Maintain position accuracy within tolerance
- Contain pressure without leakage
- Operate within speed parameters
- Maintain alignment under load
Step 2: Environment Factor Mapping
For each function, consider how these environmental factors could cause failure:
| Factor | Potential Impact |
|---|---|
| Temperature | Material property changes, thermal expansion |
| Humidity | Corrosion, electrical issues, friction changes |
| Vibration | Loosening, fatigue, resonance |
| Contamination | Wear, blockage, seal damage |
| Pressure Variation | Stress, deformation, seal failure |
| Cycle Frequency | Fatigue, heat buildup, lubrication breakdown |
Step 3: Interaction Analysis
Consider how components interact with each other and the system:
- Interface points between components
- Energy transfer paths
- Signal/control dependencies
- Material compatibility issues
Risk Assessment Methodology
The traditional RPN (Risk Priority Number) calculation often fails to accurately prioritize risks. I recommend this enhanced approach:
Severity Rating (1-10)
Based on these criteria:
1-2: Negligible impact, no noticeable effect
3-4: Minor impact, slight performance degradation
5-6: Moderate impact, reduced functionality
7-8: Major impact, significant performance loss
9-10: Critical impact, safety concern or complete failure
Occurrence Rating (1-10)
Based on data-driven probability:
1: <1 per million cycles
2-3: 1-10 per million cycles
4-5: 1-10 per 100,000 cycles
6-7: 1-10 per 10,000 cycles
8-10: >1 per 1,000 cycles
Detection Rating (1-10)
Based on verification capability:
1-2: Certain detection before customer impact
3-4: High probability of detection
5-6: Moderate chance of detection
7-8: Low probability of detection
9-10: Cannot be detected with current methods
Linking FMEA to Verification Testing
The most valuable aspect of a proper FMEA is creating direct links to verification testing. For each failure mode, specify:
- Test Method: The specific test that will verify this failure mode
- Test Parameters: The exact conditions required
- Pass/Fail Criteria: Quantitative acceptance standards
- Sample Size: Statistical confidence requirements
Case Study: FMEA-Driven Design Improvement
A medical equipment manufacturer in Denmark was developing a new device using rodless pneumatic cylinders for precise positioning. Their initial FMEA was generic and missed several critical failure modes.
Using our application-specific FMEA process, we identified a potential failure mode where vibration could cause gradual misalignment of the cylinder’s bearing system. This wasn’t captured in their standard testing.
We developed a combined vibration and cycle test that simulated 5 years of operation in 2 weeks. The test revealed a gradual performance degradation that would have been unacceptable in the medical application. By modifying the bearing design and adding a secondary alignment mechanism, the issue was resolved before product launch.
Conclusion
Effective reliability verification for pneumatic systems requires thoughtfully selected vibration test spectrums, application-appropriate salt spray test cycles, and comprehensive failure mode analysis. By integrating these three approaches, you can dramatically reduce verification time while actually increasing confidence in long-term reliability.
FAQs About Reliability Verification
What is the minimum sample size needed for reliable pneumatic component testing?
For pneumatic components like rodless cylinders, statistical confidence requires testing at least 5 units for qualification testing and 3 units for ongoing quality verification. Critical applications may require larger samples of 10-30 units to detect lower probability failure modes.
How do you determine the appropriate acceleration factor for reliability testing?
The appropriate acceleration factor depends on the failure mechanisms being tested. For mechanical wear, factors of 2-5x are typical. For thermal aging, 10x is common. For vibration testing, factors of 5-20x can be applied. Higher factors risk inducing unrealistic failure modes.
Can salt spray test results predict actual corrosion resistance in years?
Salt spray testing provides relative, not absolute, corrosion resistance predictions. The correlation between test hours and actual years varies significantly by environment. For industrial indoor environments, 24-48 hours of continuous salt spray typically represents 1-2 years of exposure.
What’s the difference between DFMEA and PFMEA for pneumatic components?
Design FMEA (DFMEA) focuses on inherent design weaknesses in pneumatic components, while Process FMEA (PFMEA) addresses potential failures introduced during manufacturing. Both are necessary – DFMEA ensures the design is robust, while PFMEA ensures consistent production quality.
How often should reliability verification testing be repeated during production?
Full reliability verification should be conducted during initial qualification and whenever significant design or process changes occur. Abbreviated verification (focusing on critical parameters) should be performed quarterly, with statistical sampling based on production volume and risk level.
What environmental factors have the biggest impact on rodless pneumatic cylinder reliability?
The most significant environmental factors affecting rodless pneumatic cylinder reliability are temperature fluctuations (affecting seal performance), particulate contamination (causing accelerated wear), and vibration (impacting bearing alignment and seal integrity). These three factors account for approximately 70% of premature failures.
-
Explains the principles of Accelerated Life Testing (ALT), a process of testing a product by subjecting it to conditions (such as stress, strain, temperature, voltage, vibration rate) in excess of its normal service parameters to determine its lifespan in a shorter amount of time. ↩
-
Provides an overview of MIL-STD-810, a U.S. Military Standard that outlines environmental engineering considerations and laboratory tests, focusing on its widely used methods for vibration testing that simulate real-world conditions for equipment. ↩
-
Details the ASTM B117 standard, which provides the standardized procedure for operating a neutral salt spray (fog) apparatus, a common and long-standing corrosion test used to evaluate the relative corrosion resistance of materials and coatings. ↩
-
Offers a comprehensive explanation of Failure Mode and Effects Analysis (FMEA), a systematic, proactive approach for identifying potential failure modes in a design, process, or product, and assessing the risk associated with those failures. ↩
-
Describes the method for calculating the Risk Priority Number (RPN) in an FMEA, which is a quantitative ranking of risk calculated by multiplying the scores for Severity, Occurrence, and Detection, used to prioritize corrective actions. ↩
