Have you ever walked onto your factory floor and been hit by that unmistakable hiss of pneumatic systems? That noise isn’t just an annoyance—it represents wasted energy, potential regulatory issues, and a warning sign of inefficient operation.
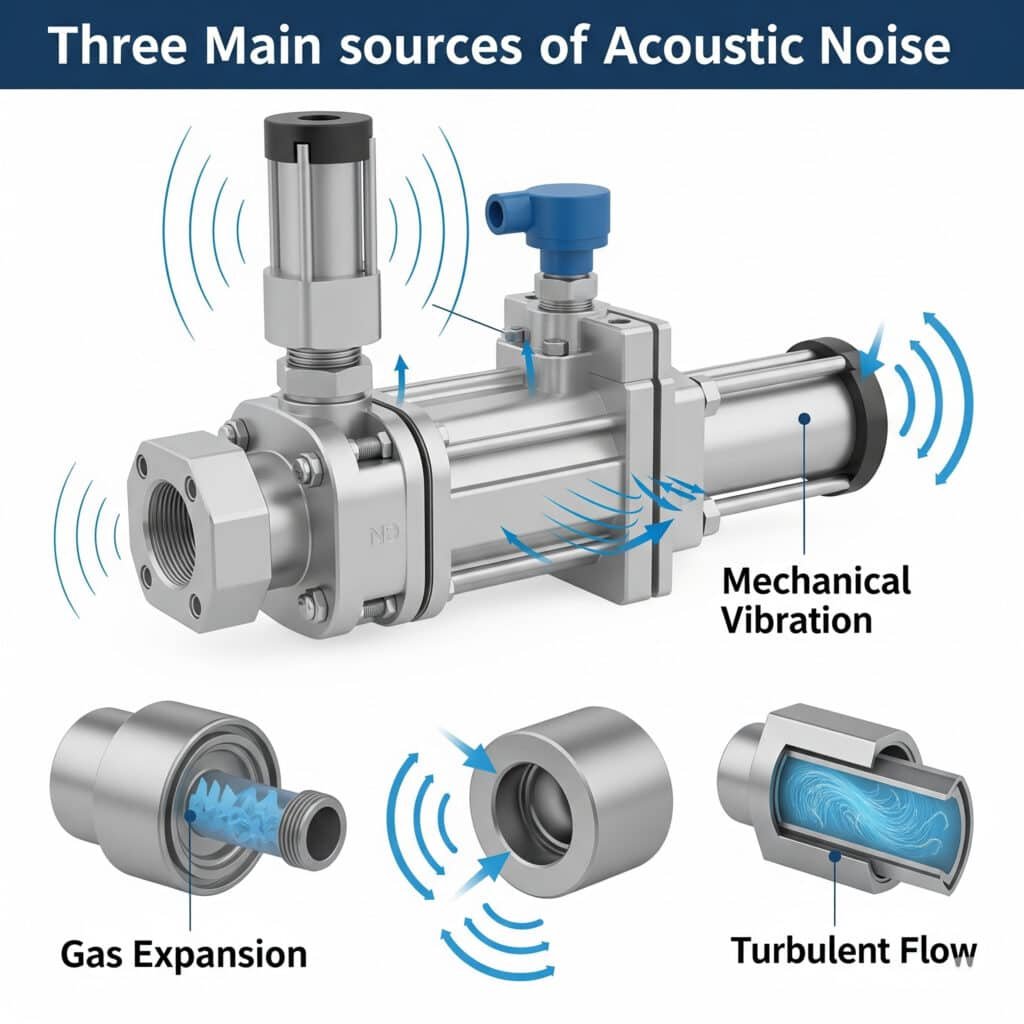
Le bruit acoustique dans les systèmes pneumatiques est généré par trois mécanismes principaux : l'expansion du gaz lors des dépressions, la vibration mécanique des composants et l'écoulement turbulent dans les tuyaux et les raccords. La compréhension de ces mécanismes permet aux ingénieurs de mettre en œuvre des stratégies de réduction du bruit ciblées qui améliorent la sécurité sur le lieu de travail, augmentent l'efficacité énergétique et prolongent la durée de vie des équipements.
Last month, I visited a pharmaceutical manufacturing facility in New Jersey where excessive noise from their rodless cylinders was causing regulatory concerns. Their team had tried generic solutions without success. By analyzing the specific noise generation mechanisms, we reduced their system noise by 14 dBA—taking it from a regulatory risk to well within compliance. Let me show you how we did it.
Table des matières
- Gas Expansion Sound Level: What Formula Predicts Pneumatic Exhaust Noise?
- Mechanical Vibration Spectrum: How Can Frequency Analysis Identify Noise Sources?
- Muffler Insertion Loss: What Calculations Drive Effective Silencer Design?
- Conclusion
- FAQs About Pneumatic System Noise
Gas Expansion Sound Level: What Formula Predicts Pneumatic Exhaust Noise?
The sudden expansion of compressed air during valve operation or cylinder exhaust creates one of the most significant noise sources in pneumatic systems. Understanding the mathematical relationship between system parameters and noise output is essential for effective mitigation.
The sound power level from gas expansion can be calculated using the formula: Lw = 10 log₁₀(W/W₀), where W is the acoustic power in watts and W₀ is the reference power (10⁻¹² watts). For pneumatic systems, W can be estimated as W = η × m × (c²/2), where η is the acoustic efficiency, m is the mass flow rate, and c is the gas velocity.
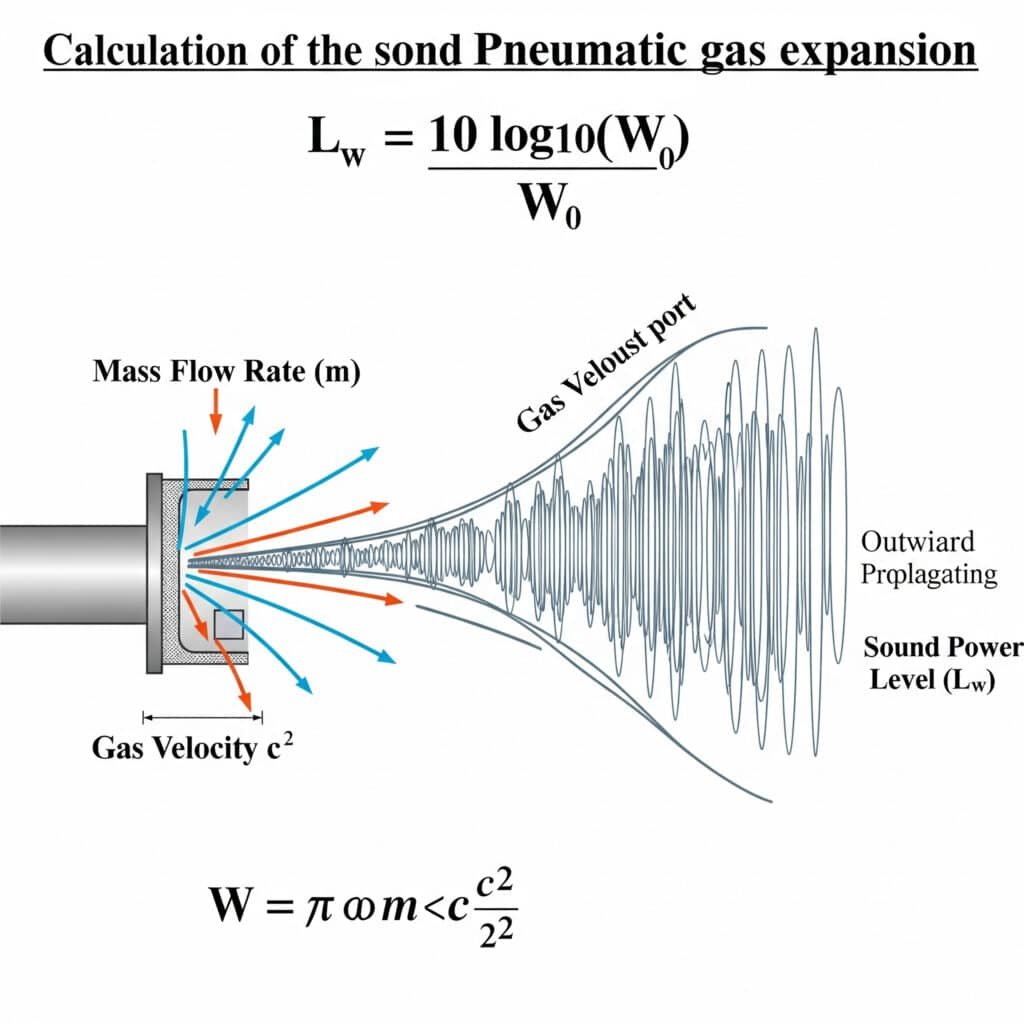
I remember troubleshooting a packaging line in Illinois where the noise levels exceeded 95 dBA—well above OSHA limits1. The maintenance team had been focusing on mechanical sources, but our analysis revealed that 70% of the noise came from exhaust ports. By applying the gas expansion formula, we identified that their operating pressure was 2.2 bar higher than needed, creating excessive exhaust noise. This simple pressure adjustment reduced noise by 8 dBA without affecting performance.
Fundamental Gas Expansion Noise Equations
Let’s break down the key formulas for predicting expansion noise:
Sound Power Calculation
The acoustic power generated by expanding gas can be calculated as:
W = η × m × (c²/2)
Où ?
- W = Acoustic power (watts)
- η = Acoustic efficiency (typically 0.001-0.01 for pneumatic exhausts)
- m = Mass flow rate (kg/s)
- c = Gas velocity at exhaust (m/s)
The sound power level in decibels is then:
Lw = 10 log₁₀(W/W₀)
Where W₀ is the reference power of 10⁻¹² watts.
Mass Flow Rate Determination
The mass flow rate through an orifice can be calculated as:
m = Cd × A × p₁ × √(2γ/(γ-1) × (RT₁) × [(p₂/p₁)^(2/γ) – (p₂/p₁)^((γ+1)/γ)])
Où ?
- Cd = Discharge coefficient (typically 0.6-0.8)
- A = Orifice area (m²)
- p₁ = Upstream absolute pressure (Pa)
- p₂ = Downstream absolute pressure (Pa)
- γ = Rapport de chaleur spécifique (1,4 pour l'air)
- R = Gas constant for air (287 J/kg·K)
- T₁ = Upstream temperature (K)
For choked flow (common in pneumatic exhausts), this simplifies to:
m = Cd × A × p₁ × √(γ/(RT₁)) × (2/(γ+1))^((γ+1)/(2(γ-1)))
Factors Affecting Gas Expansion Noise
| Facteur | Impact on Noise Level | Mitigation Approach |
|---|---|---|
| Pression de fonctionnement | 3-4 dBA increase per bar | Reduce system pressure to minimum required |
| Exhaust Port Size | Smaller ports increase velocity and noise | Use properly sized ports for flow requirements |
| Exhaust Temperature | Higher temperatures increase noise | Allow cooling before expansion where possible |
| Expansion Ratio | Higher ratios create more noise | Stage expansion through multiple steps |
| Débit | Doubling flow increases noise by ~3 dBA | Use multiple smaller exhausts instead of one large one |
Practical Noise Prediction Example
For a typical rodless cylinder with:
- Operating pressure: 6 bar (600,000 Pa)
- Exhaust port diameter: 4mm (area = 1.26 × 10⁻⁵ m²)
- Discharge coefficient: 0.7
- Acoustic efficiency: 0.005
The mass flow rate during exhaust would be approximately:
m = 0.7 × 1.26 × 10⁻⁵ × 600,000 × 0.0404 = 0.0214 kg/s
Assuming an exhaust velocity of 343 m/s (sonic velocity), the acoustic power would be:
W = 0.005 × 0.0214 × (343²/2) = 6.29 watts
The resulting sound power level:
Lw = 10 log₁₀(6.29/10⁻¹²) = 128 dB
This high sound power level explains why unsilenced pneumatic exhausts are such significant noise sources in industrial environments.
Mechanical Vibration Spectrum: How Can Frequency Analysis Identify Noise Sources?
Mechanical vibrations in pneumatic components generate distinctive noise signatures that can be analyzed to pinpoint specific problems. Frequency spectrum analysis provides the key to identifying and addressing these mechanical noise sources.
Mechanical vibration in pneumatic systems produces noise with characteristic frequency spectra that can be analyzed using Fast Fourier Transform (FFT)2 techniques. Key frequency ranges include low-frequency structural vibrations (10-100 Hz), mid-frequency operational harmonics (100-1000 Hz), and high-frequency flow-induced vibrations (1-10 kHz), each requiring different mitigation approaches.
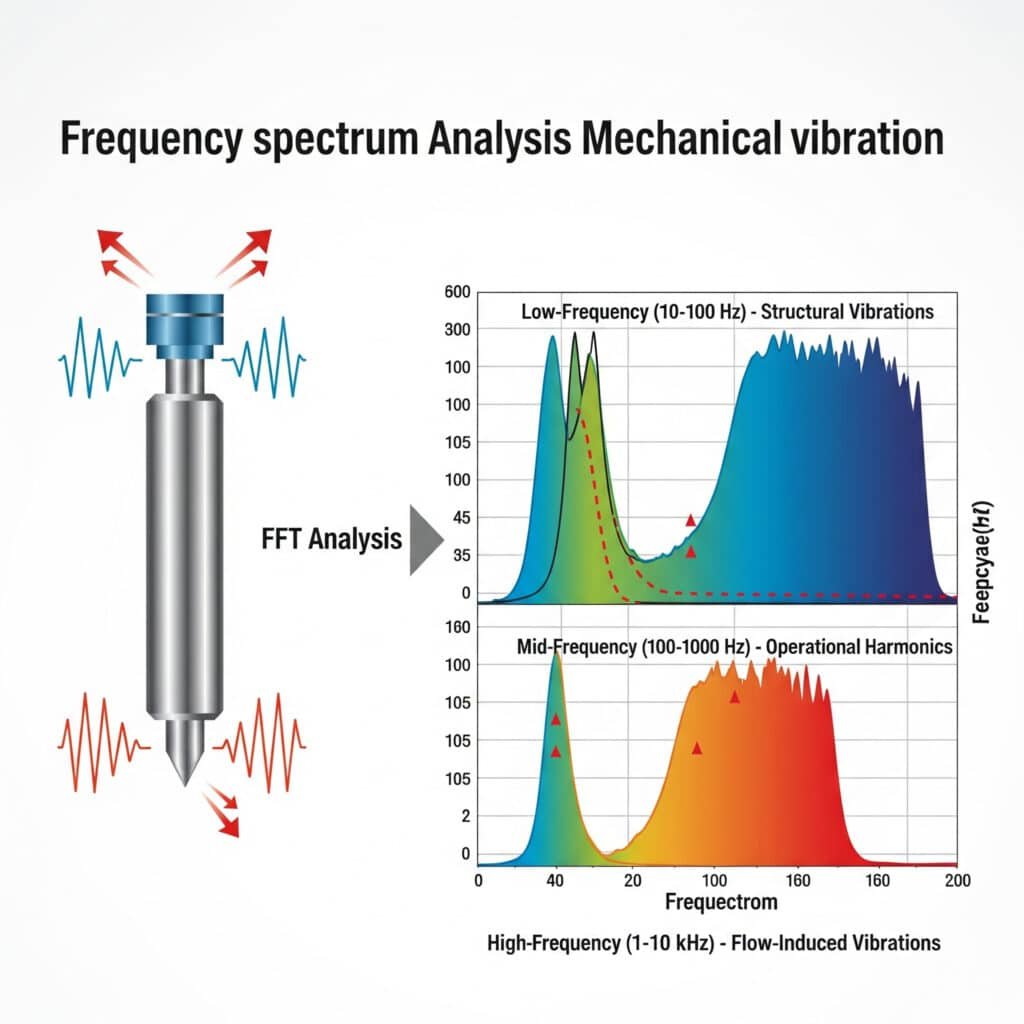
During a consultation at an automotive parts manufacturer in Michigan, their maintenance team was struggling with excessive noise from a rodless cylinder transfer system. Conventional troubleshooting had failed to identify the source. Our vibration spectrum analysis revealed a distinct peak at 237 Hz—exactly matching the cylinder’s internal sealing band resonance. By modifying the mounting system to dampen this specific frequency, we reduced noise by 11 dBA without any production interruption.
Frequency Spectrum Analysis Methodology
Effective vibration analysis follows a systematic approach:
- Measurement Setup: Using accelerometers and acoustic microphones
- Data Acquisition: Capturing time-domain vibration signals
- FFT Analysis: Converting to frequency domain
- Spectral Mapping: Identifying characteristic frequencies
- Source Attribution: Matching frequencies to specific components
Characteristic Frequency Ranges in Pneumatic Systems
| Gamme de fréquences | Typical Sources | Acoustic Characteristics |
|---|---|---|
| 10-50 Hz | Structural resonance, mounting issues | Low-frequency rumble, felt more than heard |
| 50-200 Hz | Piston impacts, valve actuation | Distinct thumping or knocking |
| 200-500 Hz | Seal friction, internal resonance | Mid-frequency buzzing or humming |
| 500-2000 Hz | Flow turbulence, pressure pulsations | Hissing with tonal components |
| 2-10 kHz | Leakage, high-velocity flow | Sharp hissing, most annoying to human ear |
| >10 kHz | Micro-turbulence, gas expansion | Ultrasonic components, energy loss indicator |
Vibration Transmission Paths
Noise from mechanical vibrations follows multiple paths:
Structure-Borne Transmission
Vibrations travel through solid components:
- Component vibrates due to internal forces
- Vibration transfers through mounting points
- Connected structures amplify and radiate sound
- Large surfaces act as efficient sound radiators
Airborne Transmission
Direct radiation of sound from vibrating surfaces:
- Surface vibration displaces air
- Displacement creates pressure waves
- Waves propagate through air
- Size of radiating surface determines efficiency
Case Study: Rodless Cylinder Vibration Analysis
For a magnetic rodless cylinder exhibiting excessive noise:
| Frequency (Hz) | Amplitude (dB) | Source Identification | Stratégie d'atténuation |
|---|---|---|---|
| 43 | 78 | Mounting resonance | Stiffened mounting bracket |
| 86 | 65 | Harmonic of mounting resonance | Addressed with primary resonance |
| 237 | 91 | Sealing band resonance | Added damping material to cylinder body |
| 474 | 83 | Harmonic of sealing band | Addressed with primary resonance |
| 1250 | 72 | Air flow turbulence | Modified port design |
| 3700 | 68 | Leakage at end caps | Replaced seals |
The combined mitigation strategies reduced overall noise by 14 dBA, with the most significant improvement coming from addressing the 237 Hz resonance.
Advanced Vibration Analysis Techniques
Beyond basic FFT analysis, several advanced techniques provide deeper insights:
Order Analysis
Particularly useful for variable-speed systems:
- Tracks frequencies that scale with operational speed
- Separates speed-dependent from fixed-frequency components
- Identifies issues related to specific motion phases
Operational Deflection Shape (ODS) Analysis
Maps vibration patterns across the entire system:
- Multiple measurement points create vibration “map”
- Reveals how structures move during operation
- Identifies optimal locations for damping treatments
Modal Analysis
Determines natural frequencies and mode shapes:
- Identifies resonant frequencies before operation
- Predicts potential problem frequencies
- Guides structural modifications to avoid resonance
Muffler Insertion Loss: What Calculations Drive Effective Silencer Design?
Mufflers and silencers are critical for reducing pneumatic system noise, but their design must be based on sound engineering calculations to ensure effectiveness without compromising system performance.
Silencieux insertion loss3 (IL) quantifies noise reduction effectiveness and can be calculated as IL = Lw₁ – Lw₂, where Lw₁ is the sound power level without the muffler and Lw₂ is the level with the muffler installed. For pneumatic systems, effective mufflers typically achieve 15-30 dB insertion loss across the critical 500 Hz to 4 kHz frequency range while maintaining acceptable backpressure.
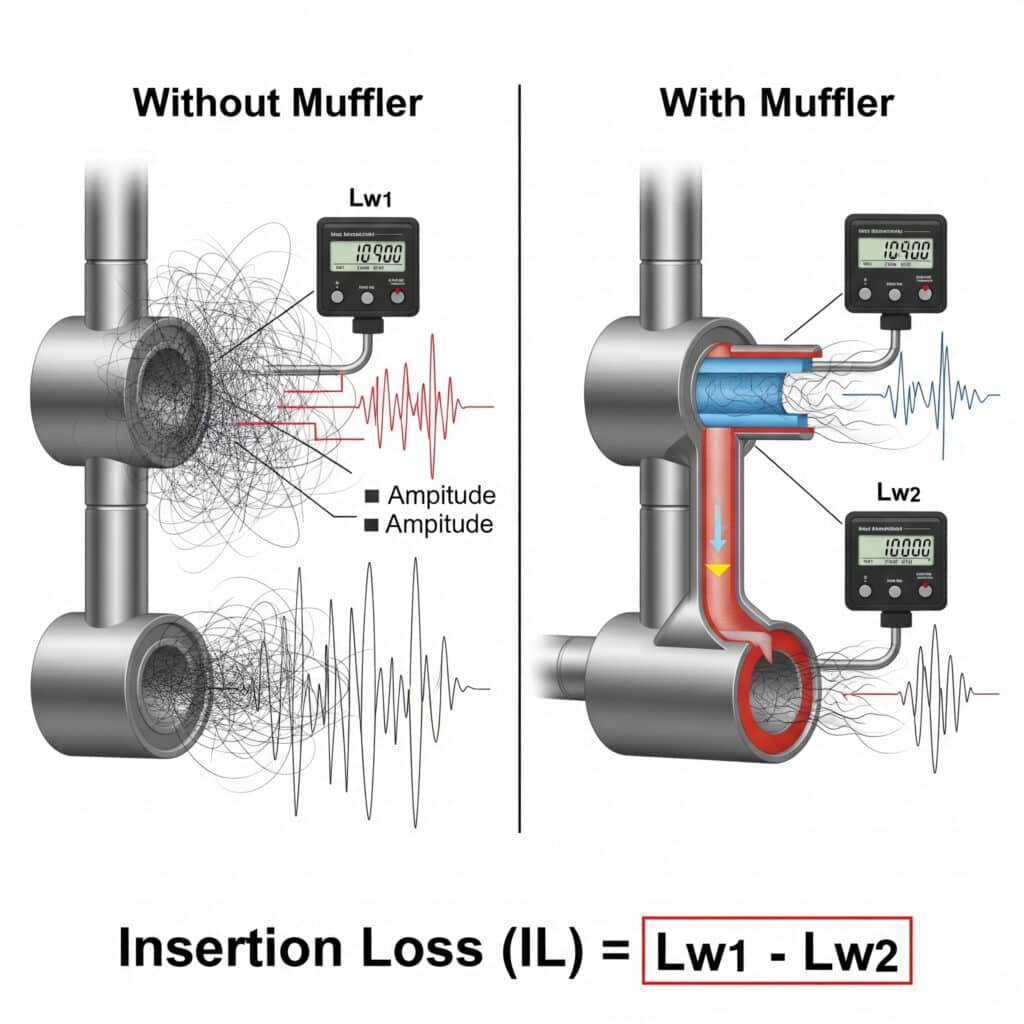
I recently helped a medical device manufacturer in Massachusetts solve a challenging noise problem with their precision rodless cylinder system. Their initial attempt at using off-the-shelf mufflers reduced noise but created excessive backpressure that affected cycle times. By calculating the required insertion loss across specific frequency bands and designing a custom multi-chamber muffler, we achieved 24 dB noise reduction with minimal performance impact. The result was a system that met both their noise and precision requirements.
Muffler Insertion Loss Fundamentals
The core equation for insertion loss is:
IL = Lw₁ – Lw₂
Où ?
- IL = Insertion loss (dB)
- Lw₁ = Sound power level without muffler (dB)
- Lw₂ = Sound power level with muffler (dB)
For frequency-specific analysis, this becomes:
IL(f) = Lw₁(f) – Lw₂(f)
Where f indicates the specific frequency band being analyzed.
Muffler Design Parameters and Their Effects
| Paramètres | Effect on Insertion Loss | Effect on Backpressure | Optimal Range |
|---|---|---|---|
| Chamber Volume | Larger volume increases low-frequency IL | Minimal impact if properly designed | 10-30× exhaust port volume |
| Number of Chambers | More chambers increase mid-frequency IL | Increases with more chambers | 2-4 chambers for most applications |
| Expansion Ratio | Higher ratios improve IL | Minimal impact if gradual | 4:1 to 16:1 area ratio |
| Acoustic Material | Improves high-frequency IL | Minimal impact with proper design | 10-50 mm thickness |
| Baffle Perforation | Affects mid-frequency IL | Significant impact | 30-50% open area |
| Flow Path Length | Longer paths improve low-frequency IL | Increases with length | 3-10× port diameter |
Theoretical Models for Insertion Loss Prediction
Several models can predict insertion loss for different muffler types:
Expansion Chamber Model
For simple expansion chambers:
IL = 10 log₁₀[1 + 0.25(m-1/m)² sin²(kL)]
Où ?
- m = Area ratio (chamber area / pipe area)
- k = Wave number (2πf/c, where f is frequency and c is sound speed)
- L = Chamber length
Dissipative Muffler Model
For mufflers with sound-absorbing materials:
IL = 8.68α(L/d)
Où ?
- α = Absorption coefficient of material
- L = Length of lined section
- d = Diameter of flow path
Reactive Muffler Model (Résonateur de Helmholtz4)
For resonator-type mufflers:
IL = 10 log₁₀[1 + (ρc/2S)² × (V/L’c²) × ω²/((ω₀² – ω²)² + (Rω/ρc)²)]
Où ?
- ρ = Air density
- c = Vitesse du son
- S = Neck cross-sectional area
- V = Cavity volume
- L’ = Effective neck length
- ω = Angular frequency
- ω₀ = Resonance frequency
- R = Acoustic resistance
Practical Muffler Selection Process
To select or design an appropriate muffler:
- Measure Noise Spectrum: Determine frequency content of noise
- Calculate Required IL: Determine necessary reduction by frequency
- Assess Flow Requirements: Calculate maximum allowable backpressure
- Select Muffler Type:
– Reactive (expansion chambers) for low frequencies
– Dissipative (absorptive) for high frequencies
– Combination for broadband noise - Vérifier les performances: Test insertion loss and backpressure
Backpressure Considerations
Excessive backpressure can significantly impact system performance:
Backpressure Calculation
Backpressure can be estimated as:
ΔP = ρ(Q/Cd×A)²/2
Où ?
- ΔP = Pressure drop (Pa)
- ρ = Air density (kg/m³)
- Q = Flow rate (m³/s)
- Cd = Discharge coefficient
- A = Effective flow area (m²)
Performance Impact Assessment
For a rodless cylinder with:
- Diamètre de l'alésage : 40 mm
- Stroke: 500mm
- Durée du cycle : 2 secondes
- Pression de service : 6 bar
Each 0.1 bar of backpressure would:
- Reduce force output by approximately 1.7%
- Increase cycle time by approximately 2.3%
- Increase energy consumption by approximately 1.5%
Case Study: Custom Muffler Design
For a precision rodless cylinder application with strict noise requirements:
| Paramètres | Initial Condition | Off-the-Shelf Muffler | Custom Design |
|---|---|---|---|
| Sound Level | 89 dBA | 76 dBA | 65 dBA |
| Backpressure | 0.05 bar | 0.42 bar | 0.11 bar |
| Durée du cycle | 1.8 seconds | 2.3 seconds | 1.9 seconds |
| Réponse en fréquence | Broadband | Poor at 2-4 kHz | Optimized across spectrum |
| Durée de vie | N/A | 3 months (clogging) | >12 months |
| Coût de la mise en œuvre | N/A | $120 per point | $280 per point |
The custom muffler design provided superior noise reduction while maintaining acceptable system performance, with a return on investment period of less than 6 months when considering productivity improvements.
Conclusion
Understanding acoustic noise generation mechanisms—gas expansion sound levels, mechanical vibration spectra, and muffler insertion loss calculations—provides the foundation for effective noise control in pneumatic systems. By applying these principles, you can create quieter, more efficient, and more reliable pneumatic systems while ensuring regulatory compliance and improving workplace conditions.
FAQs About Pneumatic System Noise
Quelles sont les limites OSHA pour l'exposition au bruit des systèmes pneumatiques ?
L'OSHA limite l'exposition au bruit sur le lieu de travail à 90 dBA pour une moyenne pondérée dans le temps de 8 heures, avec un taux de change de 5 dBA. Toutefois, la limite d'exposition recommandée par le NIOSH est plus prudente et se situe à 85 dBA. Les systèmes pneumatiques dépassent souvent ces limites, les échappements non silencieux générant souvent 90 à 110 dBA à un mètre de distance, ce qui nécessite des contrôles techniques pour s'y conformer.
Comment la pression de fonctionnement affecte-t-elle le bruit des systèmes pneumatiques ?
La pression de fonctionnement a un impact significatif sur la production de bruit, chaque augmentation de pression de 1 bar ajoutant généralement 3 à 4 dBA aux niveaux de bruit d'échappement. Cette relation est logarithmique plutôt que linéaire, car la puissance sonore augmente avec le carré du rapport de pression. La réduction de la pression du système au minimum requis pour le fonctionnement est souvent la stratégie de réduction du bruit la plus simple et la plus rentable.
What’s the difference between reactive and dissipative mufflers for pneumatic systems?
Les silencieux réactifs utilisent des chambres et des passages pour réfléchir les ondes sonores et créer des interférences destructrices, ce qui les rend efficaces pour les bruits de basse fréquence (inférieurs à 500 Hz) avec une perte de charge minimale. Les silencieux dissipatifs utilisent des matériaux absorbant le son pour convertir l'énergie acoustique en chaleur, ce qui les rend plus efficaces pour les bruits à haute fréquence (au-dessus de 500 Hz) mais plus sensibles à la contamination. De nombreux silencieux pneumatiques industriels combinent les deux principes pour une réduction du bruit à large bande.
Comment puis-je identifier la source de bruit dominante dans mon système pneumatique ?
Utilisez une approche systématique en commençant par des essais opérationnels : faites fonctionner le système à différentes pressions, vitesses et charges tout en mesurant le bruit. Ensuite, isolez les composants en faisant fonctionner chaque élément séparément. Enfin, procédez à une analyse des fréquences à l'aide d'un sonomètre à bande d'octave - les basses fréquences (50-250 Hz) indiquent généralement des problèmes structurels, les fréquences moyennes (250-2000 Hz) suggèrent un bruit de fonctionnement, et les hautes fréquences (2-10 kHz) indiquent des problèmes d'écoulement ou de fuite.
What’s the relationship between noise level and distance from a pneumatic component?
Le bruit des composants pneumatiques suit la loi de l'inverse du carré en champ libre, diminuant d'environ 6 dB chaque fois que la distance double. Cependant, dans les environnements industriels typiques avec des surfaces réfléchissantes, la réduction réelle n'est souvent que de 3 à 4 dB par doublement de la distance en raison de la réverbération. Cela signifie qu'en doublant la distance par rapport à une source de bruit de 90 dB, le niveau ne sera réduit que de 86 à 87 dB, au lieu des 84 dB théoriques.
-
Provides the official Occupational Safety and Health Administration (OSHA) regulations and permissible exposure limits (PELs) for noise in the workplace, which is a key driver for acoustic mitigation. ↩
-
Explains the Fast Fourier Transform (FFT) algorithm, a critical mathematical tool used to convert a time-domain signal (like a vibration or sound wave) into its constituent frequency components for analysis. ↩
-
Describes modal analysis, an advanced engineering technique used to determine the inherent dynamic properties of a system, such as its natural frequencies and mode shapes, to predict and avoid resonance. ↩
-
Offers a detailed explanation of Insertion Loss (IL), the primary metric used to quantify the performance of a muffler or silencer by measuring the sound level reduction it provides. ↩

