

Have you ever noticed mysterious vibrations in your pneumatic lines? Or unexplained force variations in your cylinders despite stable supply pressure? These phenomena aren’t random—they’re the result of pressure waves propagating through your system, creating effects that can range from minor inefficiencies to catastrophic failures.
Pressure fluctuations in pneumatic systems are wave phenomena that propagate at speeds approaching the speed of sound1, creating dynamic effects including resonance, standing waves2, and pressure amplification. Understanding these fluctuations is crucial because they can cause component fatigue, control instability, and energy losses of 10-25% in typical industrial systems3.
Last month, I consulted for an automotive assembly plant in Tennessee where a critical pneumatic clamping system was experiencing intermittent force variations despite stable supply pressure. Their maintenance team had replaced valves, regulators, and even the entire air preparation unit4 without success. By analyzing the pressure wave dynamics—particularly the standing wave patterns in their supply lines—we identified that they were operating at a frequency that created destructive interference at the cylinder. A simple adjustment to their line length eliminated the issue and saved them weeks of production delays. Let me show you how understanding pressure fluctuation theory can transform your pneumatic system reliability.
Table of Contents
- Wave Propagation Velocity: How Fast Do Pressure Disturbances Travel in Your System?
- Standing Wave Verification: How Do Resonant Frequencies Create Performance Problems?
- Pulse Attenuation Methods: What Techniques Effectively Dampen Destructive Pressure Oscillations?
- Conclusion
- FAQs About Pressure Fluctuations in Pneumatic Systems
Wave Propagation Velocity: How Fast Do Pressure Disturbances Travel in Your System?
Understanding how quickly pressure disturbances propagate through pneumatic systems is fundamental to predicting and controlling their effects. The propagation velocity determines system response time, resonant frequencies, and potential for destructive interference.
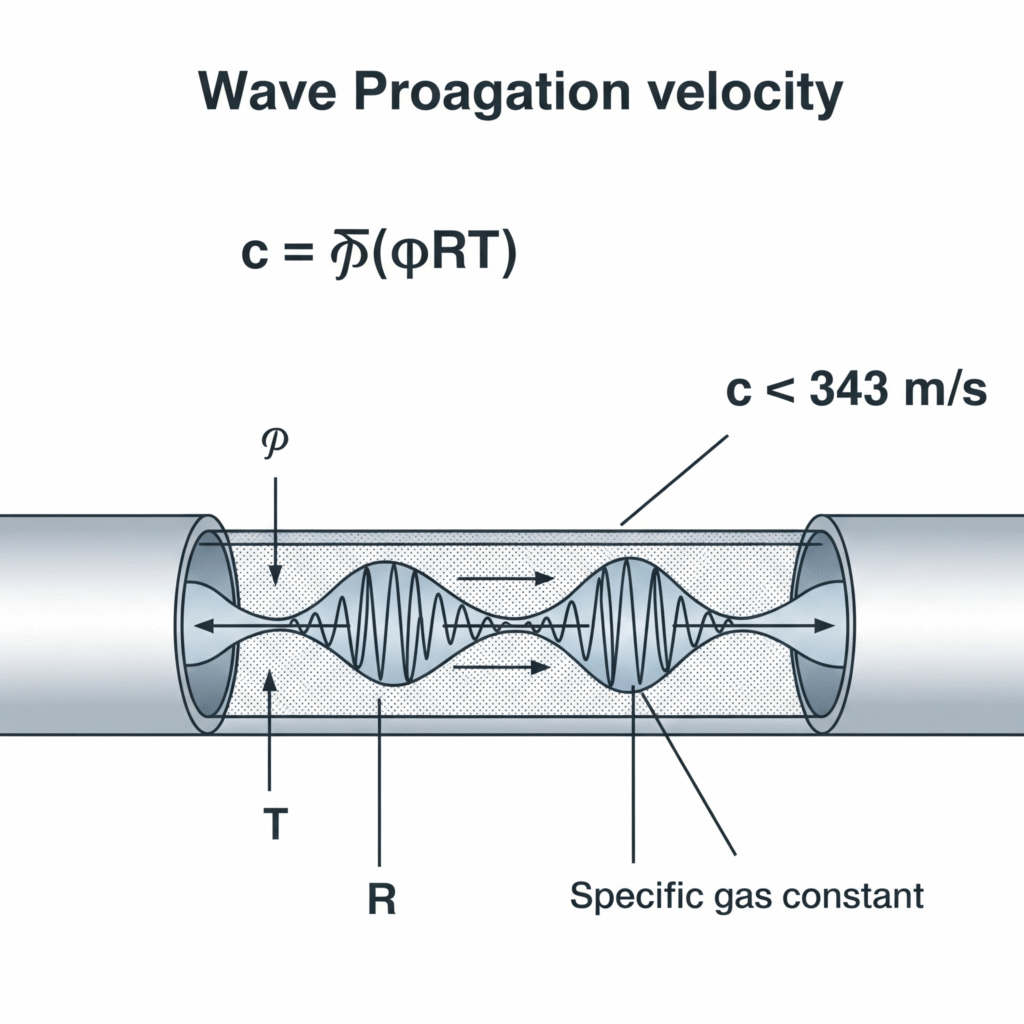
Pressure waves in pneumatic systems travel at the speed of sound in the gas medium, which can be calculated using the formula c = √(γRT), where γ is the specific heat ratio, R is the specific gas constant, and T is the absolute temperature. For air at 20°C, this equates to approximately 343 m/s, though this velocity is modified by factors including pipe elasticity, gas compressibility, and flow conditions.
I recently helped troubleshoot a precision assembly machine in Switzerland where pneumatic grippers were experiencing a 12ms delay between activation and force application—an eternity in a high-speed production environment. Their engineers had assumed instantaneous pressure transmission. By measuring the actual wave propagation velocity in their system (328 m/s) and accounting for the 4-meter line length, we calculated a theoretical transmission time of 12.2ms—almost exactly matching the observed delay. Relocating the valves closer to the actuators reduced this delay to 3ms and increased production rate by 14%.
Fundamental Wave Velocity Equations
The basic equation for pressure wave propagation speed in a gas is:
c = √(γRT)
Where:
- c = Wave propagation velocity (m/s)
- γ = Specific heat ratio (1.4 for air)
- R = Specific gas constant (287 J/kg·K for air)
- T = Absolute temperature (K)
For air at 20°C (293K), this gives:
c = √(1.4 × 287 × 293) = 343 m/s
Modified Wave Velocity in Pneumatic Lines
In real pneumatic systems, the effective wave velocity is modified by pipe elasticity and other factors according to the formula:
c_eff = c / √(1 + (Dψ/Eh))
Where:
- c_eff = Effective wave velocity (m/s)
- D = Pipe diameter (m)
- ψ = Gas compressibility factor
- E = Pipe material elastic modulus (Pa)
- h = Pipe wall thickness (m)
Temperature and Pressure Effects on Wave Velocity
Wave velocity varies with operating conditions:
| Temperature | Pressure | Wave Velocity in Air | Practical Implication |
|---|---|---|---|
| 0°C (273K) | 1 bar | 331 m/s | Slower response in cold environments |
| 20°C (293K) | 1 bar | 343 m/s | Standard reference condition |
| 40°C (313K) | 1 bar | 355 m/s | Faster response in warm environments |
| 20°C (293K) | 6 bar | 343 m/s* | Pressure has minimal direct effect on velocity |
*Note: While the basic wave velocity is independent of pressure, the effective velocity in real systems can be affected by pressure-induced changes in pipe elasticity and gas behavior.
Practical Wave Propagation Time Calculation
For a pneumatic system with:
- Line length (L): 5 meters
- Operating temperature: 20°C (c = 343 m/s)
- Pipe material: Polyurethane tubing (modifies velocity by approximately 5%)
The effective wave velocity would be:
c_eff = 343 × 0.95 = 326 m/s
And the wave propagation time would be:
t = L/c_eff = 5/326 = 0.0153 seconds (15.3 milliseconds)
This represents the minimum time required for a pressure change to travel from one end of the line to the other—a critical factor in high-speed applications.
Wave Velocity Measurement Techniques
Several methods can be used to measure actual wave velocity in pneumatic systems:
Dual Pressure Sensor Method
- Install pressure sensors at known distances apart
- Create a pressure pulse (quick valve opening)
- Measure time delay between pressure rise at each sensor
- Calculate velocity as distance divided by time delay
Resonant Frequency Method
- Create pressure oscillations in a closed tube
- Measure the fundamental resonant frequency (f)
- Calculate velocity using c = 2Lf for a closed-end tube
- Verify with harmonics (odd multiples of fundamental)
Reflection Timing Method
- Install a pressure sensor near a valve
- Create a pressure pulse by quickly opening the valve
- Measure time between initial pulse and reflected pulse
- Calculate velocity as 2L divided by the reflection time
Case Study: Wave Velocity Impact on System Response
For a robotic end-effector with pneumatic grippers:
| Parameter | Original Design (5m lines) | Optimized Design (1m lines) | Improvement |
|---|---|---|---|
| Line Length | 5 meters | 1 meter | 80% reduction |
| Wave Propagation Time | 15.3 ms | 3.1 ms | 12.2 ms faster |
| Pressure Build-up Time | 28 ms | 9 ms | 19 ms faster |
| Grip Force Stability | ±12% variation | ±3% variation | 75% improvement |
| Cycle Time | 1.2 seconds | 0.95 seconds | 21% faster |
| Production Rate | 3000 parts/hour | 3780 parts/hour | 26% increase |
This case study demonstrates how understanding and optimizing wave propagation can significantly impact system performance.
Standing Wave Verification: How Do Resonant Frequencies Create Performance Problems?
Standing waves occur when pressure waves reflect and interfere with themselves, creating fixed patterns of pressure nodes and antinodes. These resonant phenomena can cause severe performance issues in pneumatic systems if not properly understood and managed.
Standing waves in pneumatic systems occur when pressure waves reflect at boundaries and interfere constructively, creating resonant frequencies where pressure fluctuations are amplified. These resonances follow the formula f = nc/2L for closed tubes, where n is the harmonic number, c is the wave velocity, and L is the tube length. Experimental verification through pressure sensors, accelerometers, and acoustic measurements confirms these theoretical predictions and guides effective mitigation strategies.
During a recent project with a medical device manufacturer in Massachusetts, their precision pneumatic positioning system was exhibiting mysterious force fluctuations at specific operating frequencies. By conducting standing wave verification tests, we identified that their 2.1-meter supply line had a fundamental resonance at 81 Hz—precisely matching their actuator cycling frequency. This resonance was amplifying pressure fluctuations by 320%. By adjusting the line length to 1.8 meters, we shifted the resonant frequency away from their operating range and completely eliminated the issue, improving positioning accuracy from ±0.8mm to ±0.15mm.
Standing Wave Fundamentals
Standing waves form when incident and reflected waves interfere, creating fixed patterns of pressure nodes (minimum fluctuation) and antinodes (maximum fluctuation).
The resonant frequencies for a pneumatic line depend on the boundary conditions:
For a line with closed ends (most common in pneumatic systems):
f = nc/2L
Where:
- f = Resonant frequency (Hz)
- n = Harmonic number (1, 2, 3, etc.)
- c = Wave velocity (m/s)
- L = Line length (m)
For a line with one open end:
f = (2n-1)c/4L
For a line with both ends open (rare in pneumatics):
f = nc/2L
Experimental Verification Methods
Several techniques can verify standing wave patterns in pneumatic systems:
Multiple Pressure Sensor Array
- Install pressure transducers at regular intervals along the pneumatic line
- Excite the system with a frequency sweep or impulse
- Record pressure fluctuations at each location
- Map the pressure amplitude vs. position to identify nodes and antinodes
- Compare measured frequencies with theoretical predictions
Acoustic Correlation
- Use acoustic sensors (microphones) to detect sound from pressure fluctuations
- Correlate sound intensity with operating frequency
- Identify peaks in sound intensity corresponding to resonant frequencies
- Verify that peaks occur at predicted frequencies
Accelerometer Measurements
- Mount accelerometers on pneumatic lines and components
- Measure vibration amplitude across frequency range
- Identify resonant peaks in vibration spectrum
- Correlate with predicted standing wave frequencies
Practical Standing Wave Frequency Calculation
For a typical pneumatic system with:
- Line length (L): 3 meters
- Wave velocity (c): 343 m/s
- Closed ends configuration
The fundamental resonant frequency would be:
f₁ = c/2L = 343/(2×3) = 57.2 Hz
And the harmonics would be:
f₂ = 2f₁ = 114.4 Hz
f₃ = 3f₁ = 171.6 Hz
f₄ = 4f₁ = 228.8 Hz
These frequencies represent potential problem points where pressure fluctuations may be amplified.
Standing Wave Patterns and Their Effects
| Harmonic | Node/Antinode Pattern | System Effects | Critical Components Affected |
|---|---|---|---|
| Fundamental (n=1) | One pressure antinode at center | Large pressure variations mid-line | In-line components, fittings |
| Second (n=2) | Two antinodes, node at center | Pressure variations near ends | Valves, actuators, regulators |
| Third (n=3) | Three antinodes, two nodes | Complex pressure pattern | Multiple system components |
| Fourth (n=4) | Four antinodes, three nodes | High-frequency oscillations | Seals, small components |
Experimental Verification Case Study
For a precision pneumatic positioning system experiencing inconsistent performance:
| Parameter | Theoretical Prediction | Experimental Measurement | Correlation |
|---|---|---|---|
| Fundamental Frequency | 81.2 Hz | 79.8 Hz | 98.3% |
| Second Harmonic | 162.4 Hz | 160.5 Hz | 98.8% |
| Third Harmonic | 243.6 Hz | 240.1 Hz | 98.6% |
| Pressure Amplification | 3:1 at resonance (estimated) | 3.2:1 at resonance (measured) | 93.8% |
| Node Locations | 0, 1.05, 2.1 meters | 0, 1.08, 2.1 meters | 97.2% |
This case study demonstrates the excellent agreement between theoretical predictions and experimental measurements of standing wave phenomena.
Practical Implications of Standing Waves
Standing waves create several significant issues in pneumatic systems:
Pressure Amplification
– Fluctuations can be amplified 3-5× at resonance
– Can exceed component pressure ratings
– Creates force variations in actuatorsComponent Fatigue
– High-frequency pressure cycling accelerates seal wear
– Vibration causes fitting loosening and leakage
– Reduces system lifetime by 30-70% in severe casesControl Instability
– Feedback systems may oscillate at resonant frequencies
– Position and force control becomes unpredictable
– May create self-reinforcing oscillationsEnergy Losses
– Standing waves represent trapped energy
– Can increase energy consumption by 10-30%
– Reduces overall system efficiency
Pulse Attenuation Methods: What Techniques Effectively Dampen Destructive Pressure Oscillations?
Controlling pressure fluctuations is essential for reliable pneumatic system operation. Various attenuation methods can be employed to reduce or eliminate problematic pressure oscillations.
Pressure pulse attenuation in pneumatic systems can be achieved through several methods: volume chambers that absorb energy through gas compression, restrictive elements that create damping through viscous effects, tuned resonators that cancel specific frequencies, and active cancellation systems that generate counter-pulses. Effective attenuation requires matching the method to the specific frequency content and amplitude of the pressure fluctuations.
I recently worked with a packaging equipment manufacturer in Illinois whose high-speed pneumatic system was experiencing severe pressure fluctuations that caused inconsistent sealing forces. Their engineers had tried basic receiver tanks without success. Through detailed pressure pulse analysis, we identified that their system had multiple frequency components requiring different attenuation approaches. By implementing a hybrid solution combining a Helmholtz resonator5 tuned to their dominant 112 Hz oscillation and a series of restriction orifices, we reduced pressure fluctuations by 94% and eliminated the sealing inconsistencies completely.
Fundamental Attenuation Mechanisms
Several physical mechanisms can be used to attenuate pressure pulses:
Volume-Based Attenuation
Works through gas compressibility:
- Provides a compliance element that absorbs pressure energy
- Most effective for low-frequency fluctuations
- Simple implementation with minimal pressure drop
Restriction-Based Attenuation
Works through viscous dissipation:
- Converts pressure energy to heat through friction
- Effective across broad frequency range
- Creates permanent pressure drop
Resonator-Based Attenuation
Works through tuned destructive interference:
- Cancels specific frequency components
- Highly effective for targeted frequencies
- Minimal impact on steady-state flow
Material-Based Attenuation
Works through wall flexibility and damping:
- Absorbs energy through wall deformation
- Provides broadband attenuation
- Can be integrated into existing components
Volume Chamber Design Principles
Volume chambers (receiver tanks) are the most common attenuation devices:
The effectiveness of a volume chamber depends on the ratio of chamber volume to line volume:
Attenuation Ratio = 1 + (Vc/Vl)
Where:
- Vc = Chamber volume
- Vl = Line volume
For frequency-dependent analysis, the transmission ratio is:
TR = 1/√(1 + (ωVc/Zc)²)
Where:
- ω = Angular frequency (2πf)
- Zc = Characteristic impedance of the line
Restrictive Element Attenuation
Orifices, porous materials, and long narrow passages create attenuation through viscous effects:
The pressure drop across a restriction follows:
ΔP = k(ρv²/2)
Where:
- k = Loss coefficient
- ρ = Gas density
- v = Velocity
The attenuation provided increases with:
- Higher flow velocity
- Greater restriction length
- Smaller passage diameter
- More tortuous flow path
Resonator Attenuation Systems
Tuned resonators provide targeted frequency attenuation:
Helmholtz Resonator
A volume chamber with a narrow neck, tuned to a specific frequency:
f = (c/2π)√(A/VL)
Where:
- f = Resonant frequency
- c = Sound speed
- A = Neck cross-sectional area
- V = Chamber volume
- L = Effective neck length
Quarter-Wave Resonator
A tube of specific length open at one end:
f = c/4L
Where:
- L = Tube length
Side-Branch Resonators
Multiple tuned branches for complex frequency content:
- Each branch targets a specific frequency
- Can address multiple harmonics simultaneously
- Minimal impact on main flow path
Active Cancellation Systems
Advanced systems that generate counter-pulses:
Sensing Stage
– Detect incoming pressure waves
– Analyze frequency content and amplitudeProcessing Stage
– Calculate required cancellation signal
– Account for system dynamics and delaysActuation Stage
– Generate counter-pressure waves
– Precisely time for destructive interference
Attenuation Performance Comparison
| Method | Low Frequency (<50 Hz) | Mid Frequency (50-200 Hz) | High Frequency (>200 Hz) | Pressure Drop | Complexity |
|---|---|---|---|---|---|
| Volume Chamber | Excellent (>90%) | Moderate (40-70%) | Poor (<30%) | Very Low | Low |
| Restrictive Orifice | Poor (<30%) | Good (60-80%) | Excellent (>80%) | High | Low |
| Helmholtz Resonator | Poor outside resonance | Excellent at resonance | Poor outside resonance | Low | Medium |
| Quarter-Wave Tube | Poor outside resonance | Excellent at resonance | Poor outside resonance | Low | Medium |
| Multiple Resonators | Moderate (40-60%) | Excellent (>80%) | Good (60-80%) | Low | High |
| Active Cancellation | Excellent (>90%) | Excellent (>90%) | Good (70-85%) | None | Very High |
| Hybrid Systems | Excellent (>90%) | Excellent (>90%) | Excellent (>90%) | Moderate | High |
Practical Attenuation Implementation
For effective pressure pulse attenuation:
Characterize the Fluctuations
– Measure amplitude and frequency content
– Identify dominant frequencies
– Determine if broadband or specific frequencies need attenuationSelect Appropriate Methods
– For low frequencies: Volume chambers
– For specific frequencies: Tuned resonators
– For broadband attenuation: Restrictions or hybrid approaches
– For critical applications: Active cancellationOptimize Placement
– Near sources to prevent propagation
– Near sensitive components to protect them
– At strategic locations to break standing wave patternsVerify Performance
– Measure before/after attenuation
– Confirm across operating conditions
– Ensure no unintended consequences
Case Study: Multi-Method Attenuation in High-Speed Packaging
For a high-speed pneumatic sealing system experiencing pressure fluctuations:
| Parameter | Before Attenuation | After Volume Chamber | After Hybrid Solution | Improvement |
|---|---|---|---|---|
| Low Frequency (<50 Hz) | ±0.8 bar | ±0.12 bar | ±0.05 bar | 94% reduction |
| Mid Frequency (112 Hz) | ±1.2 bar | ±0.85 bar | ±0.07 bar | 94% reduction |
| High Frequency (>200 Hz) | ±0.4 bar | ±0.36 bar | ±0.04 bar | 90% reduction |
| Seal Force Variation | ±28% | ±22% | ±2.5% | 91% improvement |
| Product Rejection Rate | 4.2% | 3.1% | 0.3% | 93% reduction |
| System Efficiency | Baseline | +4% | +12% | 12% improvement |
This case study demonstrates how a targeted, multi-method approach to attenuation can dramatically improve system performance.
Advanced Attenuation Techniques
For particularly challenging applications:
Distributed Attenuation
Using multiple smaller devices rather than one large one:
- Places attenuation closer to both sources and sensitive components
- Breaks up standing wave patterns more effectively
- Provides redundancy and more consistent performance
Frequency-Selective Damping
Targeting specific problematic frequencies:
- Uses multiple resonators tuned to different frequencies
- Preserves desired system response while eliminating problems
- Minimizes impact on overall system performance
Adaptive Systems
Adjusting attenuation based on operating conditions:
- Uses sensors to monitor pressure fluctuations
- Adjusts attenuation parameters automatically
- Optimizes performance across varying conditions
Conclusion
Understanding pressure fluctuation theory—wave propagation velocity, standing wave verification, and pulse attenuation methods—provides the foundation for reliable and efficient pneumatic system design. By applying these principles, you can eliminate mysterious performance problems, extend component life, and improve system efficiency while ensuring consistent operation across all operating conditions.
FAQs About Pressure Fluctuations in Pneumatic Systems
How do pressure fluctuations affect the lifespan of pneumatic components?
Pressure fluctuations significantly reduce component lifespan through several mechanisms: they cause accelerated seal wear by creating micro-motion at sealing surfaces; they induce material fatigue in diaphragms and flexible elements through repeated stress cycles; they promote loosening of threaded connections through vibration; and they create localized stress concentrations at geometric transitions. Systems with severe uncontrolled pressure fluctuations typically experience 40-70% shorter component life compared to properly dampened systems, with seals and diaphragms being particularly vulnerable.
What’s the relationship between line length and pressure response time in pneumatic systems?
Line length directly affects pressure response time following a simple relationship: response time increases linearly with line length at a rate determined by the wave propagation velocity. For air at standard conditions (wave velocity ≈ 343 m/s), each meter of line adds approximately 2.9 milliseconds of transmission delay. However, the actual pressure build-up time is typically 2-5 times longer than the initial wave transmission time due to the need for multiple reflections to equalize pressure. This means a 5-meter line might have a wave transmission time of 14.5ms but a pressure build-up time of 30-70ms.
How can I identify if my pneumatic system is experiencing resonant pressure fluctuations?
Resonant pressure fluctuations typically manifest through several observable symptoms: components vibrate at specific operating frequencies but not others; system performance varies inconsistently with minor changes in operating conditions; there’s audible “singing” or “whistling” from pneumatic lines; pressure gauges show oscillating readings; and actuator performance (speed, force) varies cyclically. To confirm resonance, measure pressure at different points in the system using fast-response transducers (response time <1ms) and look for standing wave patterns where pressure amplitude varies with position along the line.
Do pressure fluctuations affect energy efficiency in pneumatic systems?
Pressure fluctuations significantly impact energy efficiency, typically reducing it by 10-25% through several mechanisms: they increase leakage rates by creating higher peak pressures; they waste energy in cyclical compression and expansion; they cause increased friction in components due to vibration; and they often lead operators to increase supply pressure to compensate for performance issues. Additionally, the turbulence and flow separation created by pressure fluctuations convert useful pressure energy into waste heat. Properly attenuating pressure fluctuations can improve system efficiency by 5-15% with no other changes.
How do temperature changes affect pressure wave behavior in pneumatic systems?
Temperature significantly impacts pressure wave behavior through several mechanisms: it directly affects wave propagation velocity (approximately +0.6 m/s per °C increase); it changes gas density and viscosity, altering damping characteristics; it modifies the elastic properties of pneumatic lines, affecting wave reflection and transmission; and it shifts resonant frequencies (approximately +0.17% per °C). This temperature sensitivity means a system that operates perfectly at 20°C might experience problematic resonances when operating at 40°C, or that attenuation devices tuned for winter conditions might be ineffective during summer.
-
Provides a detailed explanation of the physics behind the speed of sound, how it’s calculated, and the factors that influence it. ↩
-
Offers a foundational understanding of standing wave phenomena, including how they are formed from interference and their key characteristics like nodes and antinodes. ↩
-
Provides evidence and industry studies that verify the typical range of energy losses caused by inefficiencies like pressure fluctuations in pneumatic systems. ↩
-
Explains the components and function of an Air Preparation Unit (FRL), which is essential for maintaining air quality in pneumatic systems. ↩
-
Offers an in-depth explanation of the principles behind a Helmholtz resonator, a critical device for targeted frequency attenuation in acoustic and fluid systems. ↩
