

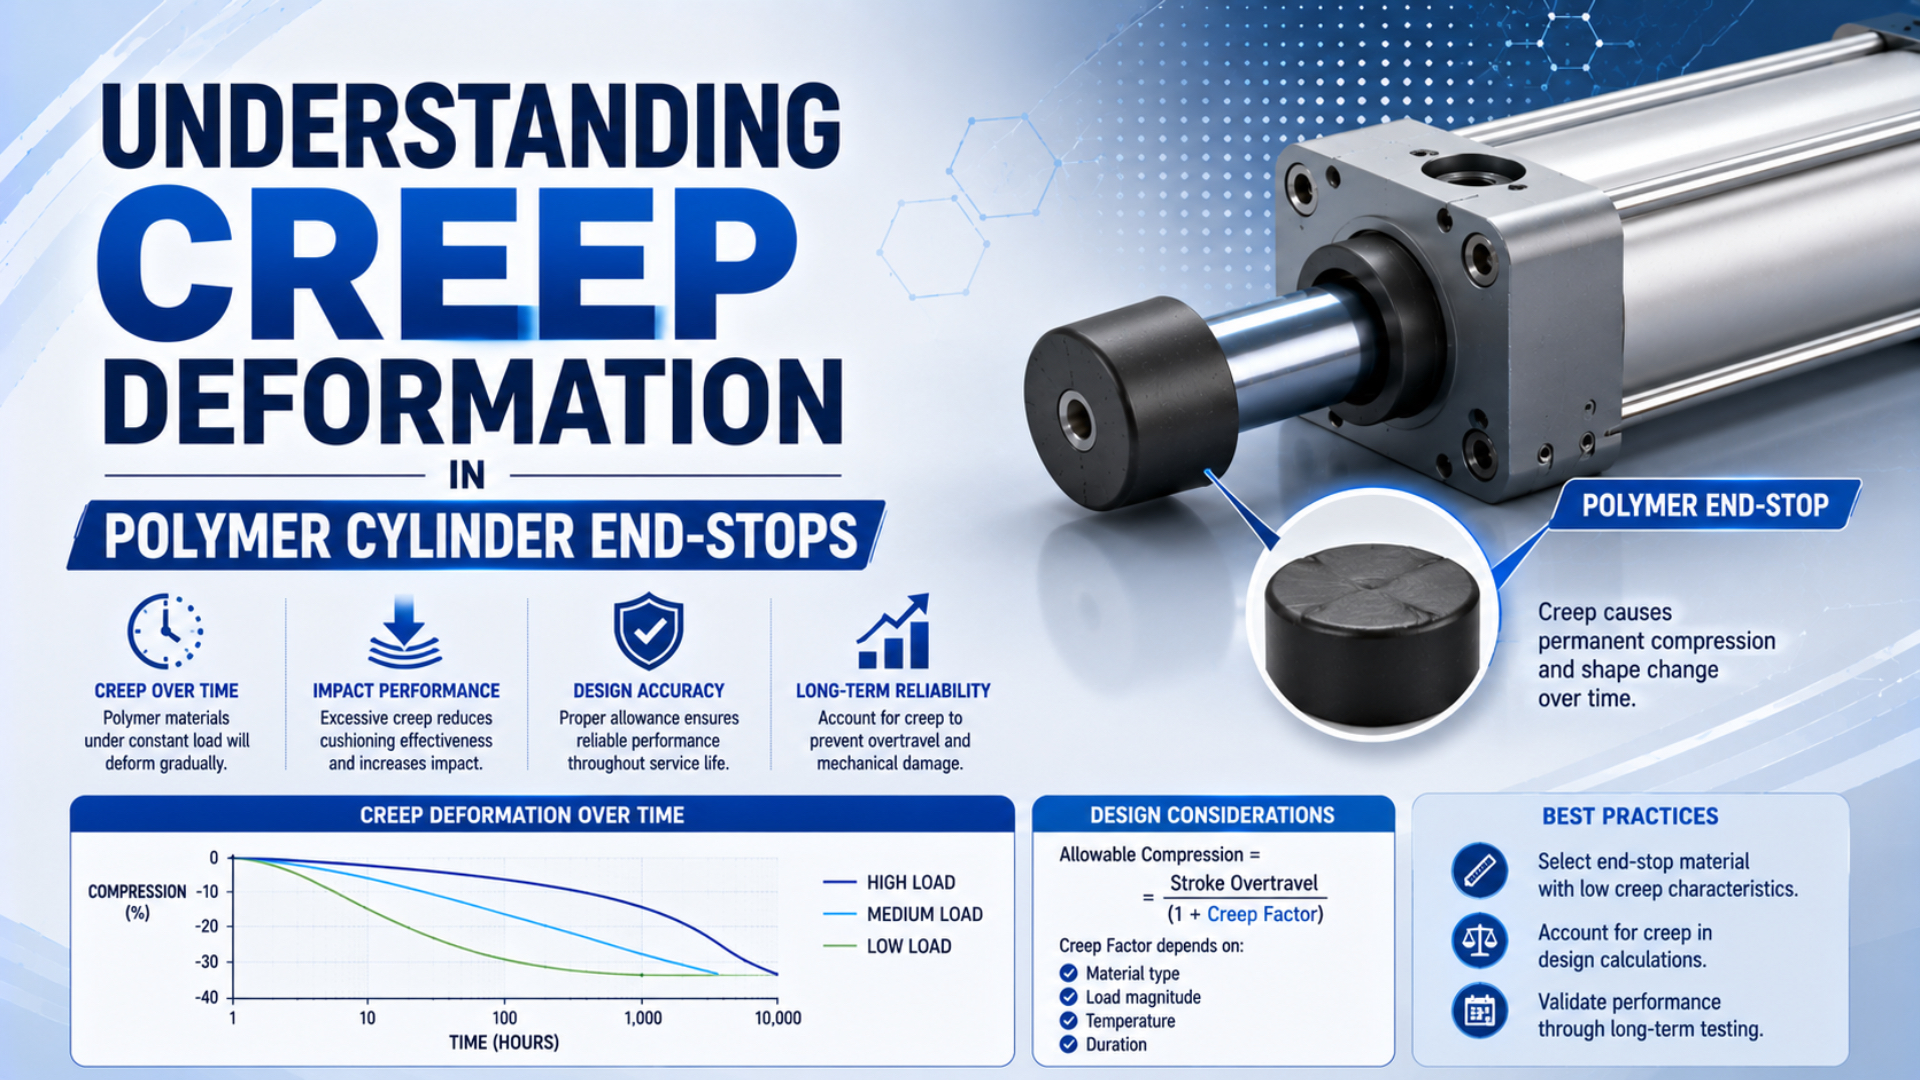
Polymer cylinder end-stops can creep when they carry sustained compressive stress, but repeated impacts alone do not prove creep. A bumper that changes shape may instead show compression set, stress relaxation, fatigue, heat build-up, wear, or a one-time overload. The loading history decides which explanation fits.
That distinction matters because each failure mode leads to a different fix. A harder polymer will not correct excessive kinetic energy. A new cushion setting will not restore a stop that remains compressed for hours. Material selection begins only after the engineer separates the impact event, the held load, and the required position datum.
Key Takeaways
- ASTM D2990 covers tensile, compressive, and flexural creep under specified environments.
- One BASF PA66 grade lists a 3,300 MPa tensile creep modulus at 1,000 hours and 23°C.
- Repeated impact requires fatigue and temperature evidence, not a creep label alone.
- Give end-stop drift its own share of the machine tolerance budget.
Publication information and a route for technical corrections are available through About Us and Contact.
What Is Creep in a Polymer Cylinder End-Stop?
ASTM D2990-17(2025) covers three creep loading modes for plastics: tension, compression, and flexure. Creep deformation is increasing strain with time while a sustained stress remains applied under defined environmental conditions. In a cylinder end-stop, it is not simply any permanent mark found after operation (ASTM International, 2025).
An end-stop normally deforms immediately when load arrives. Some of that strain is elastic and can recover. The time-dependent portion that develops while the load remains applied is the creep response. Stress relaxation is the decrease in counterforce when the component is held at a fixed deflection.
Why is this distinction easy to miss? A pneumatic cylinder may strike its end position, remain pressurized against the stop, and then retract. One cycle therefore contains a brief impact, a sustained dwell, and an unloading period. Examining only the final shape hides which phase caused the change.
In the linear viscoelastic range, creep compliance is the time-dependent strain divided by constant applied stress:
Here, is creep compliance, is elapsed loading time, is temperature, is strain, and is the constant applied stress. The reciprocal quantity, , is the creep modulus. These relationships are useful only when the material data and part loading remain inside the assumptions of the test.
The most useful diagnostic split is not “soft polymer versus hard polymer.” It is sustained load versus fixed deflection versus repeated impact. That split points the engineer toward creep testing, stress-relaxation testing, compression-set testing, or cyclic fatigue testing before a replacement material is chosen.
Which Loads Actually Act on the End-Stop?
ASTM D395-18(2025) defines three compression-set methods and warns that rapidly repeated deformation is better simulated by compression-flexing or hysteresis tests. End-stop analysis must therefore separate the short collision from any pressure-held dwell. A static compression-set result cannot predict the complete response to repeated impacts (ASTM International, 2025).
The collision begins with the kinetic energy of the moving mass:
In this equation, is kinetic energy in joules, is the effective moving mass in kilograms, and is the measured velocity in metres per second at cushion entry or stop contact. Doubling velocity produces four times the kinetic energy. It does not, by itself, reveal the peak contact force or the stop temperature.
Peak force also depends on stopping distance, force-deflection behavior, damping, alignment, contact geometry, and whether the piston continues to do pneumatic work during deceleration. The internal air-cushion energy guide explains why the selected cylinder’s published energy or mass-speed limit must be used. The Cylinder Cushion Energy Calculator is useful for the kinetic term, not for predicting polymer creep.
After motion stops, the held force can create a separate sustained stress:
Here, is nominal average stress, is the force maintained against the stop, and is the effective loaded area. This average does not include local edge stress, misalignment, surface conformity, or transient impact amplification. A pressure-derived cylinder force is therefore a boundary input, not a peak-stress answer.
Does the carriage leave the stop immediately, or does it remain there for ten seconds under pressure? That simple timing question can change the dominant failure mechanism. When impact control is weak, compare elastomer bumpers with adjustable air cushions or review an external shock absorber before specifying a stiffer insert.
How Should Engineers Read Creep Data?
ISO 899-1:2017 states that engineering-design creep data should cover a broad range of stresses, times, and environmental conditions. It also requires control of specimen preparation, dimensions, pretreatment, temperature, humidity, and thermal history. A polymer-family label cannot substitute for those test boundaries (ISO, confirmed 2022).
Start with the exact commercial grade. “Nylon,” “acetal,” “polyurethane,” and “PEEK” each describe material families containing many formulations. Reinforcement content, molecular weight, additives, pigmentation, processing history, fiber orientation, and conditioning can move the result enough to reverse a generic ranking.
The data format matters too. A creep curve plots strain against time at a stated stress. Creep modulus is time-dependent stiffness calculated from applied stress and resulting strain. An isochronous stress-strain plot gives multiple time slices, which helps an engineer read the allowable stress for a chosen strain and service duration.
BASF’s Ultramid B3EG7 data sheet gives a concrete example: the PA66 grade lists a tensile creep modulus of 3,300 MPa at 1,000 hours, 23°C, and strain not exceeding 0.5%, measured to ISO 899-1 (BASF Ultramid B3EG7, accessed 2026). That number describes one grade and one tensile condition. It is not a compressive bumper rating.
BASF’s Ultraform POM brochure takes another useful approach. Its isochronous plots show selected grades at 23°C across time lines from 1 hour to 10,000 hours (BASF Ultraform POM, accessed 2026). That is the kind of time boundary a dimensional-stability decision needs.
Before accepting a material comparison, ask for:
| Required data | What must be stated |
|---|---|
| Material identity | Supplier, exact grade, reinforcement and lot condition |
| Stress mode | Compression, tension, flexure or part-level contact loading |
| Environment | Temperature, humidity, fluid exposure and conditioning |
| Time basis | Test duration, extrapolation method and service target |
| Geometry | Specimen dimensions, molded or machined condition and fiber direction |
| Result | Strain, creep modulus, isochronous curve or rupture criterion |
| Comparison method | Same standard, specimen preparation and environmental boundary |
ASTM D2990 explicitly notes that its results cannot be directly compared with ISO 899 results because the methods differ in technical content. If two supplier curves use different methods, normalize the test plan before declaring one material superior.
Why Do Temperature, Humidity, and Processing Change the Answer?
BASF publishes Ultramid isochronous stress-strain curves at 23°C and 50% relative humidity, and separate dry-state curves at 120°C. Those two stated conditions show why temperature and conditioning belong beside every creep value. There is no universal “creep doubles every 10°C” rule for all polymers (BASF Ultramid, accessed 2026).
Temperature changes molecular mobility and stiffness, but the magnitude depends on the grade and its transition regions. Time-temperature superposition can extend short tests only when the material’s shift factors and applicable range have been established. A generic Arrhenius shortcut is not a release criterion for a cylinder component.
Humidity is especially important for polyamides because conditioning changes their mechanical response and dimensions. Use the supplier’s dry-as-molded and conditioned data that match the installed environment. If the machine experiences washdown, oil mist, cleaning chemicals, or outdoor humidity cycles, include those exposures in the test rather than treating room-temperature dry data as conservative.
Manufacturing can be just as influential. Injection-molded fiber orientation creates directional properties. Weld lines, voids, sharp corners, residual stress, and a thin contact land can dominate a nominally strong formulation. A machined specimen cut from stock may not represent a molded stop with a complex flow path.
Measure the stop itself during a representative duty cycle. Surface temperature, chamber pressure, dwell time, approach velocity, and recovery time provide more useful evidence than ambient temperature alone. The broader cylinder seal temperature guide explains why compound, geometry, lubricant, motion, and exposure duration must be qualified together.
Build a Tolerance Budget Before Choosing the Polymer
Celanese’s Hostaform POM manual notes that 0.5% to 1% strain is usually allowed in its design calculations to provide a safety margin against failure. That supplier guidance is not a universal positioning tolerance. The machine must first assign an allowable dimensional-drift share to the end-stop (Celanese Hostaform POM manual, accessed 2026).
Start with the total permissible position error and subtract the other contributors:
In this budget, is the allowed stop-related drift, is the total machine tolerance, the four terms cover sensor, thermal, structural, and assembly contributions, and is the reserved margin. All values must use the same sign convention and confidence basis.
Consider an illustrative machine with a 0.50 mm total tolerance. If sensor uncertainty uses 0.10 mm, thermal movement 0.12 mm, structure and pneumatic compliance 0.13 mm, assembly variation 0.05 mm, and margin 0.05 mm, only 0.05 mm remains for end-stop drift. That is a design example, not a generic pneumatic-cylinder specification.
What if the subtraction leaves no practical allowance? Do not search for a “zero-creep polymer.” Change the architecture. A stable mechanical datum can define position while an air cushion, elastomer, or external shock absorber handles kinetic energy. Separating those jobs is often more reliable than asking one polymer feature to provide both precision and impact absorption.
End-stop drift should be budgeted at the machine level, not inferred from the cylinder’s nominal repeatability. Sensor switching, trapped-air compliance, guide deflection, mount movement, thermal expansion, and the workpiece interface can all move the observed endpoint without changing the stop thickness.
Material and Architecture Selection
Covestro reports compression-set values of 40% and 36% for two Desmopan TPU grades after 24 hours at 70°C under DIN ISO 815-1 Method A. Even within one TPU family, grade and test condition change the result. Compression set is residual deformation after a defined recovery, not creep (Covestro, accessed 2026).
Choose the material only after defining which function the component performs. Is it a residual bumper that softens a low-energy event, a structural stop that carries a long dwell, or the machine’s final position datum? Those are not interchangeable jobs.
| Candidate architecture | Useful characteristics | Evidence required before release |
|---|---|---|
| Elastomer bumper | Compact energy dissipation and rebound control | Compression set, cyclic heat build-up, fatigue, fluid compatibility and allowed deflection |
| Unreinforced POM or PA stop | Machinability, wear resistance and moderate stiffness | Grade-specific creep data, conditioning, contact stress and impact limit |
| Fiber-reinforced thermoplastic | Higher directional stiffness in a qualified molding | Fiber orientation, weld lines, anisotropy, creep curves and impact behavior |
| High-temperature engineering polymer | Property retention in a specified thermal and chemical window | Exact grade, service temperature, creep and impact data, processing history |
| Metal hard stop with separate cushion | Stable datum and independent energy management | Contact stress, alignment, noise, rebound, cushion capacity and mount strength |
| External shock absorber with hard datum | Controlled deceleration for demanding moving loads | Manufacturer energy, velocity, cycle-rate, temperature and return-force limits |
Glass fiber can improve stiffness and long-term deformation resistance in a particular direction. It can also change impact toughness, wear, surface conformity, and molded-part anisotropy. The polymer-versus-metal end-cap guide shows why damping, stiffness, pressure integrity, and dimensional stability must be evaluated as separate functions.
A softer bumper is not automatically the least precise choice. If a hard datum defines position before the bumper carries sustained load, the bumper’s job may be limited to residual energy control. Conversely, a very stiff polymer can still drift if it is highly stressed near a hot edge or held against the piston throughout a long dwell.
How Should an End-Stop Be Validated and Monitored?
ISO 3384-1:2024 defines two procedures for measuring stress relaxation in compressed rubber, and states that Methods A and B do not give the same result because thermal shrinkage enters Method B. This is a practical warning: fixture, temperature, measurement timing, and recovery protocol must stay fixed (ISO, 2024).
A defensible validation plan follows the installed load history:
- Record the exact material grade, manufacturing route, dimensions, hardness where relevant, fiber direction, conditioning, and lot.
- Measure approach velocity, effective moving mass, cylinder pressure, cushion setting, dwell time, cycle rate, alignment, and contact area.
- Instrument the stop temperature rather than relying on ambient temperature. Stabilize the machine at its worst credible duty.
- Establish unloaded thickness, loaded position, sensor switching point, and machine endpoint before endurance cycling.
- Repeat measurements at planned intervals using the same fixture, load, temperature, and recovery time.
- After unloading, record immediate recovery and delayed recovery. This helps separate elastic recovery from compression set and ongoing damage.
- Inspect witness marks, edge loading, cracking, abrasion, chemical swelling, insert movement, and fastener condition.
- Compare every result with a pre-approved tolerance budget and failure criterion. Do not invent the replacement threshold after drift appears.
In our experience with replacement reviews, a paired measurement is more revealing than a single caliper reading. Record the loaded endpoint after a fixed dwell, then record the stop thickness after a fixed unloaded recovery period. If the endpoint moves but recovered thickness does not, investigate air compliance, sensor switching, mounting, guides, and thermal movement before condemning the polymer.
Condition-based monitoring should use the same variables as qualification. Record cycles and dwell hours, loaded position, recovered thickness, stop temperature, approach velocity, cushion setting, and visible damage. Replace or redesign when a released criterion is reached, not because a generic calendar interval has expired.
For an RFQ or design review, provide:
- Cylinder series, bore, stroke, mounting, orientation, pressure, and cushion type
- Moving mass and measured velocity at cushion entry or stop contact
- Pressure-held force and maximum dwell time against the stop
- Cycle rate, shift pattern, ambient and measured stop temperature
- Required machine tolerance and allocated end-stop drift
- Chemical, oil, humidity, washdown, dust, and UV exposure
- Existing material grade, dimensions, failure evidence, and measurement history
- Required validation duration, sample count, inspection interval, and acceptance criteria
The cylinder cushion failure guide helps separate excess approach energy, needle adjustment, seal leakage, contamination, and mechanical damage. For structural load-path questions, review how end-cap design affects strength and mounting integrity.
Polymer Cylinder End-Stop Creep FAQs
ASTM D2990-17(2025) states that its creep results cannot be directly compared with ISO 899 results because the methods differ technically. The five answers below therefore avoid universal material rankings and fixed service lives. Each decision depends on the exact grade, load mode, temperature, time, geometry, and acceptance criterion (ASTM International, 2025).
Does every polymer cylinder end-stop creep?
Every polymer has time-dependent behavior, but measurable service drift depends on stress, duration, temperature, environment, grade, geometry, and the machine’s tolerance. A stop that is unloaded immediately after impact may be governed more by fatigue, rebound, or heat build-up than by sustained-load creep. Test the installed load history.
Is permanent compression always evidence of creep?
No. Residual deformation can come from compression set, cyclic fatigue, wear, chemical swelling, thermal damage, or a one-time overload. ASTM D395 treats compression set mainly as a static-stress property and points dynamic repeated deformation toward flexing or hysteresis tests. Use loading and recovery records to classify the failure.
Can a 1,000-hour data-sheet value predict several years of service?
Not by itself. A 1,000-hour creep modulus is one point under stated conditions. Long-term use needs a validated curve or extrapolation covering the service stress, temperature, environment, and allowable strain. Confirm that the test method, material conditioning, specimen orientation, and finished-part geometry represent the actual stop.
Should glass-filled polymer always replace an unfilled grade?
No. Reinforcement can raise directional stiffness and reduce deformation in a qualified molding, but fiber orientation, weld lines, moisture, impact toughness, wear, and contact conformity also matter. Compare exact grades under the same method, then test the production geometry. “Glass-filled” alone does not define long-term dimensional stability.
When should a metal stop and separate cushion be used?
Use separate functions when the machine needs a stable position datum but the moving load still requires controlled deceleration. A metal stop can define position while an air cushion, elastomer, or shock absorber manages energy. Verify contact stress, rebound, noise, alignment, cushion capacity, mounting strength, and worst-case approach velocity.
Sources and technical references
- ASTM International. ASTM D2990-17(2025), Standard Test Methods for Tensile, Compressive, and Flexural Creep and Creep-Rupture of Plastics. Active edition 2025. Retrieved July 26, 2026.
- ASTM International. ASTM D395-18(2025), Standard Test Methods for Rubber Property - Compression Set. Active edition 2025. Retrieved July 26, 2026.
- International Organization for Standardization. ISO 899-1:2017, Plastics - Determination of creep behaviour - Part 1: Tensile creep. Confirmed 2022. Retrieved July 26, 2026.
- International Organization for Standardization. ISO 3384-1:2024, Rubber, vulcanized or thermoplastic - Determination of stress relaxation in compression - Part 1. Retrieved July 26, 2026.
- BASF. Ultramid B3EG7 product data sheet. Retrieved July 26, 2026.
- BASF. Ultramid PA product and engineering brochure. Retrieved July 26, 2026.
- BASF. Ultraform POM product and engineering brochure. Retrieved July 26, 2026.
- Celanese. Hostaform POM product manual. Retrieved July 26, 2026.
- Covestro. Mechanical properties of Desmopan and Texin TPU. Retrieved July 26, 2026.