
In my 15 years working with pneumatic systems, I’ve seen countless factories struggling with inefficient pipelines. The pain is real – pressure losses, uneven flow distribution, and structural failures that cost thousands in downtime. Yet most engineers overlook these critical optimization opportunities.
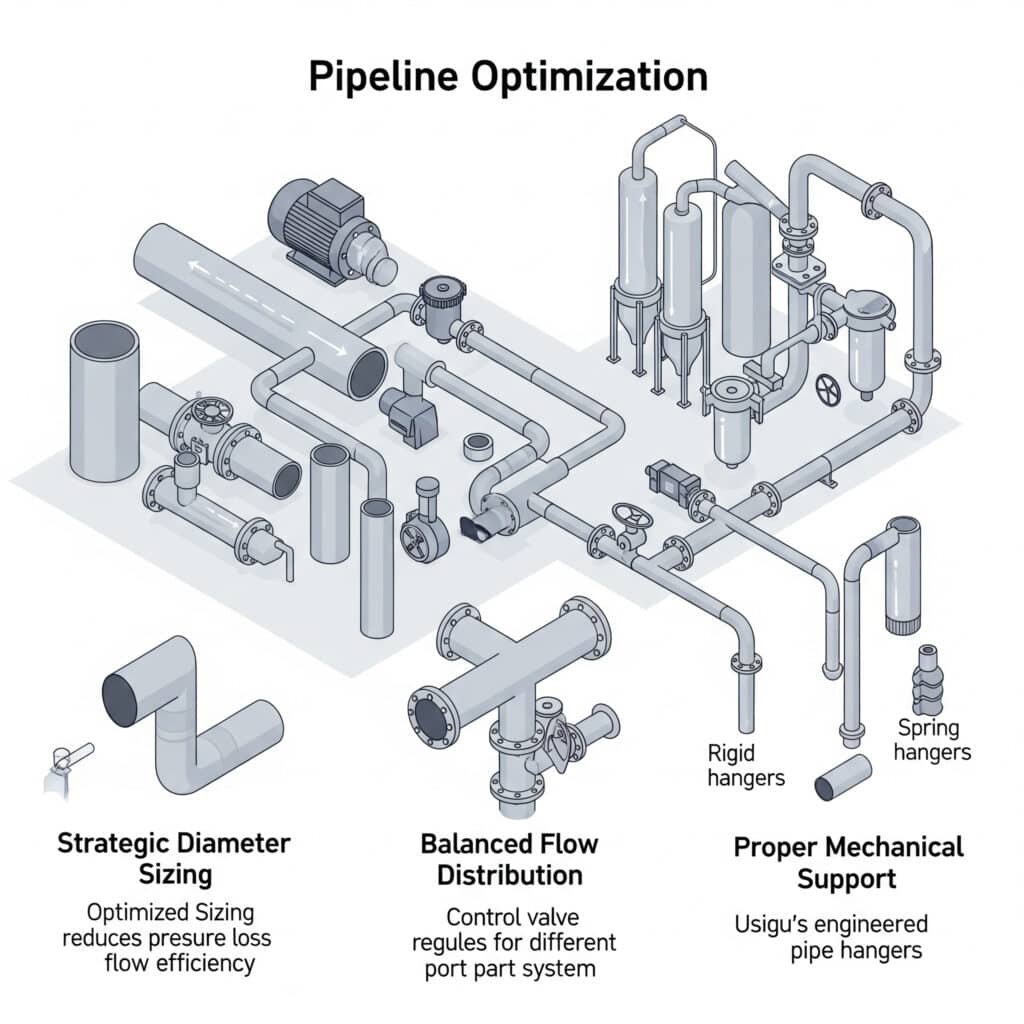
Pipeline optimization involves strategic sizing of pipe diameters, balancing flow distribution in branches, and proper mechanical support placement to maximize system efficiency while minimizing operational costs.
Let me share something that happened last month. A client in Germany was experiencing mysterious pressure drops in their assembly line. After running our optimization protocol, we discovered their pipeline configuration was causing a 23% efficiency loss. Our solution improved their production rate by 18% within days.
Table of Contents
- Dynamic Pressure Loss Tool
- Flow Distribution Simulation
- Clamp Spacing Rules
- Conclusion
- FAQs About Pipeline Optimization
How Does Pipe Diameter Affect Pressure Loss in Real-Time Systems?
When designing pneumatic systems, understanding the relationship between pipe diameter and pressure loss can make or break your efficiency metrics. This dynamic relationship changes based on flow conditions.
Pipe diameter directly influences pressure loss through the inverse fifth-power relationship1 – doubling the diameter reduces pressure loss by approximately 32 times, allowing for significant energy savings in pneumatic systems.

The Mathematics Behind Pressure Loss
The pressure loss in pneumatic systems follows this fundamental equation:
| Variable | Description | Impact on System |
|---|---|---|
| Δp | Pressure loss | Direct impact on system efficiency |
| L | Pipe length | Linear relationship with pressure loss |
| D | Pipe diameter | Inverse fifth-power relationship |
| Q | Flow rate | Squared relationship with pressure loss |
| ρ | Air density | Linear relationship with pressure loss |
When selecting the optimal pipe diameter, I always recommend using our dynamic calculation tool rather than static charts. Here’s why:
Real-Time Calculation vs. Static Tables
Static sizing tables fail to account for:
- Fluctuating demand patterns
- System pressure variations
- Temperature effects on air density
- Actual fitting and valve pressure drops
Our dynamic pressure loss tool integrates these variables in real-time, allowing you to see how your system performs under various operating conditions. I’ve seen this approach reduce energy consumption by up to 15% compared to traditional sizing methods.
Case Study: Manufacturing Plant Optimization
A manufacturing facility in Michigan was experiencing pressure fluctuations that caused inconsistent product quality. Using our dynamic pressure loss tool, we identified that their 1-inch main line was creating excessive pressure drop during peak demand. Upgrading to a 1.5-inch line resolved the issue completely while reducing compressor load by 12%.
How Can You Balance Flow in Complex Branch Systems?
Uneven flow distribution in branched pipeline systems creates a cascade of problems – from inconsistent machine performance to premature component failure. The challenge lies in predicting how flow will naturally distribute.
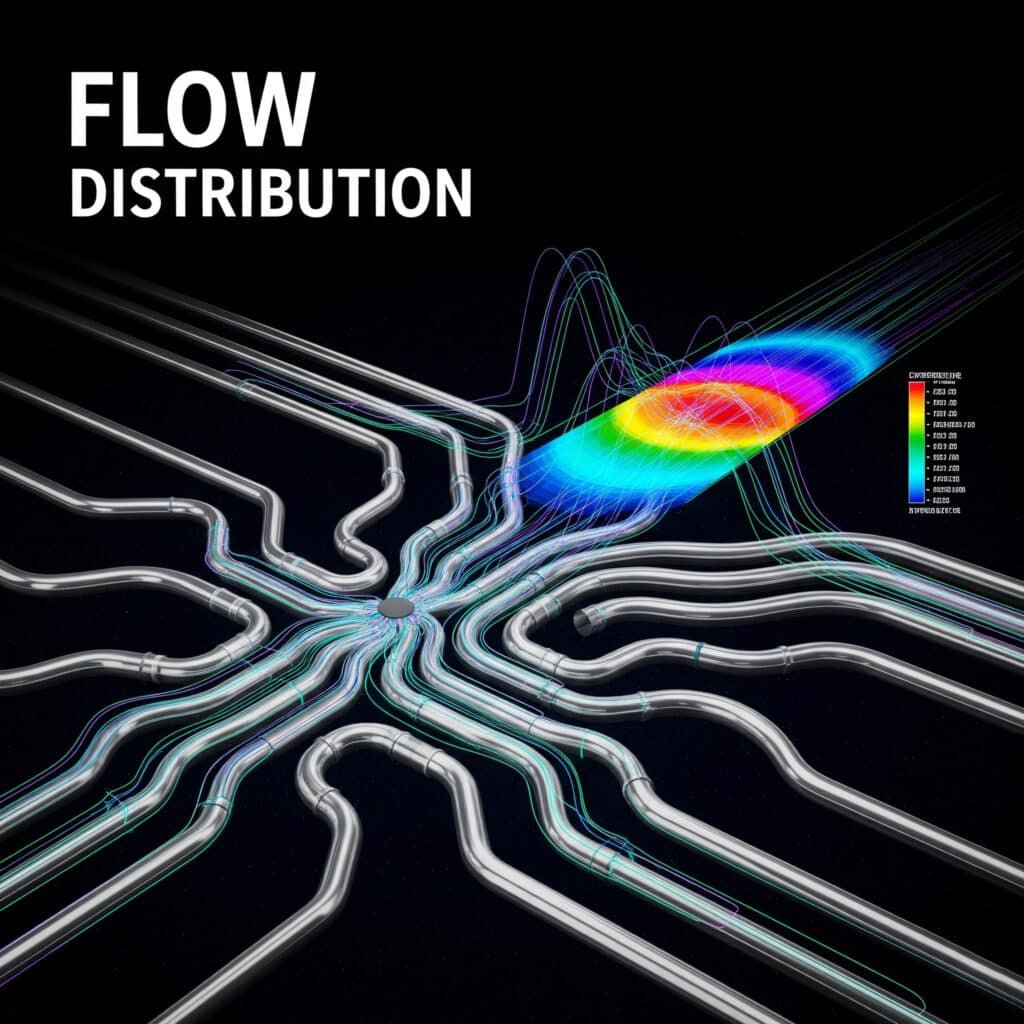
Flow distribution in branched systems depends on pressure differential across each path, with flow taking the path of least resistance. Simulation tools can predict this behavior and allow for strategic balancing through proper component sizing and placement.
Factors Affecting Flow Distribution
When designing branched systems, these factors determine your flow balance:
Geometric Factors
- Branch diameter ratios
- Branch angles
- Distance from source
System Factors
- Operating pressure
- Component restrictions
- Back-pressure conditions
I remember working with a packaging equipment manufacturer who couldn’t understand why identical machines on different branches performed differently. Our flow distribution simulation revealed a 22% flow imbalance due to the branch configuration. After implementing our recommended changes, they achieved performance consistency across all machines.
Simulation Techniques for Flow Prediction
Modern flow distribution simulation tools use these methods:
| Technique | Best For | Limitations |
|---|---|---|
| CFD Analysis2 | Detailed flow patterns | Computationally intensive |
| Network Analysis3 | System-level balancing | Less detail at component level |
| Empirical Models | Quick estimations | Less accurate for complex systems |
Practical Balancing Methods
Based on simulation results, these are my go-to methods for balancing flow:
- Strategic component sizing – Using different fitting sizes to create intentional restrictions
- Flow regulators – Installing adjustable regulators at critical branches
- Header design – Implementing proper header configurations for even distribution
What Are the Golden Rules for Calculating Optimal Clamp Spacing?
Improper clamp spacing is one of the most overlooked aspects of pipeline design, yet it’s responsible for numerous system failures I’ve investigated over the years.
The optimal clamp spacing depends on pipe material, diameter, weight, temperature fluctuation range, and vibration exposure. For most industrial pneumatic applications, the golden rule is spacing clamps at 6-10 times the pipe diameter, with additional supports near direction changes.

The Science Behind Clamp Spacing
Proper clamp spacing prevents:
- Excessive pipe sagging
- Vibration-induced fatigue4
- Thermal expansion issues5
- Connection point stress
Spacing Calculation Formula
For most rodless pneumatic cylinder applications, I use this formula:
Maximum Spacing (feet) = (Pipe Diameter × Material Factor × Support Factor) ÷ Temperature Factor
Where:
- Material Factor ranges from 0.8-1.2 depending on pipe material
- Support Factor considers mounting surface rigidity (0.7-1.0)
- Temperature Factor accounts for thermal expansion (1.0-1.5)
Special Considerations for Pneumatic Systems
When working with pneumatic systems that include rodless cylinders, additional factors come into play:
Vibration Management
Pneumatic systems often create vibration that can be amplified through improperly supported pipelines. I recommend reducing standard spacing by 20% in high-vibration environments.
Critical Support Points
Always add additional supports:
| Location | Distance from Point |
|---|---|
| Valves | Within 12 inches |
| Direction Changes | Within 18 inches |
| Rodless Cylinders | At both ends |
| Heavy Components | Within 6 inches |
Last year, I consulted for a food processing plant experiencing frequent air leaks. Their maintenance team was frustrated by constantly repairing the same connection points. After implementing our clamp spacing protocol, leak incidents decreased by 78% over six months.
Conclusion
Optimizing your pipeline system requires attention to pipe diameter selection, flow distribution balancing, and proper mechanical support. By using dynamic calculation tools, simulation software, and following proven spacing rules, you can significantly improve system efficiency, reduce operational costs, and extend equipment life.
FAQs About Pipeline Optimization
What is the most common cause of pressure loss in pneumatic pipelines?
The most common cause is undersized pipe diameter, which creates excessive friction and turbulence. Other factors include too many direction changes, improper fitting selection, and internal pipe contamination.
How does pipeline optimization affect energy costs?
Optimized pipelines can reduce energy costs by 10-25% by minimizing pressure loss, which allows compressors to operate at lower pressures while maintaining the same performance at point-of-use.
How often should pipeline systems be re-evaluated for optimization?
Pipeline systems should be re-evaluated whenever production requirements change significantly, at least annually during preventive maintenance, or when experiencing performance issues like pressure fluctuations or flow inconsistencies.
Can existing pipeline systems be optimized without complete replacement?
Yes, existing systems can often be partially optimized by addressing critical bottlenecks, adding strategic bypasses, replacing key sections with larger diameter pipe, or implementing better control strategies without complete replacement.
What’s the difference between series and parallel pipeline configurations?
Series configurations connect components sequentially along a single path, while parallel configurations divide flow into multiple paths. Parallel systems offer better redundancy and flow capacity but require more careful balancing.
How does a rodless pneumatic cylinder impact pipeline design requirements?
Rodless pneumatic cylinders require special attention to air delivery consistency and pressure stability. Pipelines serving these cylinders should be sized for minimal pressure drop and include proper air preparation components to ensure smooth operation.
-
Explains the fluid dynamics principle, derived from the Darcy-Weisbach and Hagen–Poiseuille equations, that shows how pressure loss in a pipe is inversely proportional to the pipe’s diameter raised to the fourth or fifth power, depending on flow conditions. ↩
-
Offers an overview of Computational Fluid Dynamics (CFD), a branch of fluid mechanics that uses numerical analysis and data structures to simulate, visualize, and analyze fluid flow and heat transfer. ↩
-
Describes how Kirchhoff’s circuit laws, originally developed for electrical circuits, can be applied as an analogy to fluid networks to analyze and balance flow rates and pressure drops in complex, branched piping systems. ↩
-
Details the mechanism of material fatigue, a process where a material weakens due to repeated cyclic loading, such as high-frequency vibration, eventually leading to crack formation and failure well below the ultimate tensile strength. ↩
-
Explains the principle of thermal expansion and contraction in piping systems, and how a failure to accommodate this movement can lead to high stress, plastic deformation, and eventual failure of pipes and supports. ↩
