
Are you watching your compressed air costs skyrocket while your sustainability goals remain out of reach? You’re not alone. Industrial facilities typically waste 20-30% of their compressed air through undetected leaks, improper pressure settings, and heat loss—directly impacting your bottom line and environmental footprint.
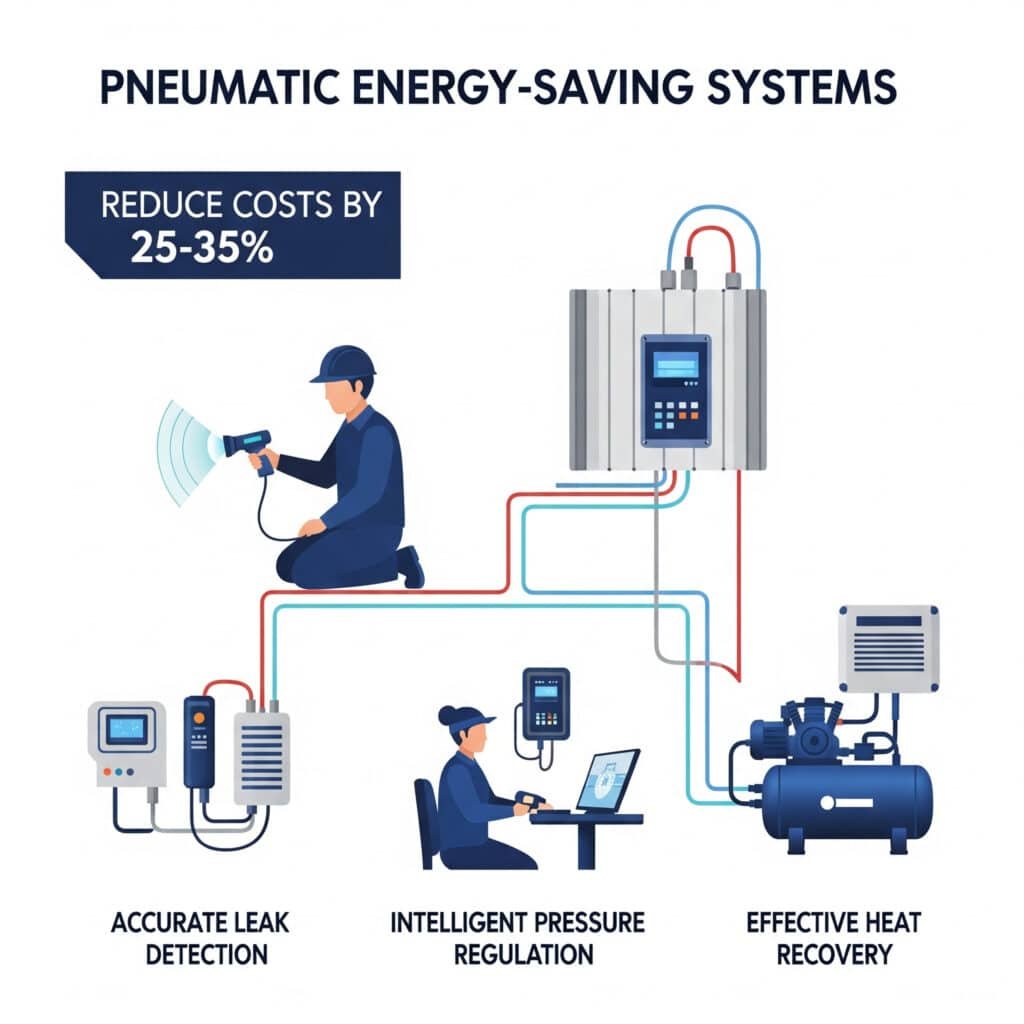
Implementing the right pneumatic energy-saving systems can immediately reduce your compressed air costs by 25-35% through accurate leak detection, intelligent pressure regulation, and effective heat recovery. The key is selecting technologies that match your specific operational requirements and provide measurable return on investment.
I recently consulted with a manufacturing plant in Ohio that was spending $175,000 annually on compressed air energy. After implementing comprehensive leak detection, smart pressure regulation, and heat recovery systems tailored to their operation, they reduced these costs by 31%, saving over $54,000 per year with a payback period of just 9 months. Let me share what I’ve learned over my years in pneumatic efficiency optimization.
Table of Contents
- How to Choose the Most Accurate Air Leakage Detection System
- Smart Pressure Regulation Module Selection Guide
- Waste Heat Recovery Efficiency Comparison and Selection
Which Air Leakage Detection System Delivers the Highest Accuracy for Your Facility?
Selecting the right leak detection technology is critical for identifying and quantifying compressed air losses that silently drain your budget.
Air leakage detection systems vary significantly in accuracy, detection range, and application suitability. The most effective systems combine ultrasonic acoustic sensors1 with flow measurement technologies, achieving detection accuracy within ±2% of actual leakage rates even in noisy industrial environments. Proper selection requires matching detection technology to your facility’s specific noise profile, pipe material, and accessibility constraints.

Comprehensive Air Leakage Detection Technology Comparison
| Detection Technology | Accuracy Range | Minimum Detectable Leak | Noise Immunity | Best Environment | Limitations | Relative Cost |
|---|---|---|---|---|---|---|
| Basic Ultrasonic | ±10-15% | 3-5 CFM | Poor-Moderate | Quiet areas, accessible pipes | Highly affected by background noise | $ |
| Advanced Ultrasonic | ±5-8% | 1-2 CFM | Good | General industrial | Requires skilled operator | $$ |
| Mass Flow Differential | ±3-5% | 0.5-1 CFM | Excellent | Any environment | Requires system shutdown for installation | $$$ |
| Thermal Imaging | ±8-12% | 2-3 CFM | Excellent | Any environment | Only works with significant pressure differentials | $$ |
| Combined Ultrasonic/Flow | ±2-4% | 0.3-0.5 CFM | Very Good | Any environment | Complex setup | $$$$ |
| AI-Enhanced Acoustic | ±3-6% | 0.5-1 CFM | Excellent | High-noise environments | Requires initial training period | $$$$ |
| Bepto LeakTracker Pro | ±1.5-3% | 0.2-0.3 CFM | Outstanding | Any industrial environment | Premium pricing | $$$$$ |
Detection Accuracy Factors and Testing Methodology
The accuracy of leak detection systems is influenced by several key factors:
Environmental Factors Affecting Accuracy
- Background noise: Industrial machinery can mask ultrasonic signatures
- Pipe material: Different materials transmit acoustic signals differently
- System pressure: Higher pressures create more distinct acoustic signatures
- Leak location: Concealed or insulated leaks are harder to detect
- Ambient conditions: Temperature and humidity affect some detection methods
Standardized Accuracy Testing Methodology
To objectively compare leak detection systems, follow this standardized testing protocol:
Controlled leak creation
– Install calibrated orifices of known sizes
– Verify actual leakage rate using calibrated flow meter
– Create leaks of various sizes (0.5, 1, 3, and 5 CFM)
– Position leaks in accessible and partially obscured locationsDetection testing procedure
– Test each device following manufacturer’s recommended procedure
– Maintain consistent distance and approach angle
– Record detected leak rate and location accuracy
– Test under various background noise conditions
– Repeat measurements minimum 5 times per leakAccuracy calculation
– Calculate percentage deviation from known leak rate
– Determine detection probability (successful detections/attempts)
– Assess location accuracy (distance from actual leak)
– Evaluate consistency across multiple measurements
Leak Size Distribution and Detection Requirements
Understanding the typical distribution of leak sizes helps select appropriate detection technology:
| Leak Size | Typical % of Total Leaks | Annual Cost per Leak* | Detection Difficulty | Recommended Technology |
|---|---|---|---|---|
| Micro (<0.5 CFM) | 35-45% | $200-500 | Very High | Combined ultrasonic/flow, AI-enhanced |
| Small (0.5-2 CFM) | 30-40% | $500-2,000 | High | Advanced ultrasonic, mass flow |
| Medium (2-5 CFM) | 15-20% | $2,000-5,000 | Moderate | Basic ultrasonic, thermal imaging |
| Large (>5 CFM) | 5-10% | $5,000-15,000 | Low | Any detection method |
*Based on $0.25/1000 cubic feet electricity cost, 8,760 operating hours
This distribution highlights an important principle: while large leaks are easier to detect, the majority of leakage points are small to micro leaks that require more sophisticated detection technology.
Detection Technology Selection Guide by Facility Type
| Facility Type | Recommended Primary Technology | Supplementary Technology | Special Considerations |
|---|---|---|---|
| Automotive Manufacturing | Advanced Ultrasonic | Mass Flow Differential | High background noise, complex piping |
| Food & Beverage | Combined Ultrasonic/Flow | Thermal Imaging | Sanitary requirements, washdown areas |
| Pharmaceutical | AI-Enhanced Acoustic | Mass Flow Differential | Cleanroom compatibility, validation requirements |
| General Manufacturing | Advanced Ultrasonic | Basic thermal | Cost-effectiveness, ease of use |
| Power Generation | Mass Flow Differential | Advanced Ultrasonic | High-pressure systems, safety requirements |
| Electronics | Combined Ultrasonic/Flow | AI-Enhanced Acoustic | Sensitivity to micro-leaks, clean environments |
| Chemical Processing | AI-Enhanced Acoustic | Thermal Imaging | Hazardous areas, corrosive environments |
ROI Calculation for Leak Detection Systems
To justify investment in advanced leak detection, calculate potential savings:
Estimate current leakage
– Industry average: 20-30% of total compressed air production
– Baseline calculation: Total CFM × 25% = Estimated leakage
– Example: 1,000 CFM system × 25% = 250 CFM leakageCalculate annual leakage cost
– Formula: Leakage CFM × 0.25 kW/CFM × electricity rate × annual hours
– Example: 250 CFM × 0.25 kW/CFM × $0.10/kWh × 8,760 hours = $54,750/yearDetermine potential savings
– Conservative reduction: 30-50% of current leakage
– Example: $54,750 × 40% = $21,900 annual savingsCalculate ROI
– ROI = Annual savings / Detection system investment
– Payback period = Detection system cost / Annual savings
Case Study: Leak Detection System Implementation
I recently worked with a paper manufacturing facility in Georgia that was experiencing excessive compressed air costs despite regular maintenance. Their existing leak detection program used basic ultrasonic detectors during scheduled shutdowns.
Analysis revealed:
- Compressed air system: 3,500 CFM total capacity
- Annual electricity cost: ~$640,000 for compressed air
- Estimated leakage rate: 28% (980 CFM)
- Detection limitations: Missing small leaks, inaccessible areas
By implementing Bepto LeakTracker Pro with:
- Combined ultrasonic/flow technology
- AI-enhanced signal processing
- Continuous monitoring capabilities
- Integration with maintenance management system
The results were significant:
- Identified 347 leaks totaling 785 CFM
- Repaired leaks reducing leakage to 195 CFM (80% reduction)
- Annual savings of $143,500
- ROI period of 4.2 months
- Additional benefits from pressure reduction and compressor optimization
How to Select the Optimal Smart Pressure Regulation Module for Maximum Energy Savings?
Smart pressure regulation represents one of the most cost-effective approaches to pneumatic energy savings, with potential reductions of 10-20% in compressed air consumption.
Smart pressure regulation modules automatically adjust system pressure based on actual demand, process requirements, and efficiency algorithms. Advanced systems incorporate machine learning2 to predict demand patterns and optimize pressure settings in real-time, achieving energy savings of 15-25% compared to fixed-pressure systems while improving process stability and equipment longevity.

Understanding Smart Pressure Regulation Technology
Traditional pressure regulation maintains fixed pressure regardless of demand, while smart regulation dynamically optimizes pressure:
Key Smart Regulation Capabilities
- Demand-based adjustment: Automatically reduces pressure during lower demand
- Process-specific optimization: Maintains different pressures for different processes
- Temporal scheduling: Adjusts pressure based on production schedules
- Adaptive learning: Improves settings based on historical performance
- Predictive adjustment: Anticipates pressure needs based on production patterns
- Remote monitoring/control: Enables centralized management and optimization
Comprehensive Smart Pressure Regulation Module Comparison
| Technology Level | Pressure Accuracy | Response Time | Energy Saving Potential | Control Interface | Connectivity | Machine Learning | Relative Cost |
|---|---|---|---|---|---|---|---|
| Basic Electronic | ±3-5% | 1-2 seconds | 5-10% | Local display | None/minimal | None | $ |
| Advanced Electronic | ±1-3% | 0.5-1 second | 10-15% | Touchscreen | Modbus/Ethernet | Basic trending | $$ |
| Network-Integrated | ±0.5-2% | 0.3-0.5 second | 12-18% | HMI + remote | Multiple protocols | Basic prediction | $$$ |
| AI-Enhanced | ±0.3-1% | 0.1-0.3 second | 15-22% | Advanced HMI + mobile | IoT platform | Advanced learning | $$$$ |
| Bepto SmartPressure | ±0.2-0.5% | 0.05-0.1 second | 18-25% | Multi-platform | Full Industry 4.03 | Deep learning | $$$$$ |
Pressure Regulation Module Selection Factors
Several key factors should guide your selection of smart pressure regulation technology:
System Characteristics Assessment
Air demand profile
– Steady vs. fluctuating demand
– Predictable vs. random variations
– Single vs. multiple pressure requirementsProcess sensitivity
– Required pressure accuracy
– Impact of pressure variations on product quality
– Critical process pressure requirementsSystem configuration
– Centralized vs. distributed regulation
– Single vs. multiple production zones
– Existing infrastructure compatibilityControl integration requirements
– Standalone vs. integrated control
– Required communication protocols
– Data logging and analysis needs
Pressure Regulation Strategies and Energy Savings
Different regulation strategies offer varying levels of energy savings:
| Regulation Strategy | Implementation | Energy Saving Potential | Best Applications | Limitations |
|---|---|---|---|---|
| Fixed Reduction | Reduce overall system pressure | 5-7% per 10 psi reduction | Simple systems, uniform requirements | May affect performance of some equipment |
| Zoned Regulation | Separate high/low pressure zones | 10-15% | Mixed equipment requirements | Requires piping modifications |
| Time-based Scheduling | Program pressure changes by time | 8-12% | Predictable production schedules | Cannot adapt to unexpected changes |
| Demand-based Dynamic | Adjust based on flow measurement | 15-20% | Variable production, multiple lines | Requires flow sensing, more complex |
| Predictive Optimization | AI-based anticipatory adjustment | 18-25% | Complex operations, varying products | Highest complexity, requires data history |
Energy Savings Calculation Methodology
To accurately predict and verify energy savings from smart pressure regulation:
Baseline establishment
– Measure current pressure settings across system
– Record actual pressure at point-of-use
– Document compressed air consumption at baseline pressure
– Calculate energy consumption using compressor performance dataSavings potential calculation
– General rule: 1% energy savings per 2 psi pressure reduction
– Adjusted formula: Savings % = (P₁ – P₂) × 0.5 × U
– P₁ = Original pressure (psig)
– P₂ = Reduced pressure (psig)
– U = Utilization factor (0.6-0.9 based on system type)Verification methodology
– Install temporary flow meters before/after implementation
– Compare energy consumption under similar production conditions
– Normalize for production volume and ambient conditions
– Calculate actual savings percentage
Smart Pressure Module Implementation Strategy
For maximum effectiveness, follow this implementation approach:
System audit and mapping
– Document all end-use pressure requirements
– Identify minimum pressure needs by zone/equipment
– Map pressure drops throughout distribution system
– Identify critical processes and sensitivityPilot implementation
– Select representative area for initial deployment
– Establish clear baseline measurements
– Implement appropriate regulation technology
– Monitor process performance and energy consumptionFull system deployment
– Develop zone-based regulation strategy
– Install appropriate regulation modules
– Configure communication and control systems
– Establish monitoring and verification protocolsContinuous optimization
– Regular review of pressure settings and consumption
– Update algorithms based on production changes
– Integrate with maintenance and leak detection programs
– Calculate ongoing ROI and savings
Case Study: Smart Pressure Regulation Implementation
I recently consulted with an automotive parts supplier in Michigan that was operating their entire compressed air system at 110 psi to accommodate their highest-pressure application, despite most processes requiring only 80-85 psi.
Analysis revealed:
- Compressed air system: 2,200 CFM capacity
- Annual electricity cost: ~$420,000 for compressed air
- Production schedule: 3 shifts, varying products
- Pressure requirements: 75-105 psi depending on process
By implementing Bepto SmartPressure regulation with:
- Zone-based pressure management
- Predictive demand optimization
- Integration with production scheduling
- Real-time monitoring and adjustment
The results were impressive:
- Average system pressure reduced from 110 psi to 87 psi
- Energy consumption reduced by 19.8%
- Annual savings of $83,160
- ROI period of 6.7 months
- Additional benefits: reduced leakage, extended equipment life, improved process stability
Which Waste Heat Recovery System Delivers the Highest Efficiency for Your Compressed Air Installation?
Compressor waste heat recovery represents one of the most overlooked opportunities for energy savings, with potential to recover 70-80% of input energy that would otherwise be wasted.
Waste heat recovery systems capture thermal energy from compressed air systems and repurpose it for space heating, water heating, or process applications. System efficiency varies significantly based on heat exchanger4 design, temperature differentials, and integration approach. Properly selected systems can recover 70-94% of available waste heat while maintaining optimal compressor cooling and reliability.

Understanding Compressor Heat Generation and Recovery Potential
Compressed air systems convert approximately 90% of input electrical energy into heat:
- Heat distribution in typical compressor:
– 72-80% recoverable from oil cooling circuit (oil-injected)
– 13-15% recoverable from aftercooler
– 2-10% recoverable from motor cooling (design dependent)
– 2-5% retained in compressed air
– 1-2% radiated from equipment surfaces
Comprehensive Waste Heat Recovery System Comparison
| Recovery System Type | Recovery Efficiency Range | Temperature Range | Best Applications | Installation Complexity | Relative Cost |
|---|---|---|---|---|---|
| Air-to-Air Heat Exchange | 50-70% | 30-60°C output | Space heating, drying | Low | $ |
| Air-to-Water (Basic) | 60-75% | 40-70°C output | Water pre-heating, washing | Medium | $$ |
| Air-to-Water (Advanced) | 70-85% | 50-80°C output | Process water, heating systems | Medium-High | $$$ |
| Oil Circuit Recovery | 75-90% | 60-90°C output | High-grade heating, processes | High | $$$$ |
| Integrated Multi-Circuit | 80-94% | 40-90°C output | Multiple applications, maximum recovery | Very High | $$$$$ |
| Bepto ThermaReclaim | 85-94% | 40-95°C output | Optimized multi-purpose recovery | High | $$$$$ |
Heat Recovery Efficiency Curves and Performance Factors
The efficiency of heat recovery systems varies based on several factors, as illustrated in these performance curves:
Temperature Differential Impact on Recovery Efficiency

This chart demonstrates:
- Higher temperature differentials between heat source and target fluid increase recovery efficiency
- Efficiency plateaus at differentials above 40-50°C
- Different heat exchanger designs show distinct efficiency curves
Flow Rate Relationship to Heat Recovery

This chart illustrates:
- Optimal flow rates exist for each system design
- Insufficient flow reduces heat transfer efficiency
- Excessive flow may not significantly improve recovery while increasing pumping costs
- Different system designs have different optimal flow ranges
Heat Recovery Potential Calculation Methodology
To accurately estimate heat recovery potential for your system:
Available heat calculation
– Formula: Available heat (kW) = Compressor input power (kW) × 0.9
– Example: 100 kW compressor × 0.9 = 90 kW heat availableRecoverable heat calculation
– Formula: Recoverable heat (kW) = Available heat × Recovery efficiency × Utilization factor
– Example: 90 kW × 0.8 efficiency × 0.9 utilization = 64.8 kW recoverableAnnual energy recovery
– Formula: Annual recovery (kWh) = Recoverable heat × Annual operating hours
– Example: 64.8 kW × 8,000 hours = 518,400 kWh annuallyFinancial savings calculation
– Formula: Annual savings = Annual recovery × Displaced energy cost
– Example: 518,400 kWh × $0.07/kWh = $36,288 annual savings
Heat Recovery System Selection Guide by Application
| Application Need | Recommended System | Target Efficiency | Key Selection Factors | Special Considerations |
|---|---|---|---|---|
| Space Heating | Air-to-Air | 60-70% | Heating area proximity, ducting | Seasonal demand variations |
| Domestic Hot Water | Basic Air-to-Water | 65-75% | Water usage pattern, storage | Legionella prevention5 |
| Process Water (60-80°C) | Advanced Air-to-Water | 75-85% | Process requirements, consistency | Backup heating system |
| Boiler Pre-heating | Oil Circuit Recovery | 80-90% | Boiler size, duty cycle | Integration with controls |
| Multiple Applications | Integrated Multi-Circuit | 85-94% | Priority allocation, control strategy | System complexity |
Heat Recovery System Integration Strategies
For optimal performance, consider these integration approaches:
Cascading temperature utilization
– Use highest temperature recovery for highest grade applications
– Cascade remaining heat to lower temperature applications
– Maximize overall system efficiency through proper heat allocationSeasonal strategy optimization
– Configure for space heating priority in winter
– Shift to process applications in summer
– Implement automatic seasonal transitionControl system integration
– Link heat recovery controls with building management system
– Implement priority-based heat allocation algorithms
– Monitor and optimize based on actual performance dataHybrid system design
– Combine multiple recovery technologies
– Implement supplementary heat sources for peak demands
– Design for redundancy and reliability
Case Study: Waste Heat Recovery Implementation
I recently worked with a food processing facility in Wisconsin that was operating five oil-injected rotary screw compressors totaling 450 kW while simultaneously using natural gas boilers for process water heating.
Analysis revealed:
- Compressed air system: 450 kW total capacity
- Annual operating hours: 8,400
- Process hot water requirements: 75-80°C
- Space heating needs: October-April
- Natural gas cost: $0.65/therm
By implementing Bepto ThermaReclaim heat recovery with:
- Oil-circuit heat exchangers on all compressors
- Aftercooler heat recovery integration
- Dual-purpose distribution system (process/space heating)
- Intelligent control system with seasonal optimization
The results were substantial:
- Heat recovery efficiency: 89% average
- Recovered energy: 3,015,600 kWh annually
- Natural gas savings: 103,000 therms
- Annual cost savings: $66,950
- ROI period: 11 months
- CO₂ emission reduction: 546 tons annually
Comprehensive Energy-Saving System Selection Strategy
To maximize pneumatic system efficiency, implement these technologies in the following strategic order:
Leak detection and repair
– Immediate returns with minimal investment
– Creates foundation for further optimization
– Typical savings: 10-20% of total compressed air energySmart pressure regulation
– Builds on leak reduction benefits
– Relatively simple implementation
– Typical savings: 10-25% of remaining energy useWaste heat recovery
– Leverages existing energy input
– Can offset other energy costs
– Typical recovery: 70-90% of input energy as useful heat
This phased implementation typically yields combined savings of 35-50% of original compressed air system energy costs.
Integrated System ROI Calculation
When implementing multiple energy-saving technologies, calculate combined ROI:
Sequential implementation calculation
– Calculate savings from each technology based on reduced baseline after previous implementations
– Example:
– Original cost: $100,000/year
– Leak detection savings: 20% = $20,000/year
– New baseline: $80,000/year
– Pressure regulation savings: 15% of $80,000 = $12,000/year
– Combined savings: $32,000/year (32%)Investment prioritization
– Rank technologies by ROI period
– Implement highest ROI solutions first
– Use savings to fund subsequent implementations
Case Study: Comprehensive Energy-Saving Implementation
I recently consulted with a pharmaceutical manufacturing facility in New Jersey that implemented a comprehensive pneumatic energy-saving program across their 1,200 kW compressed air system.
Their phased implementation included:
- Phase 1: Advanced leak detection and repair program
- Phase 2: Zone-based smart pressure regulation
- Phase 3: Integrated waste heat recovery system
The combined results were remarkable:
- Leak reduction: 28% energy savings
- Pressure optimization: 17% additional savings
- Heat recovery: 82% of remaining energy recovered as useful heat
- Total cost reduction: 41% of original compressed air costs
- Annual savings: $378,000
- Overall ROI period: 13 months
- Additional benefits: Improved production reliability, reduced maintenance costs, decreased carbon footprint
Conclusion
Implementing comprehensive pneumatic energy-saving systems offers dramatic cost reduction potential through leak detection, smart pressure regulation, and waste heat recovery. By selecting technologies appropriate for your specific facility and implementing them in a strategic sequence, you can achieve 35-50% total energy savings with attractive ROI periods typically under 18 months.
FAQs About Pneumatic Energy-Saving Systems
How do I calculate the true cost of compressed air leaks in my facility?
To calculate compressed air leak costs, first determine the total leakage volume using a compressor load cycle test during non-production hours (leakage CFM = compressor capacity × % load time). Then multiply by power factor (typically 0.25 kW/CFM for older systems, 0.18-0.22 kW/CFM for newer systems), electricity cost, and annual operating hours. For example: 100 CFM leakage × 0.22 kW/CFM × $0.10/kWh × 8,760 hours = $19,272 annual cost. This calculation reveals only direct energy costs—additional impacts include reduced system capacity, increased maintenance, and shorter equipment life.
What accuracy level do I need for air leak detection in a typical manufacturing environment?
In typical manufacturing environments with moderate background noise, leak detection systems with ±5-8% accuracy are generally sufficient for most applications. However, facilities with high energy costs, critical production processes, or sustainability initiatives should consider advanced systems with ±2-4% accuracy. The key factor is detection sensitivity rather than absolute measurement precision—the ability to reliably detect small leaks (0.5-1 CFM) delivers the greatest value, as these represent the majority of leakage points but are easily missed by less sensitive equipment.
How much can I realistically save by implementing smart pressure regulation?
Realistic savings from smart pressure regulation typically range from 10-25% of compressed air energy costs, depending on your current system configuration and production requirements. The general rule is 1% energy savings for every 2 psi pressure reduction. Most facilities operate at unnecessarily high pressures to accommodate worst-case scenarios or specific equipment needs. Smart regulation allows pressure optimization for different zones, processes, and time periods. Facilities with highly variable production, multiple pressure requirements, or significant idle periods typically achieve savings at the higher end of the range.
Is waste heat recovery worth implementing in warmer climates where heating isn’t needed?
Yes, waste heat recovery remains valuable even in warm climates where space heating isn’t required. While space heating applications are common in colder regions, process heating applications are climate-independent. In warm climates, focus on applications like process water heating (washing, cleaning, production processes), boiler feed water preheating, absorption cooling (converting heat to cooling), and drying operations. The ROI may be slightly longer than in facilities with year-round heating needs, but still typically falls within 12-24 months for properly designed systems.
How do I prioritize between leak detection, pressure regulation, and heat recovery investments?
Prioritize your energy-saving investments based on: 1) Implementation cost and complexity—leak detection typically requires least initial investment; 2) Facility-specific savings potential—conduct assessments to determine which technology offers highest savings in your specific operation; 3) Sequential benefits—leak detection improves pressure regulation effectiveness, which optimizes compressor operation for heat recovery; 4) Available resources—consider both capital and implementation capabilities. For most facilities, the optimal sequence is leak detection first, followed by pressure regulation, then heat recovery, as each builds upon the benefits of the previous implementation.
Can these energy-saving systems be retrofitted to older compressed air systems?
Yes, most energy-saving technologies can be successfully retrofitted to older compressed air systems, though some adaptations may be necessary. Leak detection works independently of system age. Smart pressure regulation may require installation of electronic regulators and control systems but rarely requires major piping changes. Waste heat recovery typically requires the most modification, particularly for optimal integration, but even basic heat recovery can be added to most systems. The key consideration for older systems is ensuring proper documentation of existing configuration and careful integration planning. ROI periods are often shorter for older systems due to their typically lower baseline efficiency.
-
Explains the principle of ultrasonic leak detection, where specialized sensors detect the high-frequency sound (ultrasound) produced by turbulent gas flow from a pressurized leak, even in noisy environments. ↩
-
Provides an overview of how machine learning algorithms are used in industrial process control to analyze data, identify patterns, and predict future states to optimize performance, efficiency, and quality in real-time. ↩
-
Describes Industry 4.0, often referred to as the fourth industrial revolution, which encompasses the trend towards automation and data exchange in manufacturing technologies, including cyber-physical systems, the Internet of Things (IoT), and cloud computing. ↩
-
Offers a guide to the different types of heat exchangers (such as shell and tube, plate, and finned tube), which are devices designed to efficiently transfer thermal energy from one medium to another. ↩
-
Provides authoritative public health information, often from sources like the CDC, regarding the prevention of Legionnaires’ disease by managing the growth of Legionella bacteria in building water systems. ↩
