

Pneumatic systems fail when engineers miscalculate flow rates. I’ve seen production lines shut down for days because of undersized air supply systems. Proper flow rate calculations prevent costly downtime and ensure reliable operation.
Pneumatic flow rate calculation involves determining the volume of compressed air needed per unit time, typically measured in SCFM (Standard Cubic Feet per Minute) or liters per minute. Accurate calculations require considering cylinder displacement, cycle frequency, and system pressure requirements.
Two months ago, I helped James, a plant engineer from a Texas manufacturing facility, solve a critical flow rate issue. His rodless pneumatic cylinders1 were operating sluggishly, causing production bottlenecks. The root cause wasn’t cylinder failure – it was inadequate air flow calculations.
Table of Contents
- What is Pneumatic Flow Rate and Why Does It Matter?
- How Do You Calculate Basic Cylinder Flow Requirements?
- What Factors Affect Rodless Cylinder Flow Rate Calculations?
- How Do You Size Air Supply Systems for Multiple Cylinders?
- What Are the Most Common Flow Rate Calculation Mistakes?
- How Do You Account for System Losses in Flow Calculations?
What is Pneumatic Flow Rate and Why Does It Matter?
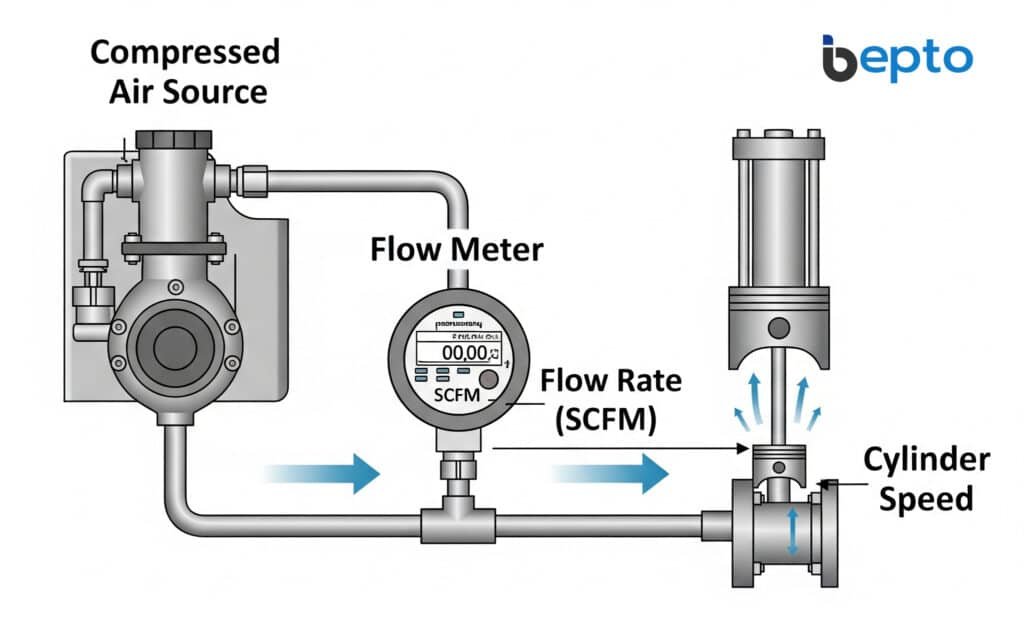
Flow rate represents the volume of compressed air moving through a system per unit time. This measurement determines whether your pneumatic system can deliver required performance.
Pneumatic flow rate measures compressed air consumption in Standard Cubic Feet per Minute (SCFM) or liters per minute. Proper flow rate calculations ensure cylinders operate at designed speeds while maintaining adequate pressure for force requirements.
Understanding Flow Rate Units
Different regions use various units for pneumatic flow measurements:
| Unit | Full Name | Typical Application |
|---|---|---|
| SCFM | Standard Cubic Feet per Minute | North American systems |
| SLPM | Standard Liters per Minute | European/Asian systems |
| Nm³/h | Normal Cubic Meters per Hour | Industrial European systems |
| CFM | Cubic Feet per Minute | Actual flow at operating conditions |
Why Flow Rate Calculations Matter
Insufficient flow rate causes several performance issues:
Speed Reduction
Cylinders move slower than designed when air flow is inadequate. This directly impacts production cycle times and overall equipment effectiveness2.
Pressure Drop
Low flow rates can’t maintain system pressure during high-demand periods. Pressure drops reduce force output and cause inconsistent operation.
System Inefficiency
Oversized flow systems waste energy through excessive compression and distribution losses. Proper calculations optimize energy consumption.
Flow Rate vs. Pressure Relationship
Flow rate and pressure work together in pneumatic systems. Higher flow rates can maintain pressure during rapid cylinder movements, while adequate pressure ensures proper force transmission.
The relationship follows basic fluid dynamics principles. As flow demand increases, pressure tends to decrease unless the supply system compensates accordingly.
Real-World Impact
I recently worked with Maria, a production supervisor at a Spanish automotive parts manufacturer. Her assembly line used multiple rodless air cylinders for part positioning. The system worked fine during single-cycle testing but failed during full production runs.
The issue was flow rate calculation. Engineers sized the air supply for individual cylinder requirements but ignored simultaneous operation demands. When multiple cylinders operated together, total flow demand exceeded supply capacity.
How Do You Calculate Basic Cylinder Flow Requirements?
Basic cylinder flow calculations form the foundation for all pneumatic system sizing. These calculations determine air consumption for individual cylinders.
Basic cylinder flow rate equals cylinder volume multiplied by operating frequency and pressure ratio. The formula is: Flow Rate (SCFM) = Cylinder Volume (in³) × Cycles per Minute × Pressure Ratio ÷ 1728.
Fundamental Flow Rate Formula
The basic equation for pneumatic cylinder flow rate:
Q = V × f × (P₁/P₀) ÷ 1728
Where:
- Q = Flow rate in SCFM
- V = Cylinder volume in cubic inches
- f = Cycle frequency (cycles per minute)
- P₁ = Operating pressure (PSIA) – this is an absolute pressure3
- P₀ = Atmospheric pressure (14.7 PSIA)
- 1728 = Conversion factor (cubic inches to cubic feet)
Cylinder Volume Calculations
For standard pneumatic cylinders:
Volume = π × (Diameter/2)² × Stroke Length
For double-acting cylinders, calculate both extend and retract volumes:
- Extend Volume: Full piston area × stroke
- Retract Volume: (Piston area – rod area) × stroke
Pressure Ratio Considerations
The pressure ratio (P₁/P₀) accounts for air compression. Higher operating pressures require more standard air volume to fill the same cylinder space.
| Operating Pressure (PSIG) | Pressure Ratio | Air Consumption Multiplier |
|---|---|---|
| 60 | 5.08 | 5.08x standard volume |
| 80 | 6.44 | 6.44x standard volume |
| 100 | 7.81 | 7.81x standard volume |
| 120 | 9.17 | 9.17x standard volume |
Practical Calculation Example
For a 2-inch diameter, 12-inch stroke cylinder at 80 PSIG, cycling 30 times per minute:
Cylinder Volume = π × (1)² × 12 = 37.7 in³
Pressure Ratio = (80 + 14.7) ÷ 14.7 = 6.44
Flow Rate = 37.7 × 30 × 6.44 ÷ 1728 = 4.2 SCFM
Double-Acting Cylinder Considerations
Double-acting cylinders consume air on both strokes. Calculate total consumption by adding extend and retract requirements:
Total Flow = Extend Flow + Retract Flow
For cylinders with rods, retract volume is less than extend volume due to rod displacement.
What Factors Affect Rodless Cylinder Flow Rate Calculations?
Rodless cylinders present unique flow calculation challenges compared to traditional pneumatic cylinders. Understanding these differences ensures accurate system sizing.
Rodless cylinder flow calculations must account for internal volume variations, sealing system differences, and coupling mechanism effects. These factors can increase flow requirements by 10-25% compared to equivalent traditional cylinders.

Internal Volume Differences
Rodless pneumatic cylinders have different internal geometries affecting flow calculations:
Magnetic Coupling Systems
Magnetically coupled rodless cylinders maintain consistent internal volumes. The magnetic coupling doesn’t significantly affect air consumption calculations.
Mechanical Sealing Systems
Mechanically sealed rodless cylinders have slot openings that slightly increase internal volume. This additional volume affects flow rate calculations.
Sealing System Impact
Different sealing systems affect flow requirements:
| Sealing Type | Flow Impact | Typical Increase |
|---|---|---|
| Magnetic Coupling | Minimal | 0-5% |
| Mechanical Sealing | Moderate | 5-15% |
| Advanced Sealing | Variable | 10-25% |
Coupling Mechanism Considerations
The coupling mechanism between internal piston and external carriage affects flow dynamics:
Magnetic Coupling Flow Effects
- Consistent Sealing: Maintains predictable flow patterns
- No Direct Connection: Eliminates external leakage paths
- Standard Calculations: Use traditional formulas with minimal adjustments
Mechanical Coupling Flow Effects
- Slot Sealing: Requires additional sealing mechanisms
- Increased Volume: Slot area adds to total cylinder volume
- Leakage Potential: Higher flow requirements for pressure maintenance
Temperature Effects on Flow
Rodless cylinders often operate in applications with temperature variations affecting flow calculations:
Cold Temperature Effects
- Increased Viscosity: Higher flow resistance
- Seal Stiffening: Increased friction and potential leakage
- Condensation: Water accumulation affects flow patterns
Hot Temperature Effects
- Decreased Viscosity: Lower flow resistance
- Thermal Expansion: Changes in internal volumes
- Seal Degradation: Potential for increased leakage
Speed and Acceleration Factors
Rodless cylinders often operate at higher speeds than traditional cylinders, affecting flow requirements:
High-Speed Operation Requirements:
- Rapid Filling: Requires higher instantaneous flow rates
- Pressure Maintenance: Higher flow needed to maintain pressure during rapid movements
- Acceleration Losses: Additional air needed for load acceleration
Calculation Adjustment Factors
For rodless cylinder flow calculations, apply these adjustment factors:
Adjusted Flow Rate = Basic Flow Rate × Adjustment Factor
| Cylinder Type | Adjustment Factor | Application |
|---|---|---|
| Magnetic Coupling | 1.05 | Standard applications |
| Mechanical Sealing | 1.15 | General purpose |
| High-Speed Applications | 1.25 | Rapid cycling |
| High-Temperature | 1.20 | Above 150°F operation |
How Do You Size Air Supply Systems for Multiple Cylinders?
Multiple cylinder systems require careful flow analysis to ensure adequate air supply. Simple addition of individual requirements often leads to oversized or undersized systems.
Multiple cylinder flow sizing requires analyzing simultaneous operation patterns, duty cycles, and peak demand periods. Total system flow rarely equals the sum of individual cylinder requirements due to operational timing differences.
Simultaneous Operation Analysis
Not all cylinders operate simultaneously in most applications. Analyzing actual operation patterns prevents oversizing:
Operation Pattern Types
- Sequential Operation: Cylinders operate one after another
- Simultaneous Operation: Multiple cylinders operate together
- Random Operation: Unpredictable timing patterns
- Cyclic Operation: Repeating patterns with known timing
Duty Cycle Considerations
Duty cycle represents the percentage of time a cylinder operates within a given period:
Duty Cycle = Operating Time ÷ Total Cycle Time × 100%
| Duty Cycle | Flow Calculation Factor | Application Type |
|---|---|---|
| 25% | 0.25 | Intermittent positioning |
| 50% | 0.50 | Regular cycling |
| 75% | 0.75 | High-frequency operation |
| 100% | 1.00 | Continuous operation |
Peak Demand Analysis
System sizing must accommodate peak demand periods when multiple cylinders operate simultaneously:
Peak Demand Calculation
Peak Flow = Σ(Individual Flows × Simultaneous Operation Factor)
Where the simultaneous operation factor represents the probability of cylinders operating together.
Diversity Factor Application
A Diversity Factor4 accounts for the statistical likelihood that not all cylinders will operate at maximum demand simultaneously:
| Number of Cylinders | Diversity Factor | Effective Load |
|---|---|---|
| 2-3 | 0.90 | 90% of total |
| 4-6 | 0.80 | 80% of total |
| 7-10 | 0.70 | 70% of total |
| 10+ | 0.60 | 60% of total |
System Sizing Example
For a system with five rodless cylinders, each requiring 3 SCFM:
Individual Total = 5 × 3 = 15 SCFM
With Diversity Factor = 15 × 0.80 = 12 SCFM
With Safety Factor = 12 × 1.25 = 15 SCFM
Storage Tank Considerations
Air receiver tanks help manage peak demand periods:
Tank Sizing Formula
Tank Volume (gallons) = Peak Flow Rate (SCFM) × Time (minutes) × Pressure Drop (PSI) ÷ 28.8
Where 28.8 is a conversion constant for standard conditions.
Real-World Application
I worked with David, a maintenance manager at a Canadian packaging facility, who struggled with inadequate air supply for his rodless cylinder system. His calculations showed 20 SCFM total requirement, but the system couldn’t maintain pressure during peak production.
The issue was simultaneous operation analysis. During product changeovers, six cylinders operated simultaneously for positioning adjustments. This created 30-second peak demands of 35 SCFM, far exceeding the calculated average.
We solved the problem by adding a 120-gallon receiver tank and upgrading the compressor to handle peak demands. The system now operates reliably during all production phases.
What Are the Most Common Flow Rate Calculation Mistakes?
Flow rate calculation errors cause more pneumatic system failures than any other design mistake. Understanding these common errors prevents costly redesigns and production delays.
Common flow rate mistakes include ignoring pressure losses, miscalculating cycle frequencies, overlooking simultaneous operations, and using incorrect conversion factors. These errors typically result in undersized air supply systems and poor performance.
Pressure Loss Oversights
Many engineers calculate flow rates using supply pressure without accounting for distribution losses:
Common Pressure Loss Sources
- Pipe Friction: 2-5 PSI per 100 feet of distribution
- Valve Restrictions: 3-8 PSI through control valves
- Filter/Regulator: 5-10 PSI pressure drop
- Fittings: 1-2 PSI per connection
Incorrect Cycle Frequency Assumptions
Theoretical cycle times rarely match actual production requirements:
Design vs. Reality Discrepancies
- Design Speed: Maximum theoretical capability
- Actual Speed: Limited by process requirements
- Peak Periods: Higher frequencies during rush production
- Maintenance Cycles: Reduced frequencies during equipment servicing
Simultaneous Operation Errors
Assuming sequential operation when cylinders actually operate simultaneously:
I encountered this mistake with Lisa, a process engineer from a German automotive supplier. Her flow calculations assumed sequential operation of eight rodless cylinders in an assembly station. In reality, quality requirements demanded simultaneous operation for consistent part positioning.
The undersized air supply caused pressure drops during simultaneous operation, leading to inconsistent positioning and quality defects. We recalculated flow requirements for simultaneous operation and upgraded the air supply system.
Conversion Factor Mistakes
Using incorrect conversion factors between different flow rate units:
| Conversion | Correct Factor | Common Mistake |
|---|---|---|
| SCFM to SLPM | × 28.32 | Using 30 or 25 |
| CFM to SCFM | × Pressure Ratio | Ignoring pressure correction |
| GPM to SCFM | × 7.48 × Pressure Ratio | Using water conversion only |
Temperature Correction Oversights
Failing to account for temperature effects on air density and flow:
Standard Conditions
- Temperature: 68°F (20°C)
- Pressure: 14.7 PSIA (1 atmosphere)
- Humidity: 0% relative humidity
Temperature Correction Formula
Corrected Flow = Standard Flow × (Standard Temp ÷ Actual Temp)
Where temperatures are in absolute units (Rankine or Kelvin).
Safety Factor Inadequacy
Insufficient safety factors lead to marginal system performance:
| Application Type | Recommended Safety Factor |
|---|---|
| Laboratory/Light Duty | 1.15 |
| General Industrial | 1.25 |
| Heavy Industrial | 1.50 |
| Critical Applications | 2.00 |
Leakage Allowance Omissions
Failing to account for system leakage in flow calculations:
Typical Leakage Rates
- New Systems: 5-10% of total flow
- Established Systems: 10-20% of total flow
- Older Systems: 20-30% of total flow
- Poor Maintenance: 30%+ of total flow
How Do You Account for System Losses in Flow Calculations?
System losses significantly impact pneumatic flow requirements. Accurate calculations must include all loss sources to ensure adequate system performance.
System losses in pneumatic flow calculations include pipe friction, valve restrictions, fitting losses, and leakage allowances. These losses typically increase total flow requirements by 25-50% above theoretical cylinder consumption.
Pipe Friction Losses
Compressed air distribution systems create friction losses that affect flow calculations:
Friction Loss Factors
- Pipe Diameter: Smaller pipes create higher losses
- Pipe Length: Longer runs increase total friction
- Flow Velocity: Higher velocities exponentially increase losses
- Pipe Material: Smooth pipes reduce friction
Pipe Sizing for Flow Requirements
Proper pipe sizing minimizes friction losses:
| Flow Rate (SCFM) | Recommended Pipe Size | Maximum Velocity (ft/min) |
|---|---|---|
| 0-25 | 1/2 inch | 3000 |
| 25-50 | 3/4 inch | 3500 |
| 50-100 | 1 inch | 4000 |
| 100-200 | 1.5 inch | 4500 |
| 200+ | 2 inch+ | 5000 |
Valve and Component Losses
Control valves and system components create significant pressure drops:
Typical Component Losses
- Ball Valves: 2-5 PSI (fully open)
- Solenoid Valves: 5-15 PSI
- Flow Control Valves: 10-25 PSI
- Quick Disconnects: 1-3 PSI
- Air Filters: 2-8 PSI
Cv Flow Coefficient
Valve flow capacity uses the Cv coefficient:
Flow Rate (SCFM) = Cv × √(ΔP × (P₁ + P₂))
Where:
- Cv = Valve flow coefficient
- ΔP = Pressure drop across valve
- P₁ = Upstream pressure (PSIA)
- P₂ = Downstream pressure (PSIA)
System Leakage Calculations
Leakage represents a significant portion of total air consumption:
Leakage Assessment Methods
- Pressure Decay Testing5: Measure pressure drop over time
- Ultrasonic Detection: Locate individual leak sources
- Flow Monitoring: Compare actual vs. theoretical consumption
- Bubble Testing: Visual detection of leak points
Leakage Allowance Factors
Include leakage allowances in flow calculations:
| System Age | Maintenance Level | Leakage Factor |
|---|---|---|
| New | Excellent | 1.10 |
| 1-3 Years | Good | 1.20 |
| 3-7 Years | Average | 1.35 |
| 7+ Years | Poor | 1.50+ |
Total System Loss Calculation
Combine all loss sources for accurate flow sizing:
Total Required Flow = Cylinder Flow × Pipe Loss Factor × Component Loss Factor × Leakage Factor × Safety Factor
Practical Loss Assessment
I recently helped Roberto, a maintenance engineer from an Italian textile manufacturer, solve chronic air supply issues. His rodless cylinder systems operated inconsistently despite adequate compressor capacity.
We performed a comprehensive loss assessment and discovered:
- Pipe Friction: 15% flow increase needed
- Valve Losses: 20% additional flow required
- System Leakage: 25% consumption increase
- Total Impact: 60% more flow than theoretical calculations
After addressing major leaks and upgrading distribution piping, the system operated reliably with existing compressor capacity.
Loss Minimization Strategies
Reduce system losses through proper design:
Distribution System Optimization
- Loop Systems: Reduce pressure drops through multiple paths
- Proper Sizing: Use adequate pipe diameters
- Minimize Fittings: Reduce connection points
- Quality Components: Use low-loss valves and fittings
Maintenance Programs
- Regular Leak Detection: Monthly ultrasonic surveys
- Preventive Replacement: Replace worn seals and connections
- Pressure Monitoring: Track system performance trends
- Component Upgrades: Replace high-loss components
Conclusion
Accurate pneumatic flow rate calculations require understanding cylinder requirements, system losses, and operational patterns. Proper calculations ensure reliable rodless cylinder performance while optimizing energy consumption and system costs.
FAQs About Pneumatic Flow Rate Calculations
How do you calculate pneumatic cylinder flow rate?
Calculate flow rate using: Flow Rate (SCFM) = Cylinder Volume (in³) × Cycles per Minute × Pressure Ratio ÷ 1728. Include both extend and retract volumes for double-acting cylinders.
What is the difference between SCFM and CFM in pneumatic calculations?
SCFM (Standard Cubic Feet per Minute) measures flow at standard conditions (14.7 PSIA, 68°F), while CFM measures actual flow at operating conditions. SCFM provides consistent comparison values regardless of operating pressure.
How much extra flow should I add for system losses?
Add 25-50% extra flow for system losses including pipe friction, valve restrictions, and leakage. New systems typically need 25% additional flow, while older systems may require 50% or more.
Do rodless cylinders require more air flow than standard cylinders?
Rodless cylinders typically require 5-25% more air flow than equivalent standard cylinders due to sealing system differences and internal volume variations. Magnetic coupling types have minimal increases while mechanical sealing types require more.
How do you calculate flow for multiple cylinders operating simultaneously?
Calculate individual cylinder flows, then apply diversity factors based on actual operation patterns. Use simultaneous operation analysis rather than simple addition of individual requirements to avoid oversizing.
What safety factor should I use for pneumatic flow calculations?
Use 1.25 safety factor for general industrial applications, 1.50 for heavy industrial use, and 2.00 for critical applications. This accounts for variations in operating conditions and future expansion needs.
-
Discover the different types of rodless pneumatic cylinders and their benefits in applications requiring long strokes and compact footprints. ↩
-
Learn about Overall Equipment Effectiveness (OEE), a key metric used to measure manufacturing productivity. ↩
-
Understand the concept of absolute pressure (PSIA) and why it’s critical for accurate gas flow and pneumatic calculations. ↩
-
Explore how diversity factor is used in engineering to estimate the total load of a system where not all components operate simultaneously. ↩
-
Learn the principles and procedure for pressure decay testing, a common method used to quantify air leakage rates in a pneumatic system. ↩
