

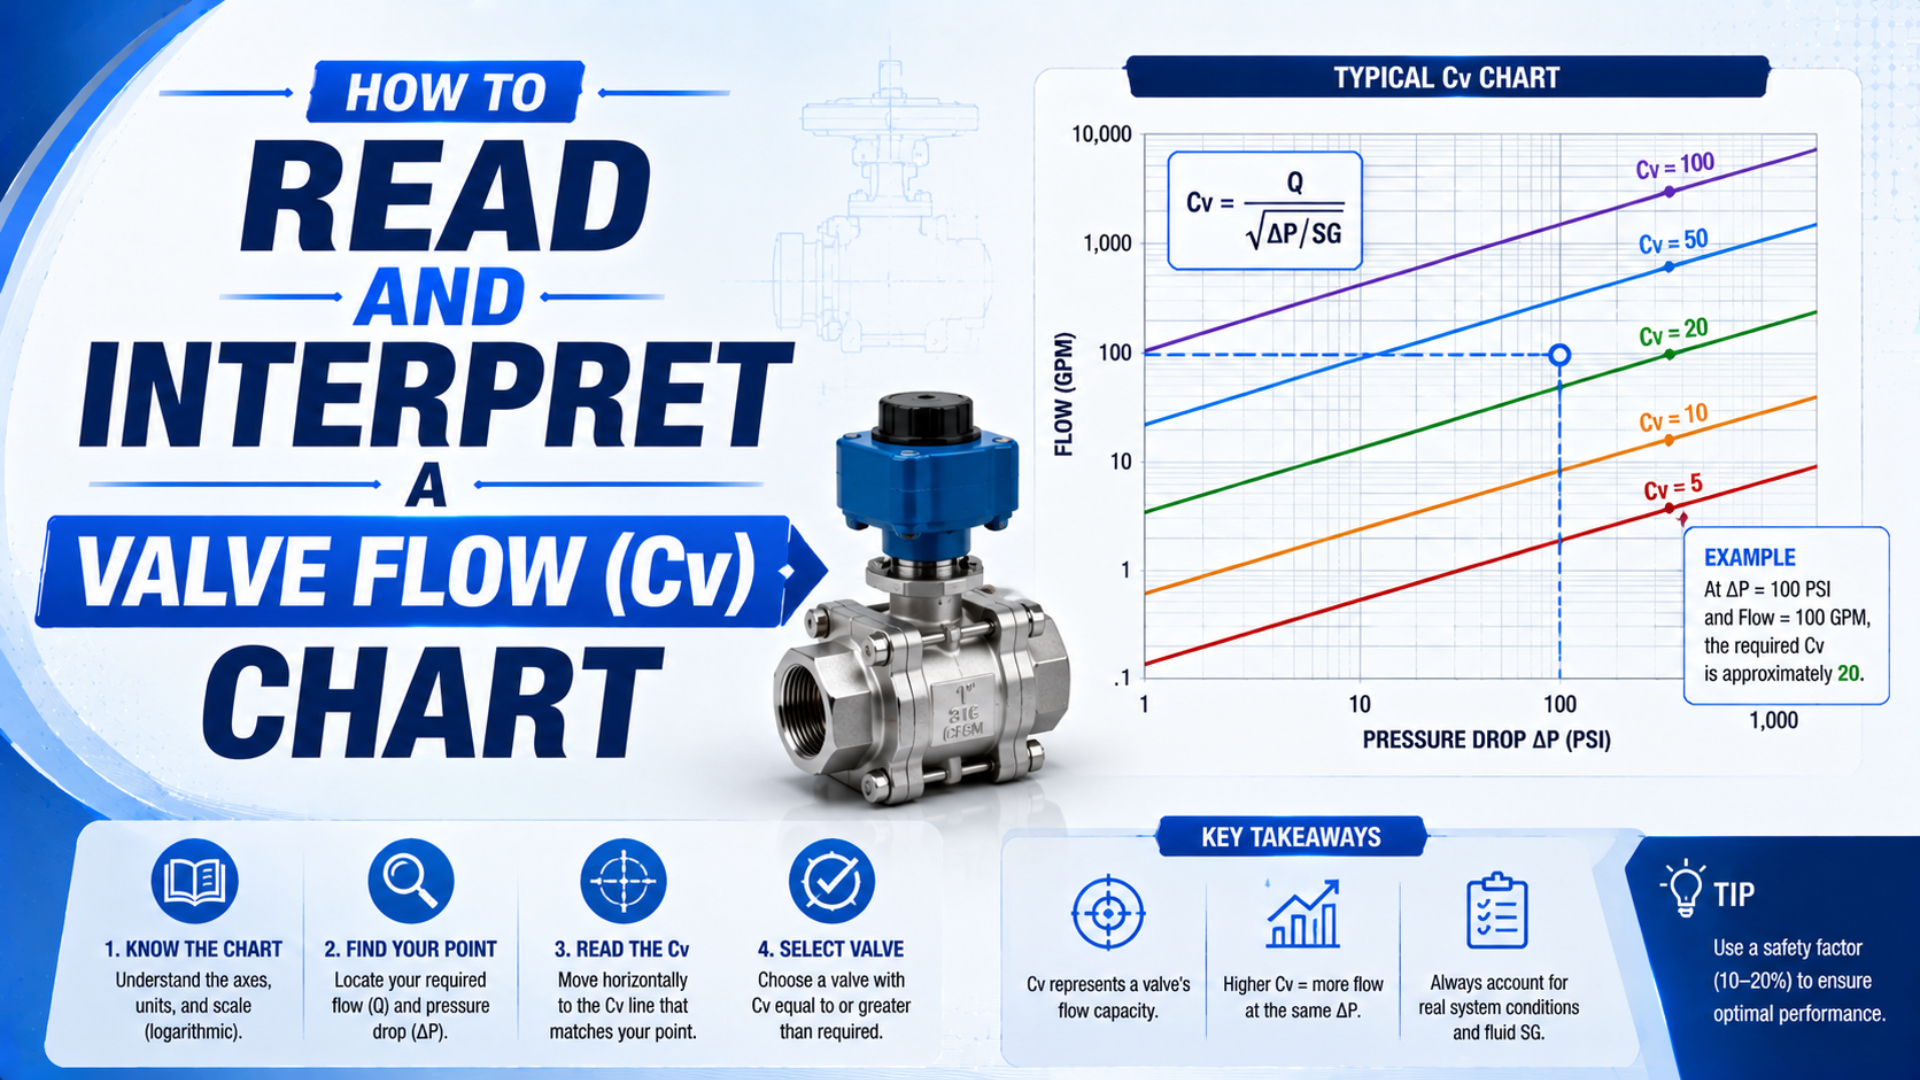
A valve flow (Cv) chart is a manufacturer graph or table that relates a valve’s published flow coefficient to valve position, pressure conditions, model size, or a particular port-to-port path. Read the title, axes, legend, test conditions, and flow path before using any number. The label “Cv chart” alone doesn’t identify the calculation method.
Why does that distinction matter? One catalog may list a single full-open Cv for each model. Another may plot air flow against upstream and downstream pressure. A process-control chart may instead show relative Cv versus valve travel. They answer different questions, even when every page uses the same coefficient symbol.
Key Takeaways
- Cv is based on water at 60°F and a 1 psi pressure drop.
- Parker’s Cv 1.0 air chart reads about 56 SCFM at 100 psig with full pressure drop.
- Check the rated flow path before comparing models.
- Use pneumatic test data for compressed-air prediction.
What Should You Identify Before Reading a Valve Cv Chart?
Start by identifying 1 of 3 chart formats: a full-open coefficient table, a pressure-flow curve, or a valve-travel characteristic. Parker publishes pressure-flow curves for a theoretical Cv 1.0 valve, SMC publishes model tables with Cv, conductance, and critical-pressure data, and Emerson documents travel characteristics (Parker; SMC; Emerson).
Use this classification before reading a curve:
| Data format | Typical axes or columns | What it answers | What it does not answer alone |
|---|---|---|---|
| Full-open Cv table | model, port path, Cv | Which listed path has greater rated capacity? | Air flow at unstated pressure conditions |
| Pressure-flow curve | inlet pressure, outlet pressure or pressure drop, SCFM | What flow corresponds to the chart’s stated conditions? | Cylinder speed through the complete installed circuit |
| Travel characteristic | valve travel or command, relative Cv or flow | How capacity changes as a modulating valve opens | Full-open pneumatic flow without size and pressure data |
Swagelok defines Cv as the US gallons per minute of water at 60°F that pass through a valve with a 1 psi pressure drop (Swagelok). For incompressible liquid under that reference convention:
Here, is liquid flow in US gpm, is the flow coefficient, is pressure drop in psi, and is liquid specific gravity relative to water. This equation explains the coefficient’s definition. It is not a complete compressed-air sizing equation.
Never copy the number without its data lineage.
A traceable chart reading should preserve the catalog revision, valve model, spool or trim option, port-to-port path, valve position, medium, upstream pressure, downstream pressure, temperature, and reference conditions for standard flow. Record whether the value was printed directly, read from a curve, or interpolated. Also keep the chart’s units and any multiplier shown beside the axis. This record matters when another engineer compares a Cv table with an ISO 6358 conductance table or a quoted SCFM value. Without the surrounding fields, the number cannot be reproduced or checked. ISA notes that published flow coefficients can depend on the evaluation method, even for valves with similar flow paths (ISA).
The chart title is not the controlling information. The axis variables and test-condition note determine what the chart means. If those elements are missing, treat the figure as an illustration rather than sizing data.
How Do You Read the Axes, Legend, and Flow Path?
Parker’s manual-valve chart uses Cv 1.0 reference curves and gives about 56 SCFM at 100 psig with full pressure drop. The instructions then require the reader to multiply that chart flow by the Cv for the selected valve type and flow path (Parker Valvair Manual).
A pressure-flow curve is a graph that connects stated upstream and downstream pressure conditions with a corresponding flow under declared reference conditions. It must be read as a coordinate relationship, not as a standalone maximum-flow label.
Read a pressure-flow chart in this order:
- Confirm both axes and their units. The horizontal axis may be downstream pressure, pressure drop, pressure ratio, valve travel, or command signal. The vertical axis may be SCFM, L/min, Cv, or relative capacity.
- Choose the correct curve family. A family labeled 40, 60, 80, and 100 psig usually represents different inlet pressures. Don’t read those labels as valve sizes unless the legend says so.
- Trace one coordinate pair. Start from the known downstream condition, move to the selected upstream-pressure curve, then move to the flow axis. Follow the manufacturer’s stated direction if the chart uses another arrangement.
- Apply any scale factor. Parker’s referenced curve is normalized to Cv 1.0, so the chart reading must be multiplied by the actual path Cv.
- Check the declared standard conditions. Parker states 68°F, 14.7 psia, and 36% relative humidity for that particular air chart. Another catalog may use different reference conditions.
Read the legend before following a line.
Directional-valve tables commonly identify paths with port numbers or letters, such as supply-to-work and work-to-exhaust. Match those symbols to the valve’s circuit diagram in each commanded state. Then copy the coefficient from the exact row, including manifold, seal, or option notes that change the rating. If the table combines several series, don’t assume the nearest number belongs to the selected model. SMC, for example, labels the rated SYJ path as 2→3 (A→R), while other valve families can publish separate values for supply and exhaust routes (SMC SYJ). The path notation is part of the data, not a footnote.
The flow path is part of the rating. Parker explicitly notes that each path through a directional valve can have its own Cv (Parker Engineering Data). Check inlet-to-work-port and work-port-to-exhaust data separately when the catalog provides both.
A single model number can contain several capacity answers. For example, the supply path of a 5-port directional valve may meet the target while one exhaust path remains restrictive. Recording only the largest Cv can hide the path that controls the slower stroke.
Which Curve Shape Are You Looking At?
Emerson documents 3 inherent flow characteristics: linear, equal percentage, and quick opening. A linear characteristic makes flow proportional to travel at constant pressure drop; equal travel increments on an equal-percentage trim produce equal-percentage changes in existing flow. These definitions belong to modulating control behavior (Emerson Control Valve Handbook).
An inherent flow characteristic is the relationship between valve travel and flow measured with a constant pressure drop across the valve. The installed characteristic can change because the rest of the system consumes a varying share of the available pressure drop.
The shapes should rise as the valve opens:
- Linear: equal travel increments produce approximately equal increments of flow capacity under the stated constant-pressure-drop test.
- Equal percentage: equal travel increments produce changes proportional to the flow that existed before the increment, so the curve rises slowly at first and increasingly steeply later as available capacity grows.
- Quick opening: a large share of capacity appears early in the stroke, followed by a flatter upper region.
Curve shape is not a valve category.
Don’t assume every pneumatic directional valve has one of these throttling characteristics. Many solenoid-valve catalogs publish only full-open capacity for discrete spool states. A proportional pneumatic valve may provide a command-versus-flow curve, but its axes, pressure conditions, hysteresis, deadband, and load determine how that curve should be read. Check whether the vertical axis is actual flow, normalized flow, Cv, or percentage of rated flow. Check whether the horizontal axis is mechanical travel, coil current, voltage, or a digital command. A graph measured at one fixed inlet and outlet pressure cannot predict another pressure condition without the manufacturer’s method. Emerson’s inherent characteristics assume constant valve pressure drop, which is why the installed system can produce a different response (Emerson).
“Inherent” and “installed” characteristics are also different. The inherent curve is measured with a defined pressure drop across the valve. In the machine, piping and other restrictions change how total pressure drop is divided as flow changes. Emerson notes that an equal-percentage inherent characteristic can be selected to produce a more nearly linear installed response in suitable systems.
For valve-function context, compare pneumatic flow-control valve types before assigning process-control terminology to an on/off directional valve.
How Do Pneumatic Valve Charts Differ from Liquid Cv Charts?
ISO 6358-1 specifies steady-state testing for pneumatic components carrying compressible fluids, while SMC lists 3 values together for its SYJ valve families: sonic conductance , critical pressure ratio , and Cv. That combination shows why a water-based Cv definition alone is incomplete for compressed-air prediction (ISO 6358-1; SMC SYJ).
The SMC table illustrates how to read related values without treating them as interchangeable:
| Series | Rated path | [dm³/(s·bar)] | Cv | |
|---|---|---|---|---|
| SYJ300 | 2→3 (A→R) | 0.36 | 0.31 | 0.089 |
| SYJ500 | 2→3 (A→R) | 1.2 | 0.48 | 0.34 |
| SYJ700 | 2→3 (A→R) | 2.7 | 0.34 | 0.69 |
Keep the columns together.
These are model- and path-specific catalog values, not universal conversions between , , and . Sonic conductance describes capacity in the choked region under the ISO method, while marks the critical pressure-ratio parameter used to transition between flow regimes. Cv remains a separate coefficient convention. Do not divide or multiply the columns to invent a conversion. Instead, choose one complete method and carry its units, absolute pressures, temperature, and gas conditions through the calculation. ISO 6358-1 defines the steady-state component test framework, and ISO 6358-3 addresses systems made from components and piping with known characteristics (ISO 6358-1; ISO 6358-3). Manufacturer software is preferable when catalog options or manifold configurations change the published data.
Cv and Kv are water-based coefficients expressed in different reference units. Bürkert gives the common catalog conversion on its solenoid-valve guidance page (Bürkert). The Cv/Kv converter can help compare coefficients, but conversion does not turn either coefficient into a complete compressed-air flow prediction.
For the complete sizing workflow, use the pneumatic flow-control valve sizing guide. It begins with actuator demand and then checks the valve, tubing, fittings, and exhaust as one path.
A Worked Cv Chart Reading Example
Parker’s Cv 1.0 reference chart gives approximately 56 SCFM for 100 psig inlet pressure at full pressure drop. The chart is based on 68°F, 14.7 psia, and 36% relative humidity, so the example must retain those declared standard conditions (Parker Valvair Manual).
For example, suppose the selected valve table lists Cv 0.80 for the required port-to-port path. Parker’s method scales the normalized chart reading by that path coefficient:
Using the chart example:
is the flow read from the manufacturer’s Cv 1.0 chart, and is the coefficient for the selected valve path. The result is about 44.8 SCFM under the chart’s stated reference and pressure conditions. It is not a guarantee of installed cylinder flow.
If downstream pressure must remain above zero gauge, don’t use the full-pressure-drop endpoint. Locate the required downstream pressure on the chart, intersect the 100 psig inlet curve, read the lower normalized flow, and then apply Cv 0.80. That preserves the pressure condition the actuator needs.
In our experience reviewing valve applications, the most useful output is not “the valve flows 44.8 SCFM.” We first state that the path is estimated at 44.8 SCFM under the chart’s declared conditions. We then keep that qualification through selection so a reference-condition result doesn’t become an unsupported machine-performance promise.
What Can You Interpolate, and When Must You Stop?
Parker’s subcritical pneumatic equation requires outlet absolute pressure to remain above 0.53 times inlet absolute pressure. Below that boundary, the same relationship cannot simply be extended; use the catalog’s critical-flow region or another stated compressible-flow method (Parker Engineering Data).
Interpolation is reasonable only inside the chart’s published domain. If the required inlet pressure lies between two curves, estimate between them only when the manufacturer presents the curves as a continuous family and no boundary or discontinuity intervenes. Keep the result visibly approximate.
Stop and obtain better data when:
- the operating pressure, temperature, or medium lies outside the chart note;
- the required point is beyond the final axis or below a stated critical pressure ratio;
- the chart doesn’t identify whether flow is standard or actual volume;
- the selected spool path is missing from the coefficient table;
- manifold operation or simultaneous valve use can change the published single-valve rating;
- the figure is a marketing illustration with no units, test conditions, source, declared medium, pressure boundary, reproducible method, model identity, axis definitions, or revision control; request a test curve before using it.
Do not extrapolate a straight line from two convenient points on a curved compressible-flow chart. Likewise, do not infer minimum controllable flow from a full-open Cv table. Minimum stable flow requires control-valve rangeability, actuator resolution, friction, hysteresis, and installed-system information that the table does not contain.
The separate guide to choked flow in pneumatic systems explains why downstream pressure eventually stops changing mass flow in the same way.
What Mistakes Cause the Wrong Valve Choice?
Five checks prevent most chart-reading errors: identify the chart type, preserve its units, select the correct path, stay inside its pressure limits, and separate catalog capacity from installed performance. ISO 6358-3 treats a pneumatic system as connected components with known characteristics, not as one valve coefficient in isolation (ISO 6358-3).
| Mistake | Why it fails | Better check |
|---|---|---|
| Treating port size as capacity | Internal passages differ between designs | Compare Cv or ISO 6358 data for the actual path |
| Using the liquid equation for air | It omits compressibility and critical-flow behavior | Use the manufacturer’s pneumatic method |
| Reading the largest Cv in the table | Another supply or exhaust path may control motion | Trace the active spool state and port pair |
| Confusing valve travel with pressure ratio | Both can appear on a horizontal axis | Read the axis title and units before the curve |
| Adding a fixed safety factor | It hides uncertainty instead of defining it | Check minimum supply, load, timing, and allowed pressure loss |
| Assuming chart flow equals cylinder flow | Tubing, fittings, controls, and silencers add restrictions | Verify dynamic pressure and timed motion after selection |
An oversized on/off valve does not automatically consume more air per completed cylinder cycle at the same final chamber pressures. It can change acceleration, impact, noise, cost, and packaging. An undersized path can produce dynamic pressure loss. Evaluate those consequences directly instead of attaching a universal 20% or 30% multiplier.
Use the valve Cv system-performance guide for dynamic pressure tests, and use the pneumatic flow-rate guide to establish actuator demand before comparing valve capacity.
Valve Cv Chart FAQs
These 5 answers distinguish Cv definition, chart type, pneumatic test data, coefficient conversion, and installed verification. Swagelok defines Cv at 60°F and 1 psi water pressure drop, while ISO 6358-1 specifies steady-state testing for pneumatic components carrying compressible fluids (Swagelok; ISO 6358-1).
What does a higher Cv mean on a valve chart?
A higher Cv indicates greater rated capacity under the coefficient’s reference method. It doesn’t state the installed air flow by itself. Confirm the tested valve path, inlet and outlet pressures, temperature, gas reference conditions, and whether the number is full-open or position-dependent before comparing the expected machine result.
Can I compare Cv values from different manufacturers?
Yes, as a first comparison when both values describe the same medium convention, valve position, and port-to-port path. Then compare each supplier’s test method and pneumatic flow data. Different manifolds, exhaust paths, fittings, reference conditions, or rounding practices can make two similar Cv labels incomplete procurement evidence.
Is a valve-opening chart the same as an air-flow chart?
No. A valve-opening chart normally shows how relative capacity changes with travel or command. An air-flow chart relates flow to pressure conditions, often for a stated Cv. You need valve size, pressure data, and test conditions to turn a relative travel characteristic into a pneumatic flow estimate.
Can I use the liquid Cv equation for compressed air?
Not as a complete air-flow method. The water equation defines and compares Cv, but compressed-air prediction also depends on absolute upstream and downstream pressure, temperature, gas properties, and critical-flow behavior. Use the valve manufacturer’s pneumatic curve, equation, software, or ISO 6358 conductance data instead.
Should I use Cv or ISO 6358 data for a pneumatic valve?
Use the data and calculation method supplied for the exact valve. Cv is useful for catalog comparison, while ISO 6358 conductance and critical-pressure data directly describe compressible-flow testing. Don’t combine a Cv from one path, a critical ratio from another model, and reference conditions from a third catalog.
Engineering Conclusion
Read every Cv chart through 4 questions: what is on each axis, which valve path is rated, what test conditions apply, and where the method stops. Parker’s pressure-flow curves, SMC’s //Cv tables, and Emerson’s travel characteristics demonstrate why no single reading routine fits every chart (Parker; SMC; Emerson).
Start with the chart’s own labels, not with a remembered formula. Preserve the flow direction, select the correct curve, retain all reference conditions, and write the result with its assumptions. If any one of those items is missing, request the manufacturer’s underlying pneumatic flow data.
Finally, separate reading from selection. A chart can estimate the capacity of one valve path. The machine still needs enough dynamic pressure through the FRL, manifold, tubing, fittings, speed controls, actuator ports, and exhaust. Confirm the chosen valve under the minimum supply pressure and maximum production load.