

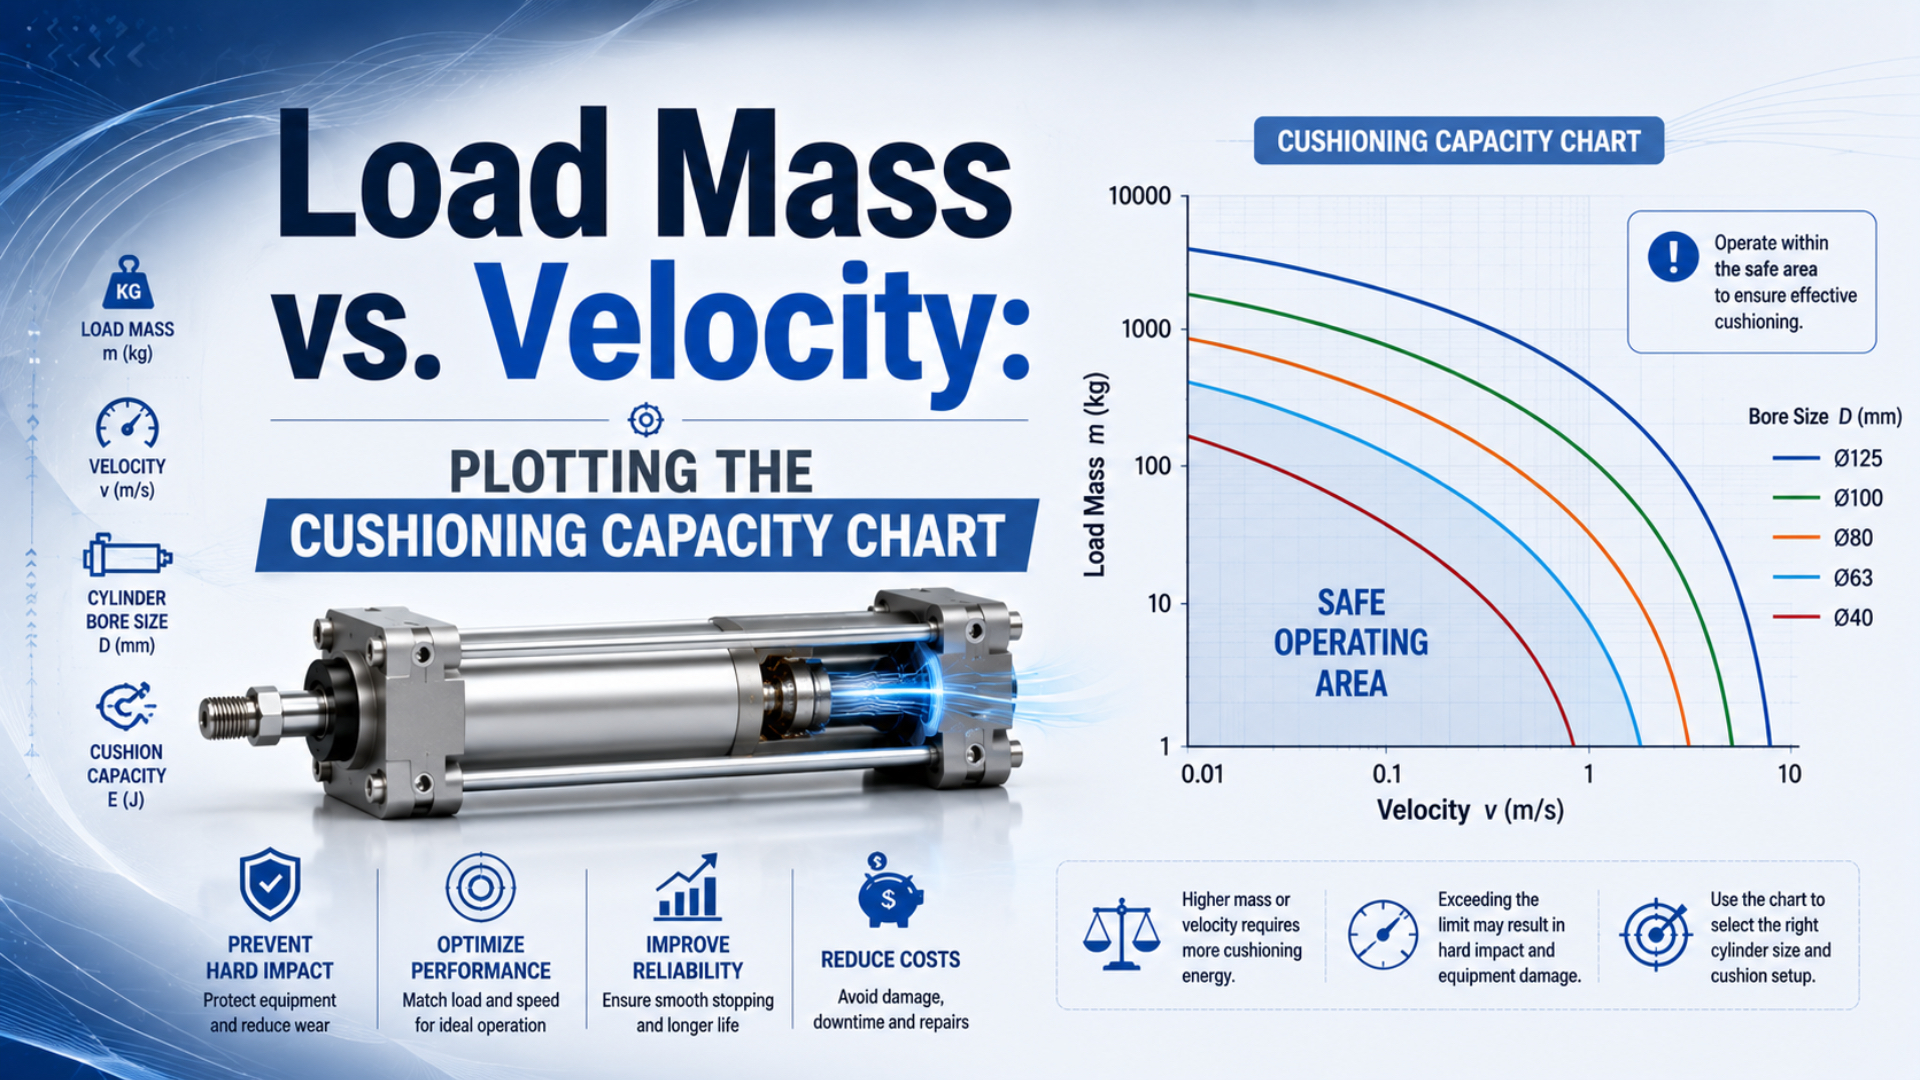
A cushioning capacity chart is a model-specific selection envelope, not a universal safe-zone graph. Choose the chart for the exact cylinder series, bore, guide and cushion configuration. Then plot total moving mass against piston or carriage speed at the start of cushioning, using the axis definitions and test conditions printed in that catalogue.
If the required point lies outside the published boundary, changing the cushion needle does not create extra rated capacity. Reduce speed or moving mass, select a different cylinder or cushioning option, or add a separately sized external decelerator. Final approval still requires controlled commissioning on the installed machine.
Key Takeaways
- Use the exact chart for the cylinder model, bore, cushion option, pressure, mounting orientation, and motion direction.
- Plot total moving mass and speed at cushion entry, not payload alone and not average full-stroke speed.
- Treat the plotted point as a catalogue screen. Verify pressure, cycle rate, adjustment, external forces, mounting, and observed deceleration separately.
What Does a Cushioning Capacity Chart Actually Show?
A cushioning capacity chart shows which combinations of moving mass and cushion-entry speed a particular actuator configuration is rated to decelerate with its stated cushioning system. It does not certify every operating condition inside a generic mass-speed curve.
Parker’s rodless-cylinder catalogue instructs users to select cushioning from the mass to be cushioned and the piston speed at the start of cushioning. It also says to add the piston mass and, where fitted, the mass of the guide carriage or brake housing. If the application is beyond the charted limit, Parker directs the designer to use additional shock absorbers (Parker Rodless Cylinders, retrieved 2026).
SMC’s MY1H selection page illustrates why the product identity matters. Its load-speed curves are separated by bore and stated for horizontal collision at a specified pressure. The permissible air-cushion range is bounded by the relevant model curve, not by a family-wide joule value that can be transferred to another bore or orientation (SMC MY1H, retrieved 2026).
Before plotting anything, record these chart qualifiers:
| Catalogue field | Why it changes the decision |
|---|---|
| Series and exact model | Cushion geometry, moving internal mass, seals, and ratings differ |
| Bore or actuator size | Different sizes usually have different boundary curves |
| Cushion type | Rubber bumpers, fixed air cushions, adjustable air cushions, and shock absorbers are not interchangeable |
| Guide, brake, or carriage option | Added moving hardware changes the mass that must be decelerated |
| Pressure and direction | Drive work and the catalogue test condition may change |
| Mounting orientation | Gravity can assist or oppose motion, and some curves apply only to horizontal travel |
| Speed definition | The chart may specify average speed, maximum speed, collision speed, or speed at cushion entry |
| Stroke or adjustment limitation | Some cushion or stroke-adjuster options have their own usable range |
The chart title is part of the engineering data. A clean-looking curve without a model number, axis units, operating condition, and cushion definition cannot validate a cylinder. It is an illustration, not a rating.
Which Mass and Velocity Belong on the Axes?
Use total translating mass for the mass coordinate and speed at the instant cushioning begins for the velocity coordinate. These values are commonly larger than the payload and average-speed figures on a machine specification sheet.
Total moving mass can include:
- payload and product;
- tooling, grippers, brackets, hoses, and cable carriers that translate with the load;
- external carriage or guided table mass;
- the cylinder piston or internal carriage mass when the catalogue requires it;
- brake housings, couplers, or stroke-adjustment hardware identified by the manufacturer.
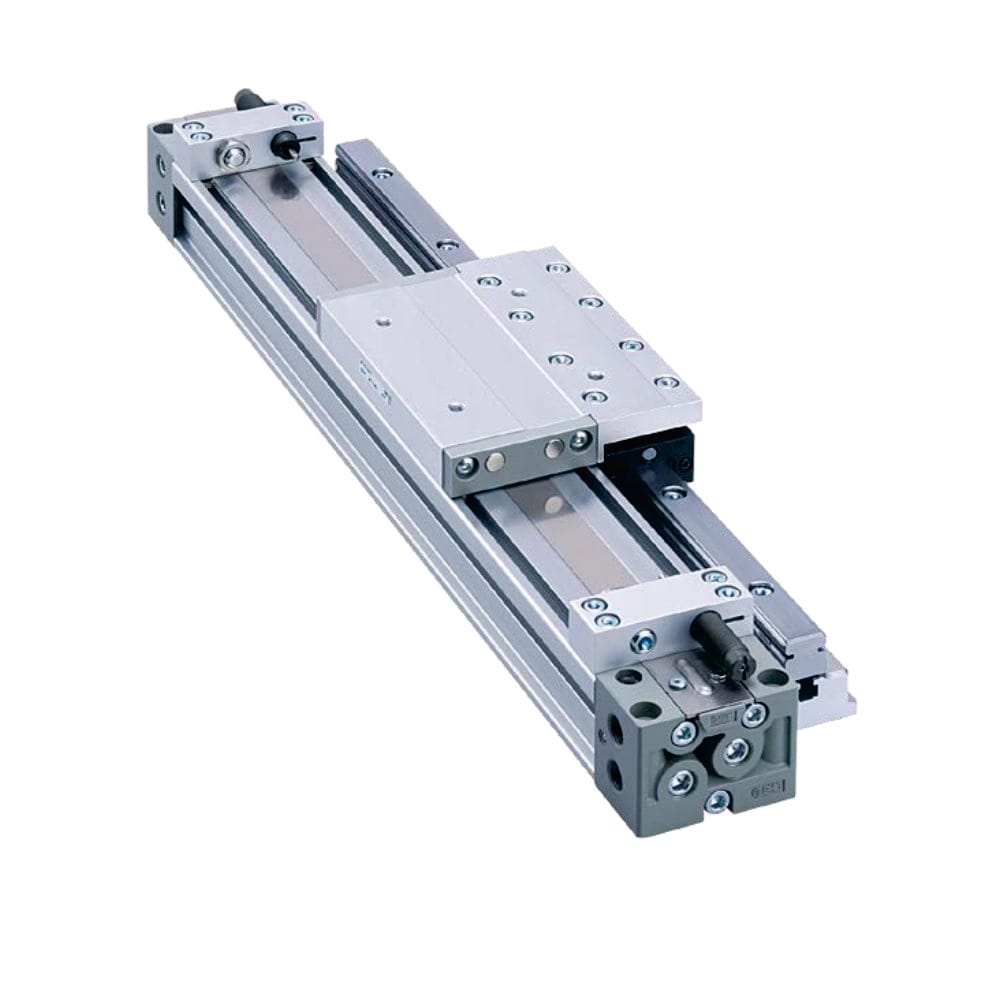
A guided rodless-cylinder photograph can identify moving components, but appearance alone cannot establish cushioning capacity. Count the guided carriage and attached hardware according to the exact catalogue method.
For velocity, measure near the cushion-entry position under the worst credible production condition. A full-stroke average can hide acceleration and flow changes. Parker permits a 50% peak-over-average assumption for initial sizing in one rodless-cylinder procedure, but that factor belongs to that procedure and is not a universal conversion (Parker Rodless Cylinders, retrieved 2026).
Festo likewise treats moving mass, speed at the start of cushioning, desired deceleration, working pressure, and cylinder resistance as separate inputs. This reinforces a practical rule: one mass-speed point is necessary for reading the chart, but it is not the complete stopping-system specification (Festo, retrieved 2026).
If speed is not measured directly, document the estimation method, sensor locations, filter settings, load, supply pressure, and flow-control settings. The pneumatic cylinder velocity guide explains why theoretical flow divided by piston area is only a first estimate.
How Do You Plot the Operating Point Correctly?
Plot the operating point in 6 steps. Preserve the manufacturer’s axis orientation and scale instead of redrawing the curve from memory.
- Choose one exact chart. Match series, size, cushion option, guide option, direction, orientation, and stated pressure.
- Read both axes literally. Confirm units and whether either axis is logarithmic. Do not assume mass is vertical or speed is horizontal.
- Calculate total moving mass. Follow the catalogue instruction for internal piston, carriage, brake, and accessory mass.
- Determine cushion-entry speed. Prefer measured worst-credible speed at the stated position over average cycle speed.
- Plot more than one condition. Mark nominal production, maximum intended load and speed, and a credible upset condition such as regulator drift or load variation.
- Judge against the correct curve. Use the boundary for the selected size or option, then retain the annotated catalogue page in the machine file.
Do not describe every region below and left of a curve as universally “safe.” That wording can imply a validated safety factor where none exists. A point inside the catalogue envelope has passed one selection screen under the chart’s stated assumptions. Other restrictions may still control the design.
Why Does Velocity Move the Point So Quickly?
For translational motion, kinetic energy at cushion entry is:
is kinetic energy in joules, is total moving mass in kilograms, and is speed at cushion entry in metres per second. At constant mass, doubling multiplies kinetic energy by 4. That is why a modest speed increase can move an application beyond a cushioning curve much faster than the same percentage increase in mass.
If a cushioning device had a single constant allowable energy , the idealized mass-speed boundary could be written as:
is the maximum speed implied by that energy-only model. It explains the descending shape of many capacity curves, but it must not be used to reconstruct a manufacturer’s rating. Real curves can include pressure, cushion flow, piston size, seal friction, stroke-adjuster limits, and product-specific test criteria.
The cushion may also need to absorb work added while pressure continues driving the piston through the cushion stroke. Gravity can add or subtract work in vertical or inclined motion. For full stopping-energy treatment, use the moving-load kinetic energy guide and the end-of-stroke force and energy guide.
A mass-speed chart compresses several product assumptions into one boundary. Use the chart to answer “does this operating point qualify for this configuration?” Use an energy calculation to understand why the point moved and to screen alternatives. Neither replaces the other.
What Must You Check Besides the Plotted Point?
After the point passes the model curve, check the conditions that a two-axis plot cannot show:
| Additional check | Failure hidden by a mass-speed point |
|---|---|
| Available cushion stroke | Adjustment hardware or machine geometry may shorten the deceleration distance |
| Working pressure and exhaust back pressure | Drive work and cushion behavior may differ from the catalogue condition |
| Cycle rate and temperature | Repeated deceleration can produce a thermal limit not visible on a per-event chart |
| External process force or gravity | Additional work may enter the stopping system during cushioning |
| Load offset and moments | The carriage or guide can exceed moment capacity even when cushioning passes |
| Alignment and side load | Binding changes velocity, friction, wear, and impact behavior |
| Needle setting | Incorrect restriction can cause rebound, hard entry, or hard set-down |
| Mechanical stop and guarding | Cushioning does not define structural stop or safety-control requirements |
For guided rodless cylinders, review load and moment capacity as well as cushioning. SMC publishes separate speed-dependent load and moment graphs for MY1 configurations, which demonstrates that passing one curve does not satisfy every product limit (SMC MY1 Series, retrieved 2026).
Needle adjustment changes exhaust restriction and the deceleration profile. It cannot turn a point beyond the manufacturer’s capacity boundary into an approved point. The cushion-seal engineering guide explains how the cushion sleeve, trapped air, needle passage, and seal work together.
In our experience reviewing cushioning applications, the most useful chart markup contains 3 points rather than 1: normal production, maximum intended load and speed, and the credible upset condition that creates the highest cushion-entry energy. That simple record makes later pressure or cycle-time changes visible instead of leaving maintenance teams to infer the original selection basis.
What Should You Do When the Point Is Outside the Curve?
An outside point means the selected configuration has failed the catalogue screen. Do not erase the point by substituting payload for total mass, average speed for cushion-entry speed, or a curve from a different bore.
Use one or more of these corrections:
- Reduce cushion-entry speed. Change the motion profile or flow-control strategy, then measure the resulting speed at the same location.
- Reduce translating mass. Lighten tooling or remove moving brackets only when the mechanical design permits it.
- Select another actuator configuration. A different bore, series, guide, cushion option, or stroke-adjuster assembly may have another published envelope.
- Increase controlled stopping distance. Use only a manufacturer-approved cushion or deceleration arrangement.
- Add an external shock absorber. Size it for kinetic energy, continued drive work, hourly energy, velocity, effective mass, stroke, return time, temperature, and mounting limits.
- Rework the load path. Align the decelerator near the load’s centre of mass and keep cylinder or carriage side load within its own limit.
ACE’s industrial shock-absorber method separates kinetic energy, propelling energy, total energy per cycle, total energy per hour, effective mass, and stroke. Use those fields when internal cushioning is insufficient; a joule rating alone is not a complete external-absorber selection (ACE Controls, retrieved 2026). The external shock absorber sizing guide provides the detailed workflow.
How Should the Selection Be Commissioned and Documented?
Commission at controlled load and speed, following the exact actuator manual. Approach the intended production condition gradually, verify cushion engagement from both directions, and look for hard entry, hard set-down, rebound, unstable cycle time, leakage, fastener movement, or abnormal carriage behavior.
Keep a one-page selection record with the catalogue revision, chart page, actuator model, bore, stroke, cushion option, moving-mass breakdown, speed trace or calculation method, pressure range, plotted points, needle setting, cycle rate, mounting orientation, and commissioning observations. Recheck the chart whenever any of those inputs changes.
The high-speed air-cushion guide covers adjustment symptoms and verification in faster applications. If end-of-stroke noise or impact returns after a stable commissioning result, investigate wear, contamination, pressure changes, flow-control changes, and load changes rather than simply closing the needle further.
Cushioning Capacity Chart FAQs
What is a cushioning capacity chart used for?
It screens a specific cylinder configuration against a combination of moving mass and speed at the start of cushioning. The curve applies only under the model, cushion, pressure, orientation, and other conditions stated by the manufacturer. It is not a universal rodless-cylinder limit.
Should I plot payload mass or total moving mass?
Plot the mass defined by the selected catalogue. This commonly includes payload, tooling, carriage or guided table, and the actuator’s piston or internal carriage mass. Parker also instructs users to add guide-carriage or brake-housing mass where fitted.
Can I use average cylinder speed on the chart?
Only when the chart explicitly calls for average speed and you calculate it by that manufacturer’s method. Many cushioning procedures require piston or carriage speed at cushion entry. Measure at that position whenever possible because full-stroke average speed can hide a higher entry velocity.
Does adjusting the cushion needle increase cushioning capacity?
No. Needle adjustment changes exhaust restriction and the deceleration profile within the product’s permitted setup range. It does not create a new rated mass-speed envelope. A point outside the published boundary needs a changed operating condition or a different stopping solution.
What should I do if the operating point is outside the chart?
Reduce cushion-entry speed or moving mass, select another approved cylinder or cushion configuration, increase controlled stopping distance, or add a correctly sized external shock absorber. Replot the revised case and commission it under controlled conditions.
Sources and technical references
- Parker, Rodless Pneumatic Cylinders Catalogue 0900P, retrieved July 23, 2026.
- SMC, MY1H Series Selection Graphs, retrieved July 23, 2026.
- SMC, MY1 Series Catalogue, retrieved July 23, 2026.
- Festo, Cylinder Cushioning: The Three Most Common Methods, retrieved July 23, 2026.
- ACE Controls, Calculation Bases for Industrial Shock Absorbers, retrieved July 23, 2026.