

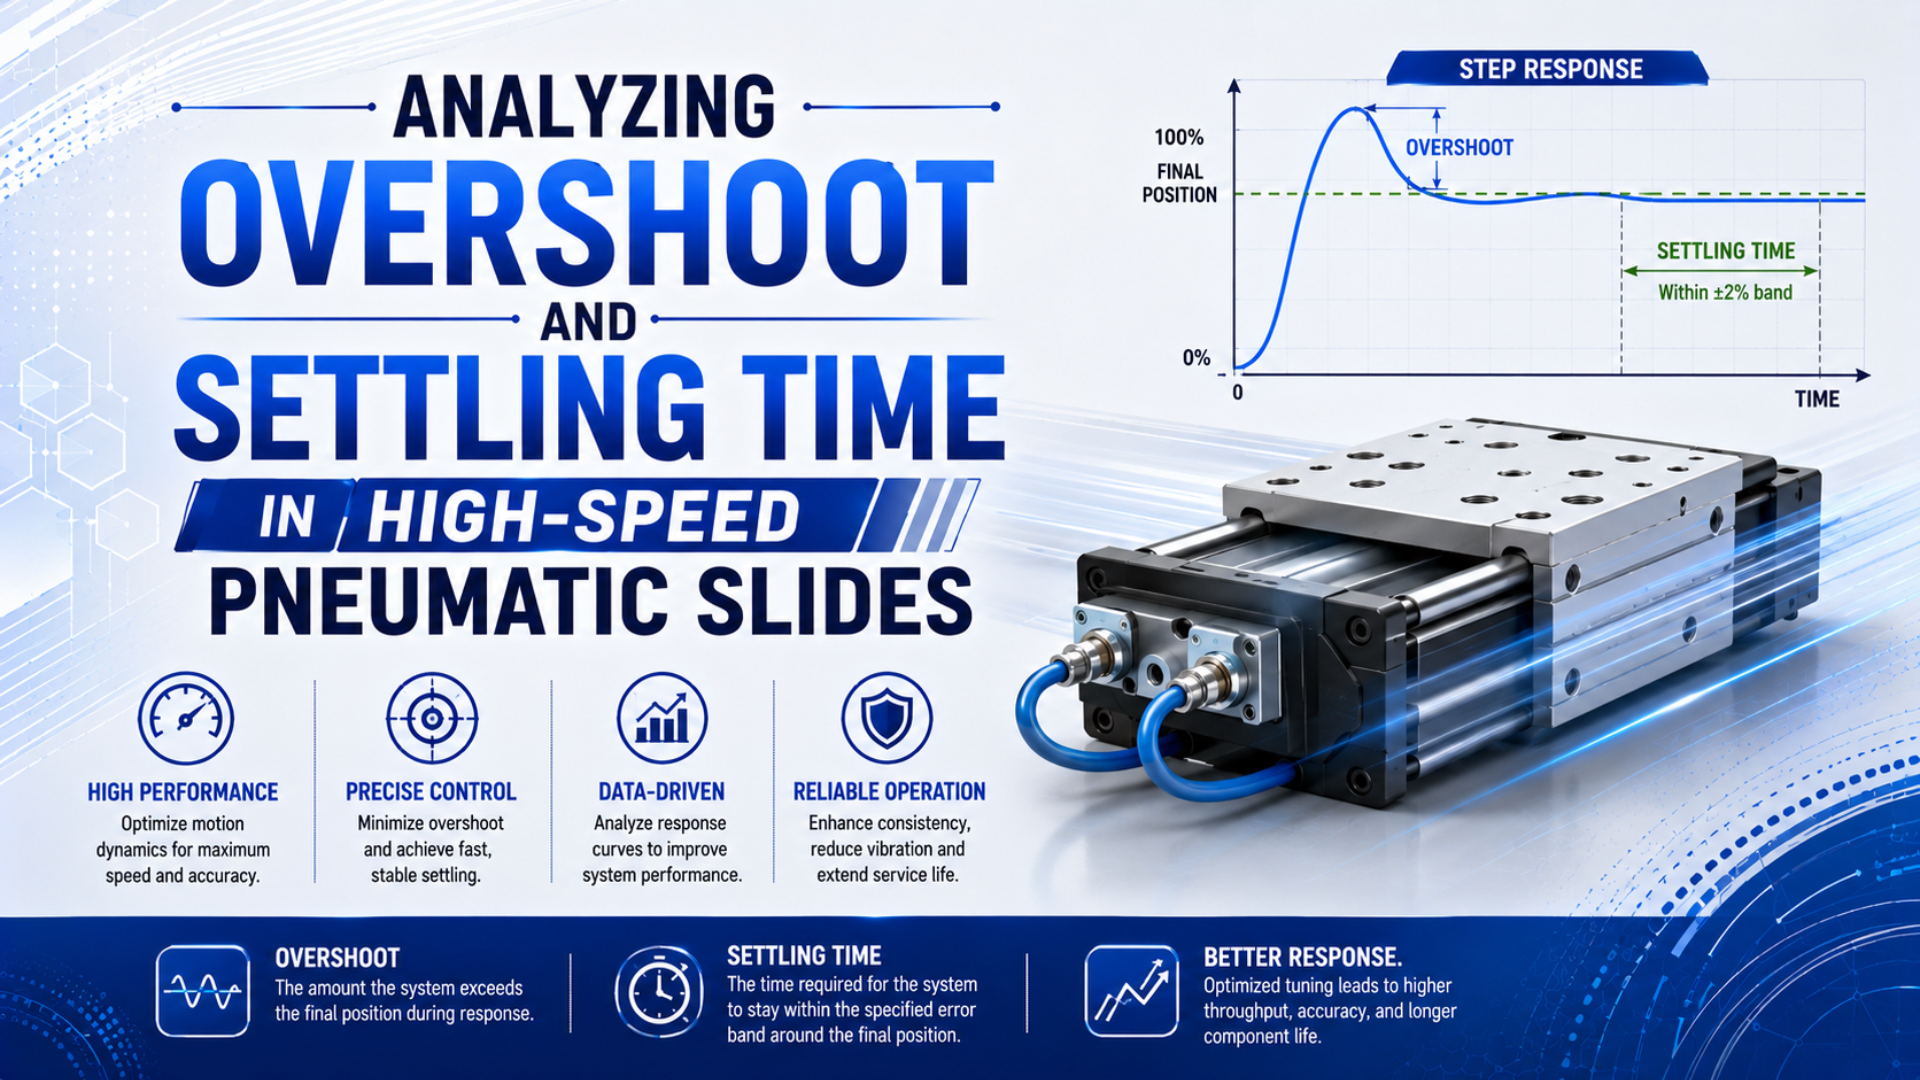
Pneumatic slide overshoot is the maximum travel beyond a declared target after a position command. Settling time is the interval from a declared start event until position enters and remains inside a declared tolerance band. Neither metric is meaningful until the target, start event, tolerance, observation window, payload, speed, and stop method are stated.
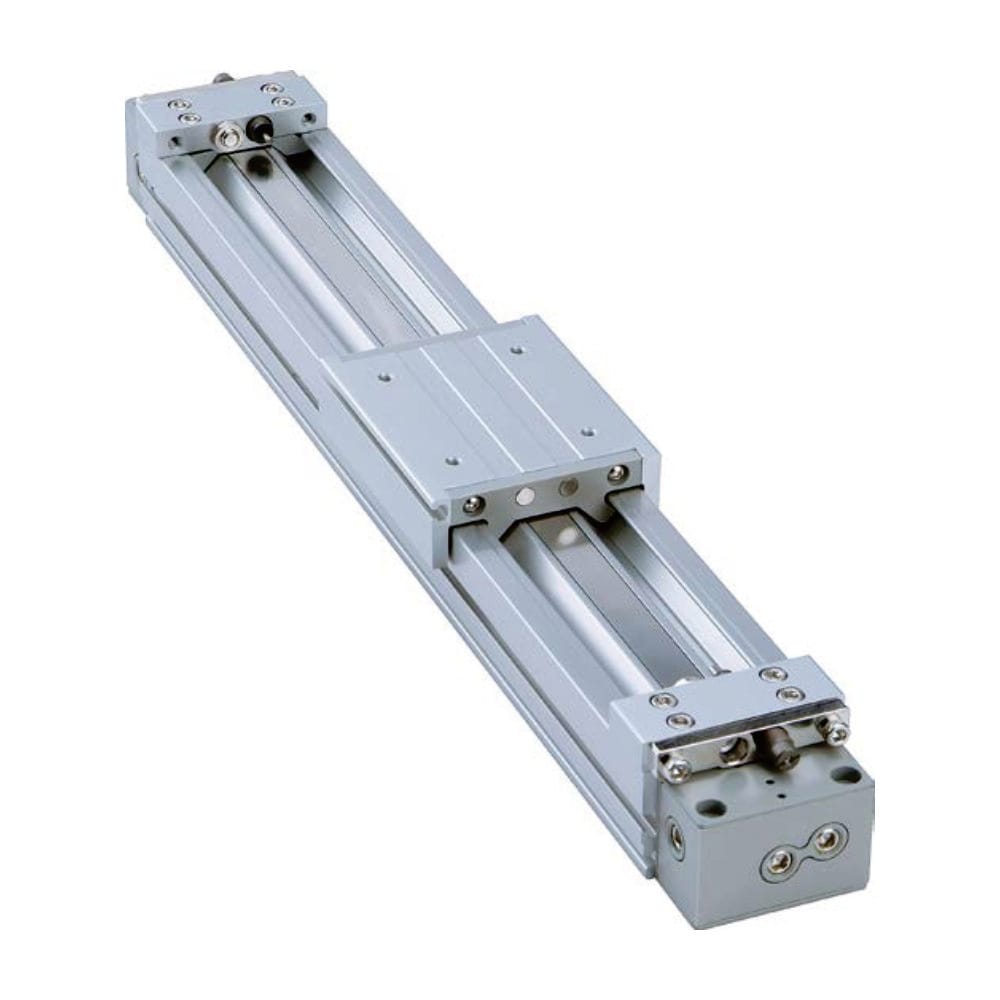
That boundary matters because a slide running into its physical end cap cannot pass through the end stop. The visible motion may be impact and rebound, not servo-position overshoot. A proportional or servo-pneumatic axis stopping at an intermediate setpoint is a different control problem. This guide shows how to measure both cases without confusing them.
Publisher and author information is available on About Us. Send technical corrections or application questions through Contact.
Key Takeaways
- Define the target, tolerance band, and timing boundary before comparing settling time.
- Record position, both chamber pressures, valve command, and sensor state on one time base.
- Use cushion-entry speed and moving mass, not average speed alone, for the stopping-energy check.
What Do Overshoot and Settling Time Actually Measure?
A 2020 pneumatic positioning experiment reported settling time against two separate bands: 2% of step amplitude and a fixed ±0.1 mm around the setpoint. The two results answer different acceptance questions, which is why a drawing or test plan must declare the tolerance before any settling-time value is compared (Actuators, 2020).
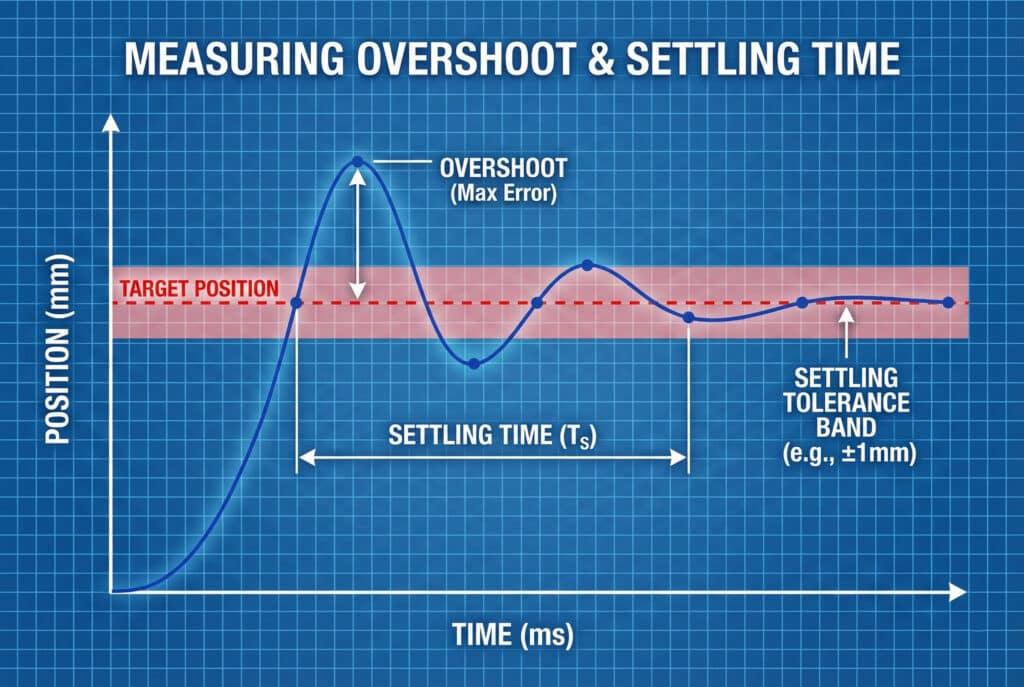
For a positive position step, overshoot can be written as:
is overshoot distance, is the greatest measured position after the command, and is the commanded target. For motion in the negative direction, apply the same definition in the commanded direction rather than reporting a misleading negative value.
Settling time requires a tolerance band :
is the declared start event, such as the controller command or the beginning of deceleration. is the first time after which position remains within for the full declared observation window. State that window so a later drift or second rebound isn’t ignored.
Keep these related metrics separate:
| Metric | Definition | Why it matters |
|---|---|---|
| Peak overshoot | Farthest travel beyond the commanded target | Shows control or stopping excursion |
| Rebound amplitude | Reverse travel after contact or peak compression | Reveals impact and energy return |
| Settling time | Time to enter and remain inside the declared band | Connects motion to usable cycle time |
| Steady-state error | Final position minus commanded target | Exposes bias after transients decay |
| Repeatability | Spread of final positions across repeated cycles | Separates a stable offset from random variation |
| Sensor confirmation time | Command-to-qualified sensor transition | Represents the PLC-visible event, not necessarily physical settling |
From our analysis of the two published tolerance definitions, the same motion trace can pass the percentage band and fail the fixed band. Store the raw trace so the result can be recalculated if the process tolerance changes.
An end switch can turn on before a carriage has mechanically settled. If the PLC advances the process on that first edge, the machine may transfer vibration or load error into the next operation even though the axis appears to meet its electrical cycle time. Qualify the sensor signal for the process, or measure position directly where settling matters.
Which Signals Need to Be Recorded on One Time Base?
A 2026 pneumatic-cylinder friction experiment recorded piston position, velocity, both chamber pressures, and friction force together. That measurement set illustrates the minimum diagnostic principle: align the command, pneumatic response, and mechanical motion before assigning a slow or unstable stop to the valve, cushion, air spring, controller, or guide (Actuators, 2026).
Use one clock for every recorded channel. A PLC trend, encoder controller, and separate pressure logger can each be accurate yet still produce a false cause-and-effect sequence if their timestamps aren’t aligned.
| Signal | Event or value to extract | Diagnostic value |
|---|---|---|
| Motion command | Output transition and requested target | Defines the control start event |
| Valve command or spool feedback | Electrical demand and verified shift where available | Separates controller delay from pneumatic delay |
| Cap-side pressure | Rise, peak, and final pressure at the actuator port | Shows drive-side pressure buildup |
| Opposite-side pressure | Exhaust decay, back pressure, and cushion pressure | Exposes restricted exhaust and trapped-air behavior |
| Position | First motion, velocity, peak position, rebound, final position | Supplies overshoot and settling metrics |
| End or position sensor | First edge, dropout, and qualified state | Connects physical motion to PLC sequencing |
| Load and temperature | Actual payload, orientation, component temperature | Makes repeated tests comparable |
There is no universal minimum sampling rate for every pneumatic slide. Choose sensor bandwidth, sample interval, position resolution, pressure range, and anti-alias filtering from the shortest transient and narrowest tolerance you need to resolve. Document those settings with the result. A number without its measurement chain isn’t portable evidence.
For a complete timing budget, distinguish valve shifting from pressure buildup, first motion, travel, cushioning, and sensor confirmation. The article on valve response-time consistency covers the valve boundary, while the high-speed cylinder specification checklist covers the complete motion system.
Reading Four Trace Signatures
An experimental investigation of pneumatic end cushioning found shock and vibration at both cylinder ends and showed that load and supply pressure changed the cushioning response. The practical lesson is that a visible bounce is a motion signature, not proof of one universal air-spring frequency or one incorrect needle setting (Kim et al., 2002).
Use the following diagnostic split:
- A sharp terminal impact points first to incoming speed, moving mass, ineffective cushion travel, an external stop, or structure.
- Several decaying reversals point toward stored pneumatic or mechanical energy with insufficient damping.
- Continuing valve corrections point toward control gain, delay, deadband, saturation, sensor noise, or an unrealistic motion profile.
- Jerky motion before deceleration points toward seal friction, lubrication, side load, alignment, or unstable flow control.
The air-compressibility and cylinder-bounce guide develops the trapped-air model. The meter-out control guide covers exhaust-side speed stability. Keep both mechanisms separate from controller tuning.
We analyzed the four motion signatures against the same synchronized channels. The distinguishing evidence isn’t the peak alone. It is whether pressure, position, and valve command reverse in the same order.
Pressure and position phase are often more useful than peak position alone. If a reversal follows an end-cap pressure spike after valve output is steady, investigate stopping energy and trapped air. If every position crossing is followed by a new command reversal, the controller is still driving the oscillation.
How Does Moving Energy Limit End-of-Stroke Performance?
Parker states that piston speed at the start of cushioning is typically about 50% higher than average stroke speed in its OSP-P selection method. Because kinetic energy varies with speed squared, using average speed can materially understate the energy that the installed cushion or external shock absorber must manage (Parker OSP-P, retrieved 2026-07-23).
The translational kinetic energy at cushion entry is:
is kinetic energy in joules, is the complete moving mass in kilograms, and is measured velocity at the start of deceleration in metres per second. Include the carriage, tooling, workpiece, moving cables, and reflected rotating inertia where relevant.
The absorber may also have to resist continued pneumatic thrust and gravity through the deceleration distance:
is net driving force during stopping, is effective deceleration distance, and is gravitational work in the direction of motion. Use the selected cylinder or shock-absorber manufacturer’s method for vertical, inclined, rotating, or coupled loads. This screening equation doesn’t replace a model-specific energy curve or hourly-energy limit.
Doubling at constant mass multiplies by four. Doubling mass at constant speed doubles it. Momentum still matters to the force-time history of an impact, but energy is the starting quantity for cushion and shock-absorber capacity.
For component selection, continue with the external shock-absorber sizing guide or the high-speed air-cushion guide. This article stays focused on the measured response and acceptance boundary.
When Should You Adjust the Cushion, Flow, or Controller?
SMC publishes MY1M air-cushion strokes from 12 to 37 mm across the cited 16 to 63 mm bore range, with separate mass-speed limit curves at 0.5 MPa. Those values are product-specific evidence, not a universal deceleration distance or pressure setting for every pneumatic slide (SMC MY1M, retrieved 2026-07-23).
Choose the adjustment from the trace, not from the symptom label alone:
| Evidence | First engineering action | What not to assume |
|---|---|---|
| Hard impact, high cushion-entry speed, cushion pressure rises late | Reduce approach speed and verify effective cushion engagement | More needle restriction can absorb unlimited energy |
| Slow final travel, high trapped pressure, full stroke is delayed | Recheck the exact cushion start-up procedure and reopen gradually if specified | A fully closed needle is a safe universal starting point |
| Speed changes with exhaust pressure or silencer condition | Inspect meter-out control, valve flow, tube, fittings, and exhaust restriction | Regulator pressure alone controls speed |
| Command continues reversing around the setpoint | Review control gain, deadband compensation, filtering, saturation, and motion profile | Mechanical cushioning will tune a closed-loop controller |
| Pressure is stable but position moves in steps | Inspect friction, lubrication, alignment, guide moments, and side load | A larger valve will correct stick-slip |
| External stop contacts before the internal cushion becomes effective | Size and position the external stop or shock absorber for the actual impact | The internal cushion is still absorbing the full event |
Parker’s OSP-P operating instructions specify closing the cushioning needles and reopening them about one-half turn during commissioning for the named cylinder family, followed by low-speed testing and checks against its mass-speed diagram. Apply that procedure only to the covered product, not to every cushion design (Parker OSP-P operating instructions, retrieved 2026-07-23).
If the axis uses proportional or servo control, tune within the valve’s flow, pressure, deadband, and response limits. Input smoothing or a slower approach command can reduce overshoot, but it may lengthen rise time. A 2021 on-off-valve positioning experiment reported different rise time and overshoot as controller parameters and payload changed, reinforcing that one result belongs to its tested plant and controller (Actuators, 2021).
Test Load, Speed, and Pressure as a Matrix
SMC’s MY1M cushion charts use 0.5 MPa horizontal-collision conditions and separate curves for each bore and stopping option. Parker likewise separates its guide-load limits from its end-cushion diagram. A valid acceptance test must preserve the selected model, orientation, payload, stop method, dynamic pressure, and speed instead of transferring one catalog threshold across assemblies.
Build a test matrix around the operating extremes:
- Make the test safe. Guard the moving zone, control stored pneumatic and mechanical energy, and follow the machine’s commissioning procedure.
- Establish the baseline. Record valve command, both port pressures, position, sensor state, load, and temperature at a conservative speed.
- Test maximum moving mass. Include tooling, product, carriage attachments, and service loops.
- Test minimum moving mass. A cushion or controller tuned for the heaviest product can behave differently when the payload is removed.
- Test the fastest approved motion. Use measured velocity at cushion entry, not stroke length divided by total time.
- Test minimum dynamic supply pressure. Measure at the actuator while it moves. A regulator gauge upstream cannot reveal a short pressure collapse.
- Test relevant temperatures and duty. Let component temperature stabilize and run at the sustained production rate.
- Repeat enough cycles to show spread. Report individual values or distribution, not one best trace.
| Test case | Inputs held or recorded | Required outputs |
|---|---|---|
| Maximum mass and speed | Payload, orientation, flow setting, dynamic pressure | Peak overshoot or rebound, settling time, peak pressure, sensor confirmation |
| Minimum mass | Same command and stop method | Repeatability, rebound, controller activity |
| Minimum dynamic pressure | Production flow demand and upstream condition | Stroke time, cushion-entry speed, final position |
| Warm and cold operating states | Component temperature and cycle count | Metric drift and fault signature |
| Sustained production rate | Full machine sequence and shared air demand | Timing distribution, pressure recovery, temperature, missed sensor events |
Do not improve one metric by hiding another. A slower approach can reduce overshoot but miss the cycle target. A narrow tolerance can expose long settling that a first sensor edge concealed. More supply pressure can increase available force and stopping demand at the same time. Record the whole acceptance set after every change.
Our team analyzed the manufacturer selection boundaries cited above. Each separates at least two constraints: load and moment capability, then stopping capacity. A slide that carries the payload can still fail the cushion check.
What Belongs in the Acceptance Specification?
The cited 2020 positioning study ran 16 step inputs with 20 mm increments and reported maximum overshoot plus average settling times and standard deviations. A production specification needs the same discipline: define the command sequence, tolerance, repetitions, statistic, load cases, and test conditions before assigning a pass or fail (Actuators, 2020).
Use a requirement that another engineer can reproduce:
With the declared payload, orientation, air preparation, dynamic actuator-port pressure, valve, tubing, flow-control settings, stop hardware, and stabilized temperature, command the defined move. Measure position and both chamber pressures on the same time base. Report peak overshoot or rebound, settling time inside the declared tolerance band, steady-state error, repeatability, and qualified sensor time across the declared number of cycles.
Add the fields that decide whether the result is usable:
- exact cylinder, carriage, guide, valve, cushion, shock absorber, and sensor order codes;
- stroke, start position, target position, direction, payload, and load offset;
- command profile, flow-control setting, regulator setpoint, and dynamic port pressures;
- tolerance band, observation window, timing start event, and signal qualification logic;
- sensor type, resolution, bandwidth, sampling rate, filter settings, and clock synchronization;
- component temperature, ambient condition, air quality, duty, and warm-up state;
- number of cycles, excluded-cycle rule, distribution, and worst recorded value;
- acceptance limits for impact, rebound, overshoot, settling, final error, pressure, noise, and sensor state.
The most transferable metric is often not one settling-time number. It is a trace package plus a declared calculation rule. That package lets maintenance distinguish a later cushion drift, clogged exhaust, pressure loss, guide wear, sensor shift, or controller change without guessing what the original value meant.
Pneumatic Slide Overshoot and Settling Time FAQs
Parker’s approximately 50% cushion-entry-speed warning and SMC’s separate model-specific mass-speed curves show why no universal overshoot or settling target applies to every slide. The acceptable values must come from the process tolerance, stop method, selected hardware, control architecture, and a repeatable test conducted inside the approved operating envelope.
What is an acceptable overshoot for a pneumatic slide?
Use the maximum excursion allowed by the product, tooling, sensor window, clearance, and next process step. A servo axis may have a specified position band, while a slide reaching a physical end stop may need a rebound limit instead. State the target, direction, tolerance, and measurement method rather than borrowing a generic millimetre value.
When does pneumatic-slide settling time begin?
The start event must be declared. It may be the controller command, the start of deceleration, first entry into a sensor window, or another process event. Command-to-settled time includes valve and pressure delays that deceleration-to-settled time excludes. Use one boundary consistently when comparing configurations or production drift.
Can an end sensor prove that the slide has settled?
Not by itself. A sensor proves that its switching condition was met. The carriage may still be moving, rebounding, or flexing while the signal remains on. Compare the sensor edge with position data and define any qualification time needed by the process. Use direct position measurement when mechanical settling is the acceptance requirement.
Should increasing supply pressure reduce overshoot?
Not reliably. Pressure can change acceleration, available force, chamber stiffness, flow conditions, and the energy delivered during deceleration. It may shorten one interval while increasing impact demand. Measure dynamic pressure at both cylinder ports, stay within every component rating, and correct flow restriction, cushion capacity, load, or controller behavior at its source.
When is an external shock absorber required?
Use one when the selected cylinder’s cushion curve is exceeded, an external machine stop defines the position, or the application needs a separately rated energy absorber. Size it from impact speed, complete moving mass, continued drive force, effective stroke, orientation, cycles per hour, temperature, and the exact manufacturer’s limits.
Sources and technical references
- Parker, OSP-P Pneumatic Rodless Cylinders and Linear Guides, cushion-entry speed, moving mass, load limits, and external shock-absorber boundary. Retrieved 2026-07-23.
- Parker, OSP-P Maintenance and Operating Instructions, model-specific commissioning and cushion adjustment. Retrieved 2026-07-23.
- SMC, MY1M Mechanically Jointed Rodless Cylinder, air-cushion strokes and model-specific mass-speed curves. Retrieved 2026-07-23.
- SMC, MY1H Mechanically Jointed Rodless Cylinder, cushion purpose, effective range, and shock-absorber selection boundary. Retrieved 2026-07-23.
- Festo, Cylinder Cushioning: The Three Most Common Methods, mass, speed, deceleration, pressure, and resistance effects on adjustment. Retrieved 2026-07-23.
- Kim, Lee, and Kim, An Experimental Study on the Cushioning Characteristics of Pneumatic Cylinder System, experimental end-point shock and vibration context. Retrieved 2026-07-23.
- Actuators, Accurate Motion Control of a Pneumatic Linear Peristaltic Actuator, explicit overshoot and settling-band definitions. Retrieved 2026-07-23.
- Actuators, Real-Time Pneumatic Positioning Using Low-Cost On-Off Valves, experimental payload and controller effects on transient response. Retrieved 2026-07-23.
- Actuators, Experimental and System-Level Simulation Study of Stick-Slip Characteristics in Pneumatic Cylinders, synchronized position, velocity, pressure, and friction measurement. Retrieved 2026-07-23.