

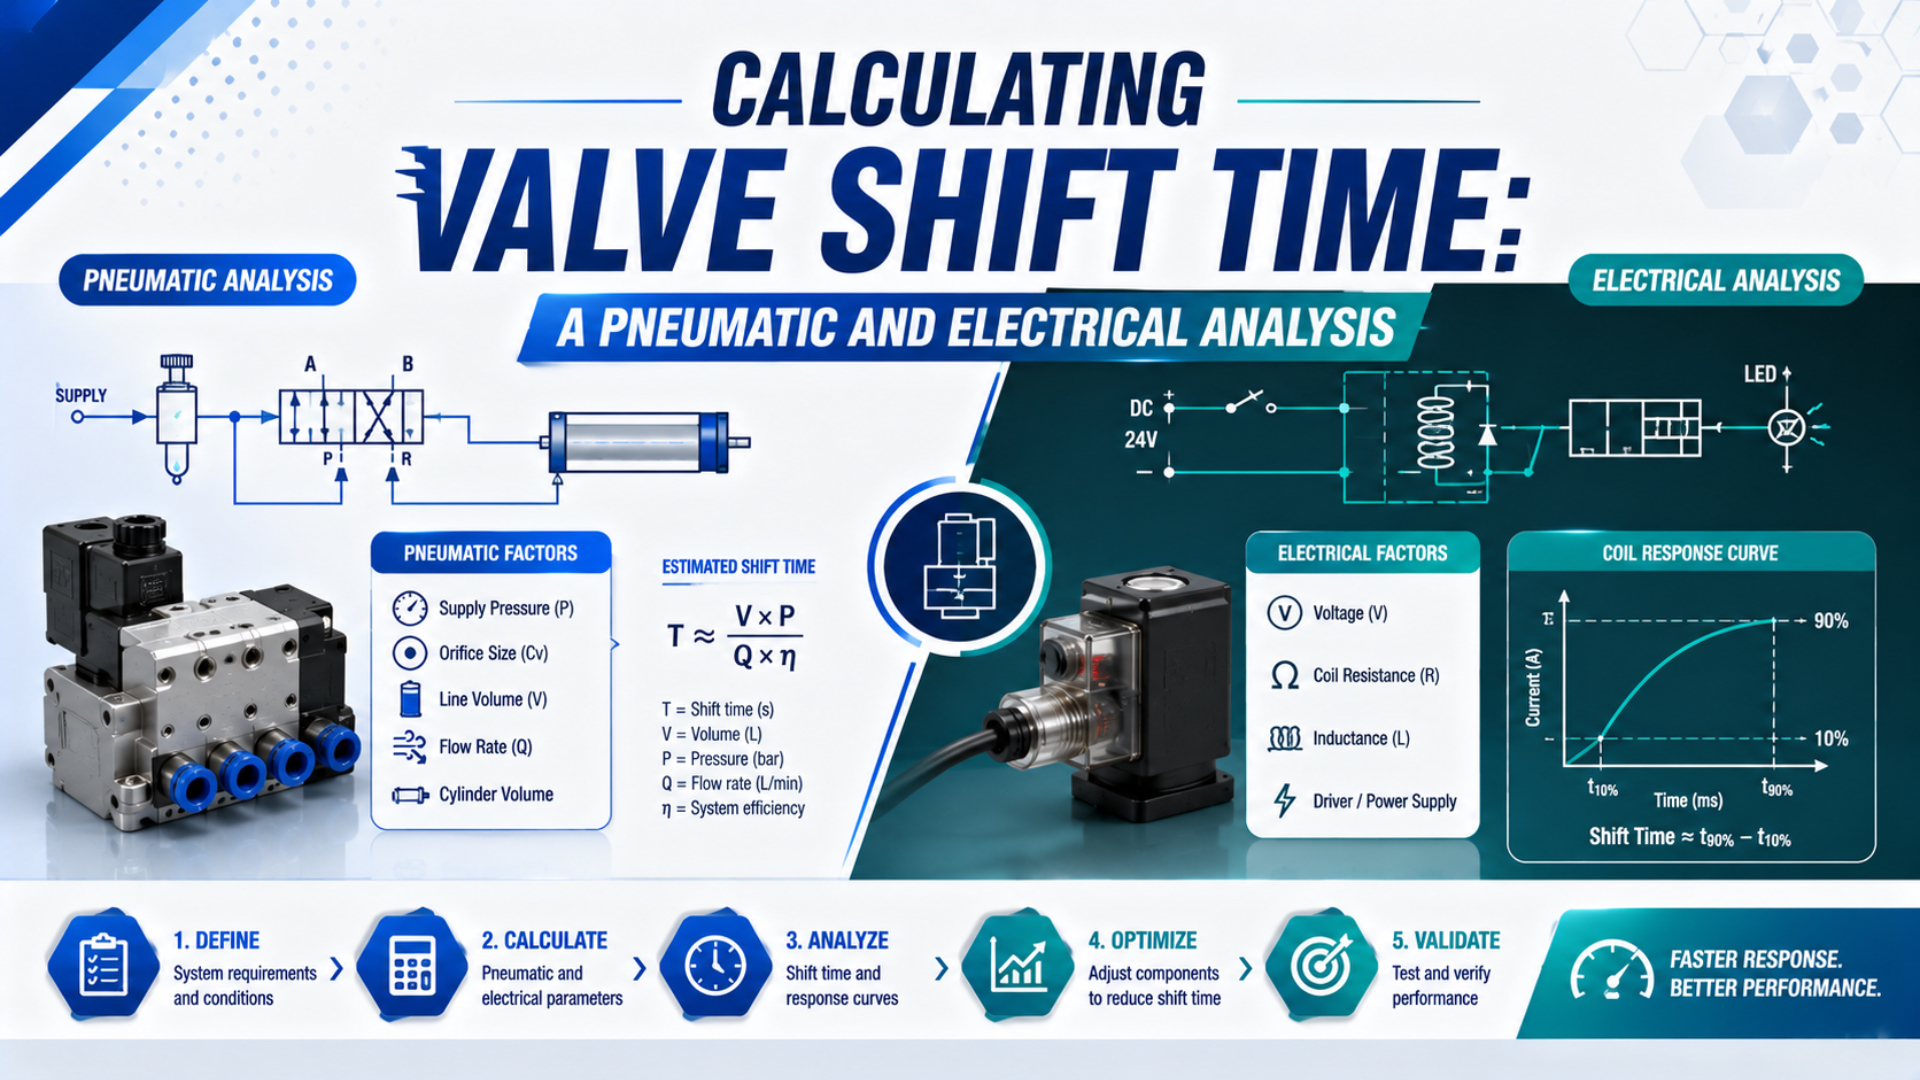
Valve shift time is the interval between a defined command and a defined directional-valve result. It cannot be calculated from Cv, coil voltage, or port size alone. A useful estimate separates the terms that physics can approximate from the internal valve term that requires a catalog value or measured trace.
This article is a calculation worksheet: electrical current rise, model-specific valve time, downstream fill, and non-overlapping totals. For timing allocation, variation, and precision-system architecture, use the broader guide to solenoid valve response times in precision applications. For test equipment and thresholds, use the separate measurement guide.
Key Takeaways
- ISO 12238:2023 standardizes shifting-time tests for 2- and 3-position directional valves.
- SMC JSY data spans 5–42 ms at 0.5 MPa, 20°C, and rated voltage.
- Calculate coil and fill stages, but use catalog or measured data for internal valve motion.
- Verify every estimate with synchronized electrical and pressure traces.
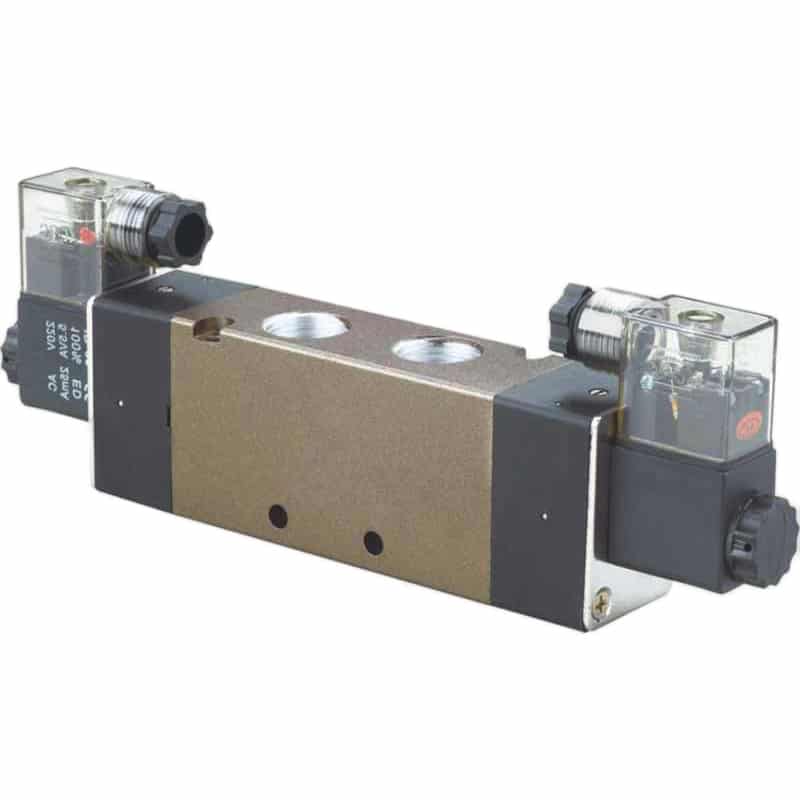
The product photograph shows the kind of directional valve being discussed, not a timing result. Response depends on the exact valve function, coil, connector electronics, pilot arrangement, pressure, test circuit, and measured threshold. Start with the model-specific data sheet, then calculate only the delays outside its declared measurement boundary.
What Exactly Is Valve Shift Time?
ISO 12238:2023 covers shifting-time tests for electrically or pneumatically operated directional valves with 2 or 3 positions, including monostable and bistable designs (ISO 12238:2023, 2023). Valve shift time is therefore a defined component test, not automatically the elapsed time to a cylinder’s end sensor.
A response-time discussion should name three events:
- Start event: PLC output, driver enable, voltage at the coil, current threshold, or pneumatic pilot signal.
- Valve result: spool position, port-pressure threshold, or another endpoint defined by the test method.
- Machine result: downstream pressure, actuator motion, part arrival, or sensor transition.
If the start is “PLC command on” and the endpoint is “reed switch on,” the measurement includes much more than valve shifting. It contains controller scheduling, output-module delay, coil response, valve movement, air-line fill, cylinder breakaway, travel, cushioning, and sensor response. Call it machine response time or command-to-arrival time.
By contrast, a valve replacement comparison should keep the pneumatic test circuit, pressure, temperature, electrical supply, connector electronics, sensor position, and threshold unchanged. The solenoid valve response-time measurement guide covers that bench method in detail.
The first calculation is not arithmetic. It is a boundary decision. When the boundary is vague, adding more decimal places only makes an ambiguous result look precise.
Which Terms Can Be Calculated and Which Must Be Measured?
SMC reports response times from 5 to 42 ms for selected JSY1000, JSY3000, and JSY5000 configurations at 0.5 MPa, with the coil at 20°C and rated voltage (SMC JSY catalog, accessed 2026). Calculate external stages, but treat internal valve motion as a tested block.
Classify every worksheet row before entering a number:
| Row type | Examples | Correct treatment |
|---|---|---|
| Calculated | ideal RL current rise, physical tube volume, screening fill time | use equations with explicit assumptions |
| Catalog | model-specific switching time, voltage tolerance, pressure range | copy the exact model, option, condition, and limit |
| Measured | PLC output delay, coil trace, port-pressure response, sensor filtering | record instruments, thresholds, repetitions, and extrema |
| Assumed | early-stage controller or efficiency allowance | label visibly and replace with evidence before acceptance |
For a machine event assembled from non-overlapping stages, use this planning relationship:
Here, is the complete command-to-result time. The controller term includes task and output delay. The valve term uses a catalog value or measured command-to-port response. The line term covers downstream fill or exhaust. The load term covers actuator breakaway and travel. The sensor term includes sensing and filtering. All terms use the same time unit.
Do not add electrical and mechanical estimates on top of a catalog valve-response value unless the manufacturer’s test boundary excludes them. Most electrical-command response values already contain coil and moving-part behavior. Double-counting those stages creates a conservative-looking estimate that is technically wrong.
The same separation helps during fault finding. If the port pressure changes on time but the cylinder sensor is late, replacing the coil won’t fix the load-side delay. Review tubing, flow controls, exhaust restriction, actuator friction, cushioning, and payload instead.
How Can You Estimate Solenoid Current Rise?
Texas Instruments specifies the DRV110 for 6 to 48 VDC solenoid control and states that initial current ramp time depends on coil inductance and resistance (TI DRV110 data sheet, revised 2018). An RL equation can screen pickup delay before movement, but it cannot predict the complete valve response.
For a fixed resistance and inductance before the armature begins to move, coil current is approximated by:
Here, is coil current in amperes after time in seconds, is applied voltage in volts, is total circuit resistance in ohms, and is coil inductance in henries. The electrical time constant is . After one time constant, current reaches about 63.2% of its fixed-circuit final value.
If the manufacturer provides a pickup-current threshold , the idealized time to that current is:
This expression is valid only when and the assumed and remain suitable over the interval. Resistance rises as the coil warms. Inductance can change with armature position, and driver current limiting can replace the simple voltage-step behavior. Use measured current when the timing margin is tight.
Peak-and-hold drivers make that limitation especially important. The DRV110 ramps to a controlled peak current, holds it for an externally set interval, then reduces current to a lower holding value. Those settings belong to the approved driver design. Applying an arbitrary overvoltage directly to a rated coil is not an acceptable shortcut.
For more electrical context, see the coil inductance and solenoid response guide and the comparison of AC and DC pneumatic valve coils.
Why Can’t Mechanical Shift Be Calculated from Coil Data Alone?
Festo lists both switch-on and switch-off time as 3.5 ms for its direct-acting MHA4 valve, but also declares different tolerances: +10%/-30% on switch-on and +10%/-40% on switch-off (Festo MHA4 data sheet, accessed 2026). Coil current alone cannot reproduce those mechanical and pneumatic limits.
Once magnetic force exceeds spring, friction, seal, and pressure forces, the moving element accelerates. Armature mass, stroke, magnetic-gap geometry, spring rate, residual magnetism, spool or poppet friction, pressure imbalance, lubricant, temperature, and contamination all influence the time. Pilot-operated valves add pilot-orifice filling and main-stage movement.
A manufacturer can model those details during design, but a machine builder rarely has enough internal geometry or magnetic data to reproduce the result. Use the catalog switching time for the exact valve and electrical option. If that value is missing, request it or measure the valve under an agreed circuit.
What about an audible click? It can confirm that something moved, but it doesn’t define the instant when the required port path opened or closed. A click microphone, accelerometer, spool sensor, current signature, and pressure transducer observe different events. Label the one used in the test report.
The best calculation often treats the valve as a tested block. Calculate the delays you can justify on either side of that block, and don’t reverse-engineer an internal shift time from nameplate watts.
Catalog Values That Belong in the Calculation
SMC’s JSY catalog gives 15 ms for one 2-position single JSY1000 and 42 ms for one 2-position single JSY5000, both at 0.5 MPa, 20°C, and rated voltage (SMC JSY catalog, accessed 2026). Enter the exact configuration, not a family average.
A direct-acting valve uses electromagnetic force to move the sealing element. It can work without a pneumatic pilot stage, but coil force limits the practical orifice and pressure range. A pilot-operated valve uses a smaller solenoid stage plus pressure energy to move a larger main element, so minimum pilot pressure and pilot-path condition matter.
The timing review should record:
| Design factor | Why it changes response | Required evidence |
|---|---|---|
| Direct or pilot operation | Adds or removes a pneumatic pilot stage | Exact valve construction and pilot specification |
| Monostable or bistable | Changes return mechanism and command sequence | Function symbol and energization state |
| Two or three positions | Changes travel and neutral-state behavior | Model-specific response data |
| Rubber or metal seal | Changes friction, leakage, and pressure forces | Manufacturer data, not a generic assumption |
| Internal or external pilot | Changes dependence on main supply pressure | Pilot source, range, and measured pressure |
| Suppression option | Changes current decay and release behavior | Connector or manifold electrical code |
An illuminated connector isn’t proof that the coil received rated voltage during the event. Measure at the coil or connector under load. Likewise, a static regulator gauge does not prove adequate pilot pressure while several valves and cylinders are consuming air.
Pilot-operated and direct-acting valves use different internal air paths, so those construction details must come from the exact product documentation rather than a generic response-time assumption.
Downstream Fill and Exhaust Calculation
ISO 6358-3:2014 models both subsonic and choked flow when estimating the steady-state flow characteristics of connected pneumatic components (ISO 6358-3:2014, 2014). A downstream fill estimate can support cycle planning, but it should remain separate from the standardized valve shift result and use absolute pressure.
For an isothermal screening estimate with constant equivalent free-air flow, first calculate the normalized air volume required:
Here, is required free-air volume in normalized liters, is chamber volume in liters, and are initial and target absolute pressures in the same unit, and is the normalization pressure. The estimate assumes constant temperature and does not include leakage.
Then estimate fill time from effective normalized flow:
The variable is effective normalized flow in liters per second. It must represent the complete path, not merely a catalog free-flow value. Valve conductance, pressure ratio, fittings, tubing, manifolds, flow controls, silencers, and changing chamber pressure can all reduce it.
This is a screening calculation. Real flow is not constant throughout a large pressure rise, and the path may move between choked and subsonic regimes. ISO 6358-1 specifies steady-state component testing, while ISO 6358-3 provides a numerical system method. Use manufacturer flow data or measured flow for a higher-confidence transient model.
When tube dimensions are not known, calculate their contained volume first with the Pneumatic Tube Volume Calculator. Add valve manifold cavities, actuator ports, pressure-sensor adapters, and any receiver volume between the valve and measurement point. For breakaway pressure and changing cylinder volume, continue with the cylinder response and dead-volume analysis.
Exhaust deserves its own estimate. The exhaust path may differ from the supply path, and a silencer can add restriction. A meter-out flow control intentionally slows chamber pressure decay. Don’t reuse the fill-flow number unless the circuit is genuinely symmetrical and the relevant pressure ratios match.
Worked Timing Budget: From PLC Command to Pressure Threshold
SMC lists 15 ms for the JSY1140T 2-position single valve at 0.5 MPa, rated voltage, and a 20°C coil (SMC JSY catalog, accessed 2026). The example below combines that declared valve block with separate, stated planning assumptions rather than presenting a universal result.
Assume a fixture requires pressure in a 0.25 L downstream volume to rise from 1 bar absolute to 7 bar absolute. The complete path is estimated to deliver 300 normalized L/min, and a 70% fill-efficiency allowance is applied. The controller/output delay is assumed to be 2 ms and the pressure-sensor filter 5 ms.
The normalized air requirement is:
Effective flow is 210 normalized L/min, or 3.5 normalized L/s. The screening fill time is therefore:
The planning budget becomes:
| Stage | Value | Status |
|---|---|---|
| Controller and output | 2 ms | Assumed, verify from trace |
| Catalog valve response | 15 ms | Model-specific SMC value at stated conditions |
| Downstream fill | 429 ms | Screening estimate |
| Sensor filter | 5 ms | Assumed, confirm configuration |
| Estimated command-to-pressure result | 451 ms | Planning total, not acceptance evidence |
This example reveals the bottleneck: downstream fill dominates the budget. Replacing a 15 ms valve with a 10 ms valve would change the estimate far less than reducing cavity volume or increasing verified effective path flow. Yet that conclusion remains conditional on the assumptions.
Always preserve the stage table beside the total. A single “451 ms response” number hides the design lever and makes later troubleshooting harder.
How Should the Estimate Be Measured and Validated?
ISO 12238:2023 contains test procedures for electrically and pneumatically operated directional valves with 2 or 3 positions (ISO 12238:2023, 2023). Machine validation should follow the same discipline: record the command and selected pneumatic endpoint on one time base, then declare the threshold, circuit, and conditions.
Use enough channels to locate the delay:
| Channel | Recommended measurement | What it isolates |
|---|---|---|
| Controller | commanded output timestamp | program, network, and task delay |
| Electrical | voltage and current at the valve | wiring, output module, driver, coil buildup and decay |
| Valve-side pneumatic | fast transducer near working port | command-to-port response |
| Load-side pneumatic | transducer at actuator or cavity | tubing and path delay |
| Mechanical | position sensor, encoder, or high-speed switch | breakaway, travel, cushioning, and load |
Sampling must be fast enough for the event. A 10 ms target cannot be resolved credibly with a logger that produces one sample every 10 ms. Record sensor bandwidth, logger rate, channel synchronization, filtering, and timestamp resolution. Keep raw traces, not only a calculated average.
Repeat both energizing and de-energizing events. SMC’s SY3000 data, for example, shows that connector suppression options can change listed response from 12 to 15 ms for a 2-position single valve at 0.5 MPa (SMC SY catalog, accessed 2026). Opening and closing are not interchangeable.
Define warm-up and supply conditions. Record voltage at the coil, dynamic inlet and pilot pressure, medium and ambient temperature, downstream volume, fittings, tube ID and length, exhaust hardware, flow-control setting, cycle frequency, and valve orientation. Those fields make another engineer’s result comparable.
How Do You Reconcile the Estimate with a Measured Trace?
Texas Instruments measured about 10 ms de-actuation with freewheeling and about 3.5 ms with a faster decay approach in one solenoid-driver example (TI, Using Motor Drivers to Drive Solenoids, revised 2022). Reconcile each worksheet row with the matching trace interval instead of adjusting the total blindly.
Compare the calculated and measured boundaries in this order:
- Command late: inspect PLC task timing, network update, output mapping, interlocks, and sequence logic.
- Voltage late or low: inspect the output module, relay, connector, cable drop, common return, and simultaneous loads.
- Current rises slowly: compare resistance, inductance, driver limit, peak-and-hold settings, and coil temperature with approved data.
- Current decays slowly: identify the flyback diode, TVS, Zener, MOV, or integrated suppressor before changing hardware.
- Valve-side pressure late: verify valve function, pilot pressure, contamination, spool freedom, supply pressure, and model-specific response.
- Load-side pressure late: inspect tube volume, fitting bores, manifolds, flow controls, silencers, leaks, and dynamic pressure drop.
- Pressure arrives but motion is late: inspect actuator friction, side load, payload, cushioning, guide alignment, and back pressure.
- Motion completes but input is late: inspect sensor position, response, filtering, wiring, and input-module timing.
Flyback protection is mandatory, but its design changes release behavior. TI explains that higher permitted clamp voltage can shorten inductive current decay; it also raises electrical stress. Use the output-module and valve manufacturer’s approved suppression limits. Never remove a protective component as a permanent speed fix.
If the load-side trace shows pressure collapse rather than delayed switching, use the pneumatic pressure-drop troubleshooting guide and verify the full path. If cylinder travel is the slow stage, move to flow and motion sizing rather than altering the coil.
How Should Worst-Case Time Be Calculated?
Festo’s MHA4 data sheet combines 3.5 ms switching values with ±10% permissible voltage fluctuation and asymmetric switching-time tolerances (Festo MHA4 data sheet, accessed 2026). A worst-case worksheet uses limits at declared conditions, not a sum of unrelated typical values.
For a hard deadline, add non-overlapping upper bounds:
Each term must represent the same operating corner and the same event definition. Don’t combine a warm-coil valve maximum with a room-temperature average line-fill result and call the sum worst case. Evaluate credible corners such as minimum permitted voltage, minimum dynamic pressure, cold start, warm coil, maximum payload, and restricted exhaust.
Root-sum-square treatment can be appropriate for independent random uncertainties under a documented statistical model. It is not a substitute for maximum timing limits, systematic bias, or condition-dependent delays. A safety or quality deadline needs bounded evidence and an agreed guard band.
Keep these inputs in the calculation worksheet and acceptance package:
- Exact valve function: 2/2, 3/2, 5/2, 5/3, monostable, bistable, center state, direct or pilot operated.
- Start event and end event, including signal location, pressure port, threshold, and direction.
- Separate limits for energizing, de-energizing, opening, closing, or changeover where needed.
- Supply and pilot pressure during the event, not only a static regulator setting.
- Downstream volume, tube length and ID, fitting and manifold path, exhaust hardware, and flow-control settings.
- Coil voltage, allowable tolerance, connector electronics, suppression, driver, output module, and duty cycle.
- Medium, filtration, lubrication rule, ambient temperature, medium temperature, and warm-up state.
- Instrument bandwidth, sampling rate, synchronization, filtering, repetition count, and result statistic.
- Whether the requirement is valve-only shifting time, command-to-pressure response, actuator stroke, or sensor arrival.
- Required raw traces, test report, valve serial or lot, firmware or manifold configuration, and calibration records.
Do not accept “fast response” as a worksheet input. Parker, for example, lists less than 30 ms cycling for one miniature valve family, while Festo lists 3.5 ms on and off for a particular fast-switching valve (Parker miniature pneumatic valve, accessed 2026). Different products and tests require different interpretations.
For a replacement inquiry, attach the existing trace and circuit diagram. Include the current valve code, wiring, connector, pressure, tubing, payload, required endpoint, and maximum time. This lets the supplier answer a defined timing problem rather than guess from port size.
Valve Shift Time FAQs: What Should Engineers Calculate?
SMC’s JSY table spans 5 to 42 ms across selected valve configurations at the same 0.5 MPa test pressure, rated voltage, and 20°C coil condition (SMC JSY catalog, accessed 2026). These answers keep valve, line, and machine timing from being treated as one universal number.
Can One Formula Calculate Shift Time for Every Valve?
No. ISO 12238:2023 provides test procedures for 2- and 3-position directional-valve shifting time, while internal magnetic, mechanical, pilot, and sealing details remain model-specific. Use the exact catalog or measured valve response as one timing block. Calculate controller, line-fill, load, and sensor delays separately when their boundaries don’t overlap.
Is Catalog Response Time the Same as Cylinder Stroke Time?
No. A 15 ms catalog valve value may be measured at a defined port and test circuit. Cylinder stroke time also includes available flow, tube and fitting restrictions, chamber volume, pressure, load, friction, cushioning, exhaust, and travel distance. Measure command-to-port pressure and command-to-end sensor separately to locate the difference.
Does Higher Coil Voltage Always Shorten Shift Time?
No. Voltage must remain within the valve and driver ratings. Festo declares ±10% permissible fluctuation for one 24 VDC fast-switching valve, not unlimited overvoltage. Peak-and-hold drivers can accelerate current buildup in a controlled design, but direct overvoltage can overheat the coil or damage electronics.
How Does a Flyback Diode Affect Release Time?
A simple freewheeling diode limits voltage stress but can slow current decay and valve release. In one TI application example, de-actuation was about 10 ms with freewheeling and about 3.5 ms with faster decay. Select a diode, TVS, Zener, or active clamp only within approved voltage and energy limits.
What Instrumentation Is Needed to Validate the Calculation?
Use synchronized electrical and physical measurements: coil voltage or driver command, coil current where practical, a fast pressure transducer at the selected port, and the relevant position or machine sensor. The logger’s interval must be much shorter than the timing limit; one 10 ms sample cannot resolve a 10 ms event reliably.
Sources and Technical References
This analysis uses 9 primary standards or manufacturer documents, including ISO 12238:2023 for shifting time, two ISO 6358 documents for flow context, two SMC catalogs, two TI driver references, and model-specific Festo and Parker data. Product values illustrate method dependence; they are not universal valve limits.
Publisher and author information is available on About Us. Submit technical corrections, source questions, or application details through the contact page so the measured boundary, valve model, circuit, and operating conditions can be reviewed together.
- ISO 12238:2023, Pneumatic fluid power, directional control valves, measurement of shifting time. Retrieved 2026-07-22.
- ISO 6358-1:2013, General rules and steady-state flow test methods. Retrieved 2026-07-22.
- ISO 6358-3:2014, Calculating steady-state flow characteristics of systems. Retrieved 2026-07-22.
- SMC JSY1000/3000/5000 Compact 5-Port Solenoid Valve Catalog. Retrieved 2026-07-22.
- SMC SY3000/5000/7000 5-Port Solenoid Valve Catalog. Retrieved 2026-07-22.
- Texas Instruments DRV110 Solenoid Current Controller Data Sheet. Revised 2018; retrieved 2026-07-22.
- Texas Instruments, Using Motor Drivers to Drive Solenoids. Revised 2022; retrieved 2026-07-22.
- Festo MHA4-MS1H-3/2O-4 Solenoid Valve Data Sheet. Retrieved 2026-07-22.
- Parker Series 11/25/26 Miniature Pneumatic Solenoid Valve Data. Retrieved 2026-07-22.