

To calculate flow coefficient from a liquid test, evaluate each test point with , then check whether the result stays stable across the valid flow range. Record the test fluid, temperature, upstream and downstream pressures, valve position, pipe arrangement, instrument uncertainty, and equation used. Gas data needs a compressible-flow equation, not the liquid shortcut.
A defensible result is more than one number from one convenient reading. It connects a defined test arrangement to traceable measurements, applies the correct model for the fluid and pressure ratio, and reports enough context for another engineer to reproduce the calculation.
Key Takeaways
- Liquid Cv uses flow rate, liquid specific gravity, and pressure drop in a defined unit system.
- Gauge pressure is sufficient for a liquid pressure difference when both gauges use the same reference.
- Gas calculations require absolute pressure, temperature, gas properties, and the correct flow regime.
- Multiple steady test points and a stated uncertainty are more useful than an isolated Cv value.
What Does “Cv from Test Data” Actually Mean?
Flow coefficient (Cv) is an experimentally derived measure of valve flow capacity tied to a stated equation and unit convention. Swagelok explains that valve manufacturers determine Cv by testing with water at several flow rates and arranging straight pipe of the same nominal size so unrelated fitting and pipe changes do not enter the result (Swagelok, accessed 2026).
That definition separates two jobs that are often confused:
- Characterization: Measure flow and pressure under controlled conditions, then derive the valve’s coefficient.
- Sizing: Use a known coefficient in an appropriate liquid or gas equation to predict application flow.
This article is about characterization and data reduction. For the broader selection problem, see what Cv means in pneumatic valve sizing. A test-derived Cv cannot rescue a sizing calculation that uses the wrong gas model, pressure basis, or valve opening.
State whether the test concerns the fully open valve, one direction through a directional valve, or a particular travel position. A control valve may need an entire inherent flow-characteristic curve rather than one rated value. IEC 60534-2-3 covers procedures for determining control-valve flow capacity and related factors, including , , , and (IEC, 2015).
Which Test Standard Should You Use?
Choose the standard from the component and the result you need before building the test. IEC 60534-2-3 and its modified US adoption, ANSI/ISA-75.02.01, address industrial process control-valve capacity testing (ISA, accessed 2026). ISO 6358-1 addresses steady-state compressible-flow characteristics for pneumatic components (ISO, confirmed 2022).
| Test objective | Suitable framework | Typical reported quantities |
|---|---|---|
| Water-based process control-valve capacity | IEC 60534-2-3 or ANSI/ISA-75.02.01 | Flow coefficient and applicable correction or recovery factors |
| Pneumatic component compressible-flow characterization | ISO 6358-1 | Sonic conductance and critical back-pressure ratio |
| Internal comparison or incoming inspection | A documented company method traceable to the relevant standard | Defined test-point Cv, repeatability, and uncertainty |
Do not label a water-test Cv as “ISO 6358 conductance.” The values use different models, dimensions, and reference conditions. If a supplier lists both, each needs its own units and test method. The distinction is developed further in the guide to sonic conductance and critical pressure ratio.
Before collecting data, freeze these conditions:
- Valve model, port size, flow direction, actuation state, and opening or travel.
- Test fluid and its temperature-dependent density or specific gravity.
- Upstream and downstream pipe inside diameter, straight lengths, and pressure-tap locations.
- Pressure, flow, and temperature instrument ranges, calibration status, and acquisition rate.
- Stabilization rule, number of repeated readings, and acceptance criterion.
- Equation, unit convention, and standard to be used in the report.
How Do You Calculate Cv from Liquid Test Data?
For the common US liquid convention, use flow in US gallons per minute, pressure drop in psi, and liquid specific gravity relative to water. Swagelok expresses the liquid relationship as ; for US gpm and psi (Swagelok, accessed 2026). Rearranging gives:
where:
- is the dimensionless numerical flow coefficient under this unit convention.
- is measured liquid flow in US gpm.
- is liquid specific gravity at the test temperature.
- is the measured pressure drop across the defined valve test section in psi.
Suppose a fully open valve passes 12.0 US gpm of water with a 5.0 psi pressure drop. For :
The arithmetic is simple; the test definition carries most of the engineering burden. Confirm that and come from the specified taps, the flow is steady, the valve position is repeatable, and the fluid property matches its measured temperature.
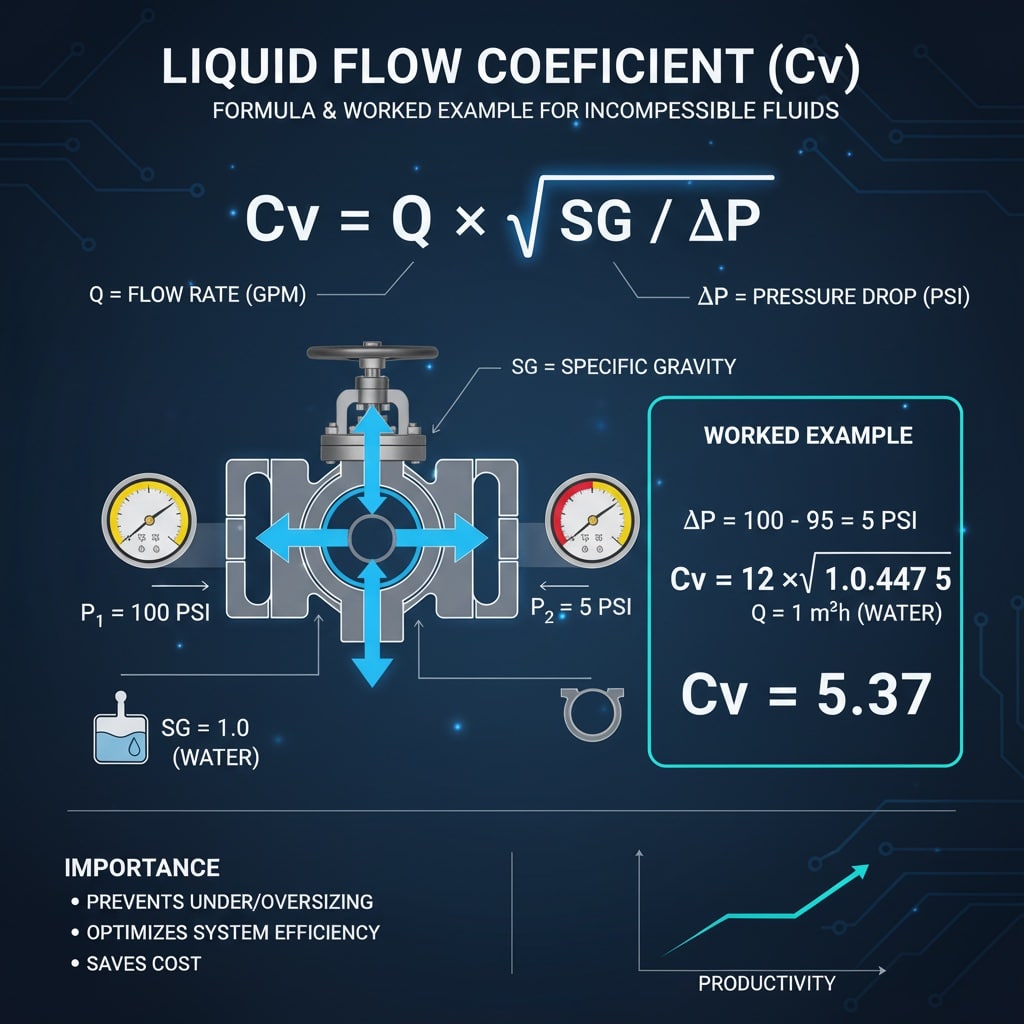
The retained source illustration shows the same liquid example. The local copy removes the article’s dependency on the original WordPress media path.
Gauge pressure readings are acceptable for this liquid calculation if both instruments use the same atmospheric reference, because only their difference enters the equation. Converting both to absolute pressure changes neither nor Cv. This rule does not carry over to gas equations that use pressure ratios or upstream absolute pressure.
For very viscous service, flashing, cavitation, or a piping geometry outside the chosen standard’s validity, the simple turbulent-liquid relationship may need additional factors. See how laminar and turbulent flow affect valve sizing before treating a low-Reynolds-number result as a rated turbulent-flow coefficient.
Checking Liquid Cv Across Multiple Test Points
Several steady test points reveal whether one reported Cv represents the valve and test range. A coefficient that moves systematically with pressure drop may indicate a changing valve position, unsuitable flow regime, temperature drift, cavitation, incorrect fluid properties, poor tap placement, or instrument range problems.
For each accepted point, calculate:
Then report the individual values, mean, spread, and any excluded points with their reasons. Do not average first and then calculate from averaged flow and pressure unless the test method explicitly permits that treatment. The square-root relationship makes those two operations non-equivalent.
An illustrative data-reduction table might look like this:
| Point | Flow | Pressure drop | Specific gravity | Calculated |
|---|---|---|---|---|
| 1 | 7.60 gpm | 2.00 psi | 1.000 | 5.37 |
| 2 | 12.00 gpm | 5.00 psi | 1.000 | 5.37 |
| 3 | 15.18 gpm | 8.00 psi | 1.000 | 5.37 |
These are synthetic values constructed to demonstrate the calculation, not measured product data. Real readings will scatter. The purpose of the table is to make the raw inputs, units, per-point result, and consistency visible instead of presenting an unexplained average.
A stable Cv across multiple pressure drops is also a diagnostic. If drifts while liquid density is stable, investigate the test before assigning the change to the valve. Plotting Cv against flow, valve travel, and Reynolds number can expose a regime change that one headline value hides.
How Do You Quantify Cv Measurement Uncertainty?
Propagate the uncertainties of flow, specific gravity, and differential pressure through the Cv equation. NIST’s law of propagation uses sensitivity coefficients to combine standard uncertainty components, normally by root-sum-square when the inputs are uncorrelated (NIST, accessed 2026).
For the liquid equation, the relative combined standard uncertainty is approximately:
Assume an illustrative test has 1.0% relative standard uncertainty in flow, 0.2% in specific gravity, and 1.0% in differential pressure. Then:
If the lab reports an expanded uncertainty with coverage factor , this simplified example gives about 2.24%. State and the method rather than writing “±2.24%” with no explanation. NIST recommends listing the uncertainty components, how they were evaluated, and the coverage factor used (NIST, accessed 2026).
Differential-pressure uncertainty often deserves special attention at low pressure drop. If is calculated from two separate gauges, combine both pressure uncertainties before inserting into the Cv expression. A dedicated differential-pressure transmitter can produce a better low-range measurement than subtracting two large, similar absolute readings.
ISO published an amendment specifically addressing measurement-uncertainty evaluation for ISO 6358-1 in April 2026 (ISO 6358-1:2013/Amd 2:2026). Pneumatic labs using that standard should cite the applicable edition and amendment in new reports.
Why Does Gas Test Data Need a Different Equation?
Gas density changes as pressure falls, so the liquid Cv equation cannot reduce compressed-air data correctly. A gas result needs upstream and downstream absolute pressure, absolute temperature, gas specific gravity, defined standard-flow conditions, and an equation valid for the observed pressure ratio.
Swagelok separates low-pressure-drop and high-pressure-drop gas relationships. For high pressure drop, its stated relationship is:
Here is absolute upstream pressure, is absolute upstream temperature, is gas specific gravity relative to air, and when is standard cubic feet per minute, pressure is psia, and temperature is °R (Swagelok, accessed 2026).
For 35 SCFM of air, psia, psia, °R, and , the pressure drop exceeds half of , so this high-drop equation applies. Rearranging:
The downstream pressure remains part of deciding which regime applies even though it no longer appears in this simplified high-drop expression. Never substitute psig for psia. Never compare SCFM values unless their standard temperature and pressure definitions match.
For pneumatic component qualification, ISO 6358’s and framework is usually clearer than forcing every result into Cv. The units and reference conditions must accompany sonic conductance; a universal statement such as “ in L/s equals Cv times 24” is not a valid substitute for the standard. Use the pneumatic-valve pressure-drop guide when the practical question is installed-system performance rather than laboratory characterization.
Valve Test Report Requirements
A useful report lets another qualified engineer reconstruct the result without guessing hidden conditions. At minimum, include the following:
- Valve manufacturer, model, serial or sample ID, port size, flow path, orientation, and opening or travel.
- Test standard, procedure revision, date, operator, and laboratory or fixture identity.
- Fluid identity, temperature, density or specific gravity, and viscosity when relevant.
- Upstream pressure, downstream pressure, pressure drop, flow, and temperature for every accepted point.
- Gauge or absolute pressure basis, plus the standard conditions used for gas flow.
- Pipe inside diameter, straight lengths, fittings inside the test section, and pressure-tap locations.
- Instrument model, range, calibration status, resolution, and stated uncertainty.
- Stabilization and sampling rules, repeat count, exclusions, and raw-data file reference.
- Equation, constants, units, corrections, per-point result, aggregate result, scatter, and uncertainty statement.
- Validity limits, anomalies, and whether cavitation, choking, or a flow-regime transition was observed.
A rated Cv should not be detached from the tested flow path. A five-port solenoid valve, for example, may have different capacity from supply to cylinder port and from cylinder port to exhaust. If the application target is a cylinder stroke time, carry the validated flow data into the solenoid-valve stroke-time sizing workflow, which also accounts for tubing, fittings, exhaust, and cylinder volume.
Review checklist for a supplier test sheet
| Question | Acceptable evidence | Warning sign |
|---|---|---|
| What was tested? | Exact model, path, opening, and port size | One Cv applied to every configuration |
| Which fluid model applies? | Liquid or gas equation and units are stated | Liquid square-root formula used for air |
| Are pressures unambiguous? | Tap locations and gauge or absolute basis are stated | “Inlet 90 psi” without basis or location |
| Is the result repeatable? | Multiple points or repeats with visible scatter | One rounded value without raw inputs |
| Is uncertainty reported? | Components, combination method, and coverage factor | An unexplained accuracy percentage |
| Can the calculation be reproduced? | Equation, constants, properties, and reference conditions | Proprietary number with no method |
Valve Cv Test Data FAQs
The following answers cover the decisions most likely to invalidate an otherwise neat calculation. They distinguish a quick engineering check from a standards-based rating test and keep liquid and compressible-gas methods separate.
Can I calculate Cv from a single test point?
Yes, one valid liquid point can produce a numerical Cv, but it cannot demonstrate repeatability or reveal a regime change. Use several steady points across the intended range for characterization. Report individual inputs and results, then explain the averaging and exclusion rules used.
Do liquid pressure readings need to be absolute?
No. The liquid equation uses , so two gauge readings with the same atmospheric reference give the correct difference. Gas equations generally require absolute pressure because density, pressure ratio, and choking decisions depend on pressure relative to vacuum.
Can I use the liquid Cv formula for compressed air?
No. Air is compressible, and its density changes through the valve. Use a gas equation with upstream and downstream absolute pressure, absolute temperature, gas specific gravity, and defined standard-flow conditions. Select the equation only after determining the applicable pressure-drop regime.
Is Cv the same as ISO 6358 sonic conductance?
No. Both describe flow capacity, but they come from different mathematical models and test conventions. ISO 6358 reports sonic conductance and critical back-pressure ratio for compressible-flow components. Do not convert between them with an unexplained universal multiplier.
What Is the Final Rule for a Defensible Cv Result?
Make every reported coefficient traceable to its valve state, test arrangement, raw measurements, physical model, units, and uncertainty. IEC 60534-2-3 defines control-valve capacity test procedures, while ISO 6358-1 addresses pneumatic compressible-flow characteristics. Choosing the relevant framework first prevents a precise calculation from answering the wrong engineering question.
For liquid data, calculate Cv point by point and look for a stable relationship between flow and the square root of pressure drop. For gas data, use absolute conditions and a compressible-flow model valid for the measured pressure ratio. In both cases, preserve the raw data and report the limitations beside the result.