Are you watching your energy bills climb while your pneumatic systems underperform? You’re not alone. In my 15+ years working with industrial pneumatics, I’ve seen companies waste thousands of dollars on inefficient systems. The problem often comes down to a fundamental misunderstanding of pneumatic power calculations.
El cálculo de la potencia neumática es el proceso sistemático de determinar el consumo de energía, la generación de fuerza y la eficiencia en sistemas accionados por aire. Un modelado adecuado incluye la potencia de entrada (energía del compresor), las pérdidas de transmisión y la potencia de salida (trabajo real realizado), lo que permite a los ingenieros identificar ineficiencias y optimizar el rendimiento del sistema.
Last year, I visited a manufacturing facility in Pennsylvania where they were experiencing frequent breakdowns in their rodless cylinder systems. Their maintenance team was puzzled by the inconsistent performance. After applying proper pneumatic power calculations, we discovered they were operating at just 37% efficiency! Let me show you how to avoid similar pitfalls in your operations.
Índice
- Theoretical Power Output: What Equations Drive Accurate Pneumatic Calculations?
- Efficiency Loss Breakdown: Where Does Your Pneumatic Energy Actually Go?
- Energy Recovery Potential: How Much Power Can You Reclaim from Your System?
- Conclusión
- FAQs About Pneumatic Power Calculations
Theoretical Power Output: What Equations Drive Accurate Pneumatic Calculations?
Understanding the theoretical maximum power your pneumatic system can deliver is the foundation for all optimization efforts. These equations provide the benchmark against which actual performance is measured.
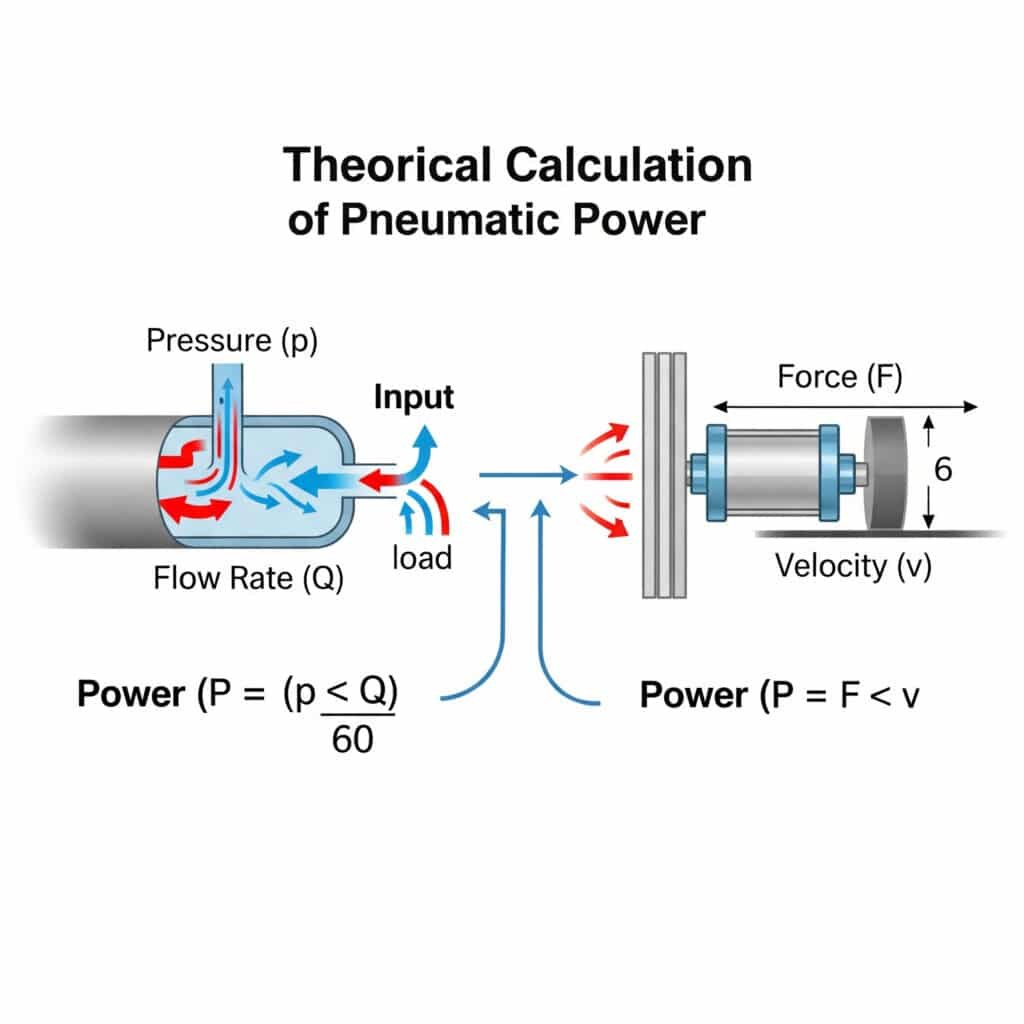
The theoretical power output of a pneumatic system can be calculated using the equation P = (p × Q)/60, where P is power in kilowatts, p is pressure in bar, and Q is flow rate in m³/min. For linear actuators like rodless cylinders, power equals force multiplied by velocity (P = F × v), where force is pressure multiplied by effective area.

I remember consulting for a food processing equipment manufacturer in Ohio who couldn’t understand why their pneumatic systems required such large compressors. When we applied the theoretical power equations, we discovered their system design required twice the power they had initially calculated. This simple mathematical oversight was costing them thousands in operational inefficiencies.
Core Pneumatic Power Equations
Let’s break down the essential equations for different components:
For Compressors
The input power required by a compressor can be calculated as:
P₁ = (Q × p × ln(p₂/p₁)) / (60 × η)
Dónde:
- P₁ = Input power (kW)
- Q = Air flow rate (m³/min)
- p₁ = Inlet pressure (bar absolute)
- p₂ = Outlet pressure (bar absolute)
- η = Compressor efficiency
- ln = Natural logarithm1
For Linear Actuators (Including Rodless Cylinders)
The output power of a linear actuator is:
P₂ = F × v
Dónde:
- P₂ = Output power (W)
- F = Force (N) = p × A
- v = Velocity (m/s)
- p = Operating pressure (Pa)
- A = Effective area (m²)
Factors Affecting Theoretical Calculations
| Factor | Impact on Theoretical Power | Adjustment Method |
|---|---|---|
| Temperatura | 1% change per 3°C | Multiply by (T₁/T₀) |
| Altitude | ~1% per 100m above sea level | Adjust for atmospheric pressure |
| Humedad | Up to 3% at high humidity | Apply vapor pressure correction |
| Gas Composition | Varies with contaminants | Use specific gas constants |
| Duración del ciclo | Affects average power | Calculate duty cycle factor |
Advanced Power Modeling Considerations
Beyond the basic equations, several factors require deeper analysis:
Isothermal vs. Adiabatic Processes
Real pneumatic systems operate somewhere between:
- Isothermal process2: Temperature remains constant (slower processes)
- Adiabatic process: No heat transfer (rapid processes)
For most industrial applications with rodless cylinders, the process is closer to adiabatic during operation, requiring the use of the adiabatic equation:
P = (Q × p₁ × (κ/(κ-1)) × [(p₂/p₁)^((κ-1)/κ) – 1]) / 60
Where κ is the heat capacity ratio (approximately 1.4 for air).
Dynamic Response Modeling
For high-speed applications, dynamic response becomes critical:
- Acceleration phase: Higher power requirements during speed changes
- Steady-state phase: Consistent power based on standard equations
- Deceleration phase: Potential for energy recovery
Practical Application Example
For a double-acting rodless cylinder with:
- Bore diameter: 40mm
- Operating pressure: 6 bar
- Stroke length: 500mm
- Cycle time: 2 seconds
The theoretical power calculation would be:
- Force = Pressure × Area = 6 × 10⁵ Pa × π × (0.02)² m² = 754 N
- Velocity = Distance/Time = 0.5m / 1s = 0.5 m/s (assuming equal extend/retract time)
- Power = Force × Velocity = 754 N × 0.5 m/s = 377 W
This represents the theoretical maximum output power, before accounting for any system inefficiencies.
Efficiency Loss Breakdown: Where Does Your Pneumatic Energy Actually Go?
The gap between theoretical and actual pneumatic power is often shocking. Understanding exactly where energy is lost helps prioritize improvement efforts.
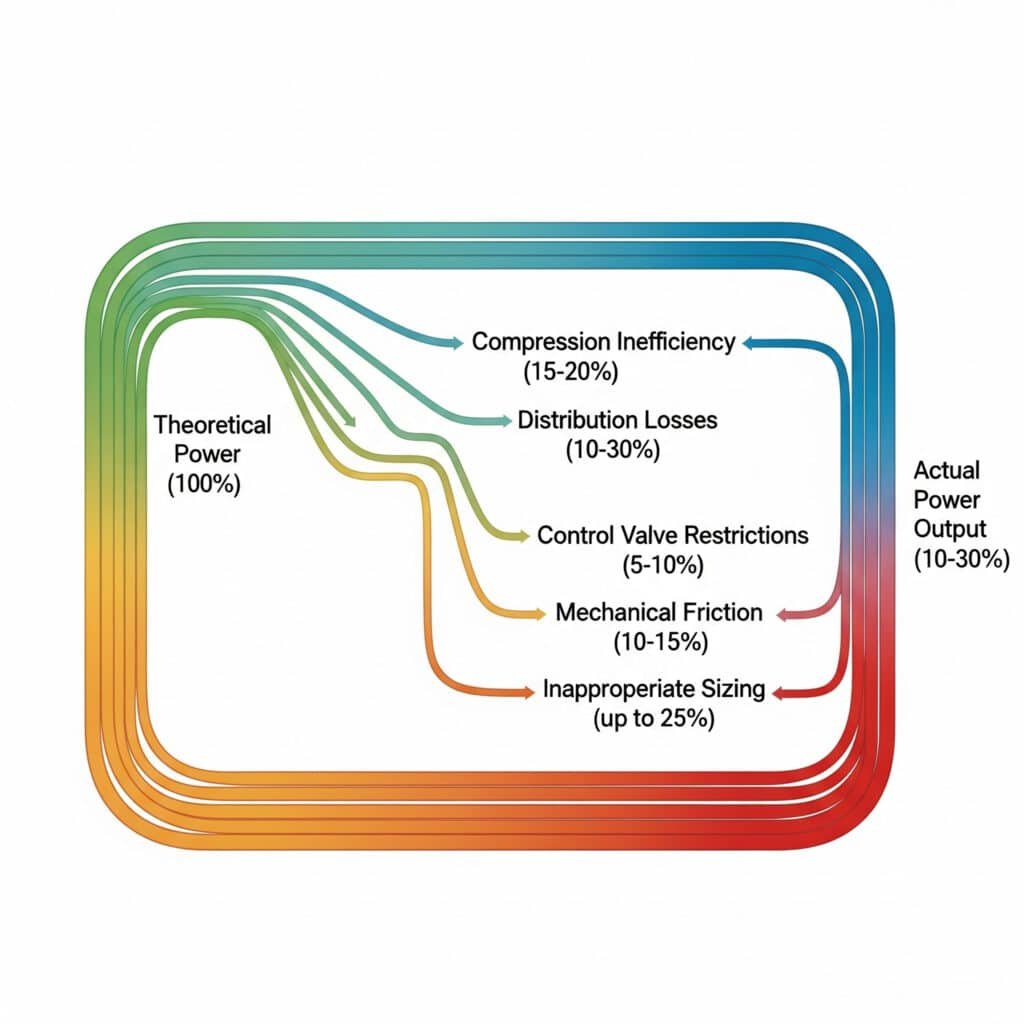
Efficiency losses in pneumatic systems typically reduce actual power output to 10-30% of theoretical calculations. Major loss categories include compression inefficiency (15-20%), distribution losses (10-30%), control valve restrictions (5-10%), mechanical friction (10-15%), and inappropriate sizing (up to 25%), all of which can be systematically addressed.

During an energy audit at a manufacturing plant in Toronto, we discovered their pneumatic rodless cylinder system was operating at just 22% efficiency. By mapping each loss source, we developed a targeted improvement plan that doubled efficiency without major capital investment. The plant manager was amazed that such significant savings came from addressing seemingly minor issues.
Comprehensive Efficiency Loss Mapping
To truly understand your system, each loss must be quantified:
Generation Losses (Compressor)
| Loss Type | Typical Range | Primary Causes |
|---|---|---|
| Motor Inefficiency | 5-10% | Motor design, age, maintenance |
| Compression Heat | 15-20% | Thermodynamic limitations |
| Friction | 3-8% | Mechanical design, maintenance |
| Leakage | 2-5% | Seal quality, maintenance |
| Control Losses | 5-15% | Inappropriate control strategies |
Distribution Losses (Piping Network)
| Loss Type | Typical Range | Primary Causes |
|---|---|---|
| Caída de presión | 3-10% | Pipe diameter, length, bends |
| Leakage | 10-30% | Connection quality, age, maintenance |
| Condensation | 2-5% | Inadequate drying, temperature variation |
| Inappropriate Pressure | 5-15% | Excessive system pressure for application |
End-Use Losses (Actuators)
| Loss Type | Typical Range | Primary Causes |
|---|---|---|
| Valve Restrictions | 5-10% | Undersized valves, complex flow paths |
| Mechanical Friction | 10-15% | Seal design, lubrication, alignment |
| Inappropriate Sizing | 10-25% | Oversized/undersized components |
| Exhaust Flow | 10-20% | Backpressure, restricted exhaust |
Measuring Real-World Efficiency
To calculate actual system efficiency:
Efficiency (%) = (Actual Output Power / Theoretical Input Power) × 100
For example, if your compressor consumes 10 kW of electrical power, but your rodless cylinder delivers only 1.5 kW of mechanical work:
Efficiency = (1.5 kW / 10 kW) × 100 = 15%
Efficiency Optimization Strategies
Based on my experience with hundreds of pneumatic systems, here are the most effective improvement approaches:
For Generation Efficiency
- Optimal Pressure Selection: Every 1 bar reduction saves approximately 7% energy
- Variable Speed Drives3: Match compressor output to demand
- Heat Recovery: Capture compression heat for facility use
- Regular Maintenance: Particularly air filters and intercoolers
For Distribution Efficiency
- Leak Detection and Repair4: Often delivers 10-15% immediate savings
- Pressure Zoning: Provide different pressure levels for different applications
- Pipe Sizing Optimization: Minimize pressure drop through proper sizing
- Short Circuit Elimination: Ensure air takes most direct path to point of use
For End-Use Efficiency
- Proper Component Sizing: Match actuator size to actual force requirements
- Valve Positioning: Locate valves close to actuators
- Recuperación del aire de escape: Capture and reuse exhaust air where possible
- Friction Reduction: Proper alignment and lubrication of moving components
Energy Recovery Potential: How Much Power Can You Reclaim from Your System?
Most pneumatic systems vent valuable compressed air to atmosphere after use. Capturing and reusing this energy represents a significant opportunity for efficiency improvement.
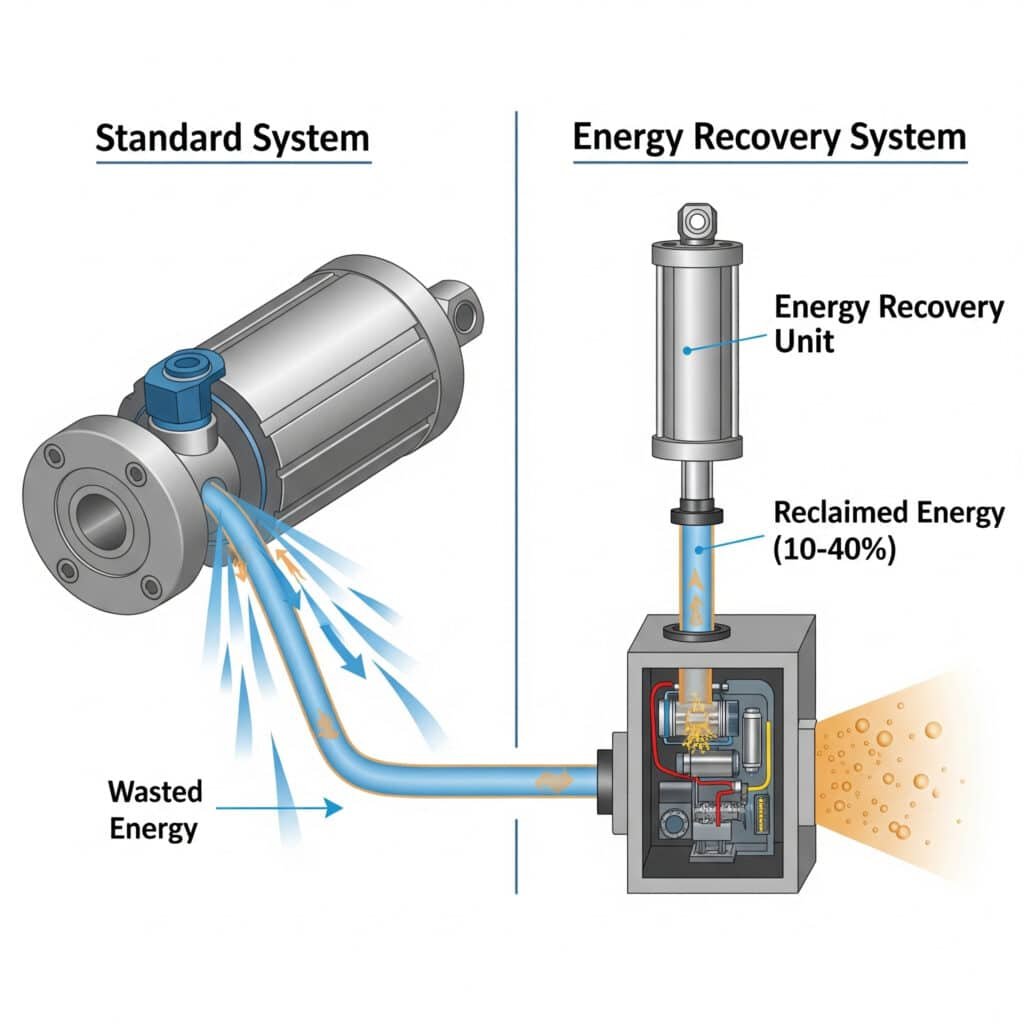
Energy recovery in pneumatic systems can reclaim 10-40% of input energy through technologies like closed-loop circuits, exhaust air recycling, and pressure intensification. The recovery potential depends on cycle characteristics, load profiles, and system design, with the highest gains in systems with frequent stopping and consistent load patterns.

I recently worked with a packaging equipment manufacturer in Wisconsin to implement energy recovery on their high-speed rodless pneumatic cylinder lines. By capturing exhaust air and reusing it for return strokes, we reduced their compressed air consumption by 27%. The system paid for itself in just 7 months—much faster than the 18 months they had initially projected.
Energy Recovery Technologies Assessment
Different recovery approaches offer varying benefits:
Closed-Loop Circuit Design
This approach recirculates air rather than exhausting it:
- Working Principle: Air from extending stroke powers retracting stroke
- Recovery Potential: 20-30% of system energy
- Mejores aplicaciones: Balanced loads, predictable cycles
- Complejidad de la aplicación: Moderate (requires system redesign)
- ROI Timeframe: Typically 1-2 years
Exhaust Air Recycling
Capturing exhaust air for secondary applications:
- Working Principle: Route exhaust air to lower-pressure applications
- Recovery Potential: 10-20% of system energy
- Mejores aplicaciones: Mixed pressure requirements, multi-zone facilities
- Complejidad de la aplicación: Low to moderate (additional piping required)
- ROI Timeframe: Often under 1 year
Pressure Intensification
Using exhaust air to boost pressure for other operations:
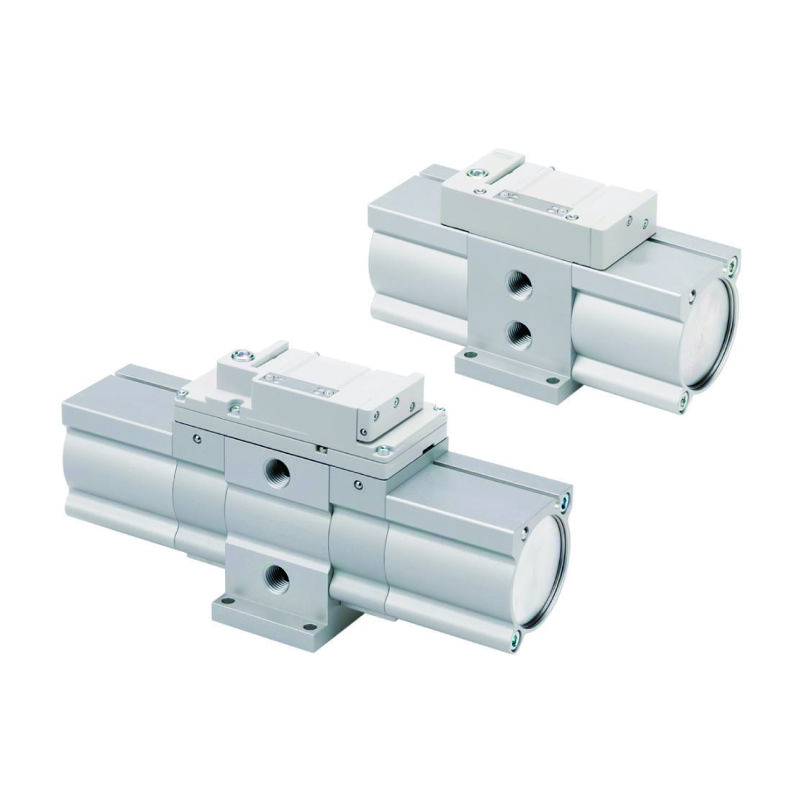
- Working Principle: Exhaust air drives pressure booster5 for high-pressure needs
- Recovery Potential: 15-25% for appropriate applications
- Mejores aplicaciones: Systems with both high and low pressure requirements
- Complejidad de la aplicación: Moderate (requires pressure boosters)
- ROI Timeframe: 1-3 years depending on usage profile
Energy Recovery Potential Calculation
To estimate recovery potential for your system:
Recoverable Energy (%) = Exhaust Energy × Recovery Efficiency × Utilization Factor
Dónde:
- Exhaust Energy = Mass of air × Specific energy at exhaust conditions
- Recovery Efficiency = Technology-specific efficiency (typically 40-70%)
- Utilization Factor = Percentage of exhaust air that can be practically utilized
Case Study: Rodless Cylinder Energy Recovery
For a manufacturing line using magnetic rodless cylinders:
| Parámetro | Before Recovery | After Recovery | Savings |
|---|---|---|---|
| Air Consumption | 850 L/min | 620 L/min | 27% |
| Energy Cost | $12,400/year | $9,050/year | $3,350/year |
| Eficiencia del sistema | 18% | 24.6% | 6.6% improvement |
| Duración del ciclo | 2.2 seconds | 2.2 seconds | No change |
| Coste de aplicación | – | $19,500 | 5.8 month payback |
Factors Affecting Recovery Potential
Several variables determine how much energy you can practically recover:
Cycle Characteristics
- Duty Cycle: Higher recovery potential with frequent cycling
- Dwell Time: Longer dwell times reduce recovery opportunities
- Speed Requirements: Very high speeds may limit recovery options
Load Profile
- Load Consistency: Consistent loads offer better recovery potential
- Inertial Effects: High inertia systems store recoverable energy
- Direction Changes: Frequent reversals increase recovery potential
System Design Constraints
- Space Limitations: Some recovery systems require additional components
- Temperature Sensitivity: Recovery systems may affect operating temperature
- Control Complexity: Advanced recovery requires sophisticated controls
Conclusión
Mastering pneumatic power calculations through theoretical modeling, efficiency loss analysis, and energy recovery assessment can transform your system performance. By applying these principles, you can reduce energy consumption, extend component life, and improve operational reliability—all while cutting costs significantly.
FAQs About Pneumatic Power Calculations
¿Hasta qué punto son precisos los cálculos teóricos de la potencia neumática?
Los cálculos teóricos suelen ofrecer una precisión de 85-95% cuando se tienen en cuenta adecuadamente todas las variables. Las principales fuentes de discrepancia son las simplificaciones de los modelos termodinámicos, las desviaciones del comportamiento real del gas y los efectos dinámicos no recogidos en las ecuaciones de estado estacionario. Para la mayoría de las aplicaciones industriales, estos cálculos proporcionan una precisión suficiente para el diseño y la optimización del sistema.
What’s the average efficiency of industrial pneumatic systems?
La eficiencia media de los sistemas neumáticos industriales oscila entre 10% y 30%, y la mayoría de los sistemas funcionan con una eficiencia de entre 15 y 20%. Esta baja eficiencia es el resultado de múltiples pasos de conversión: eléctrico a mecánico en el motor, mecánico a neumático en el compresor y neumático de nuevo a mecánico en los actuadores, con pérdidas en cada etapa.
¿Cómo puedo determinar si la recuperación de energía es económicamente viable para mi sistema?
Calcule el ahorro potencial multiplicando el coste energético anual del aire comprimido por el porcentaje de recuperación estimado (normalmente 10-30%). Si este ahorro anual dividido por el coste de implantación da un periodo de amortización inferior a dos años, la recuperación suele ser viable. Los sistemas con ciclos de trabajo elevados, carga predecible y costes de aire comprimido superiores a $10.000 anuales son los mejores candidatos.
What’s the relationship between pressure, flow, and power in pneumatic systems?
La potencia (P) en un sistema neumático es igual a la presión (p) multiplicada por el caudal (Q) dividido por una constante de tiempo: P = (p × Q)/60 (con P en kW, p en bar y Q en m³/min). Esto significa que la potencia aumenta linealmente con la presión y el caudal. Sin embargo, el aumento de presión requiere exponencialmente más potencia del compresor, por lo que la reducción de presión suele ser más eficiente que la reducción de caudal.
¿Cómo afecta el tamaño del cilindro al consumo de energía en los sistemas neumáticos sin vástago?
Cylinder size directly impacts power consumption through its effective area. Doubling the bore diameter quadruples the area and thus quadruples the air consumption and power requirement at the same pressure. However, larger cylinders can often operate at lower pressures for the same force output, potentially saving energy. Proper sizing involves matching the cylinder area to the actual force requirements rather than defaulting to oversized components.
-
Provides a clear explanation of the natural logarithm (ln), a mathematical function crucial for accurately calculating the work done during isothermal compression in pneumatic systems. ↩
-
Details the differences between isothermal (constant temperature) and adiabatic (no heat transfer) processes, which are the two theoretical extremes used to model gas compression and expansion in thermodynamics. ↩
-
Explains the operational principles of Variable Speed Drives (VSDs), a key technology for improving compressor efficiency by adjusting motor speed to precisely match fluctuating air demand. ↩
-
Provides practical information on various techniques and tools used for finding air leaks in industrial piping, a critical maintenance activity for reducing energy waste in pneumatic systems. ↩
-
Describes the mechanics of a pressure intensifier (or booster), a device that uses a large-area piston driven by low-pressure air to generate higher pressure with a smaller piston, enabling energy recovery. ↩


