

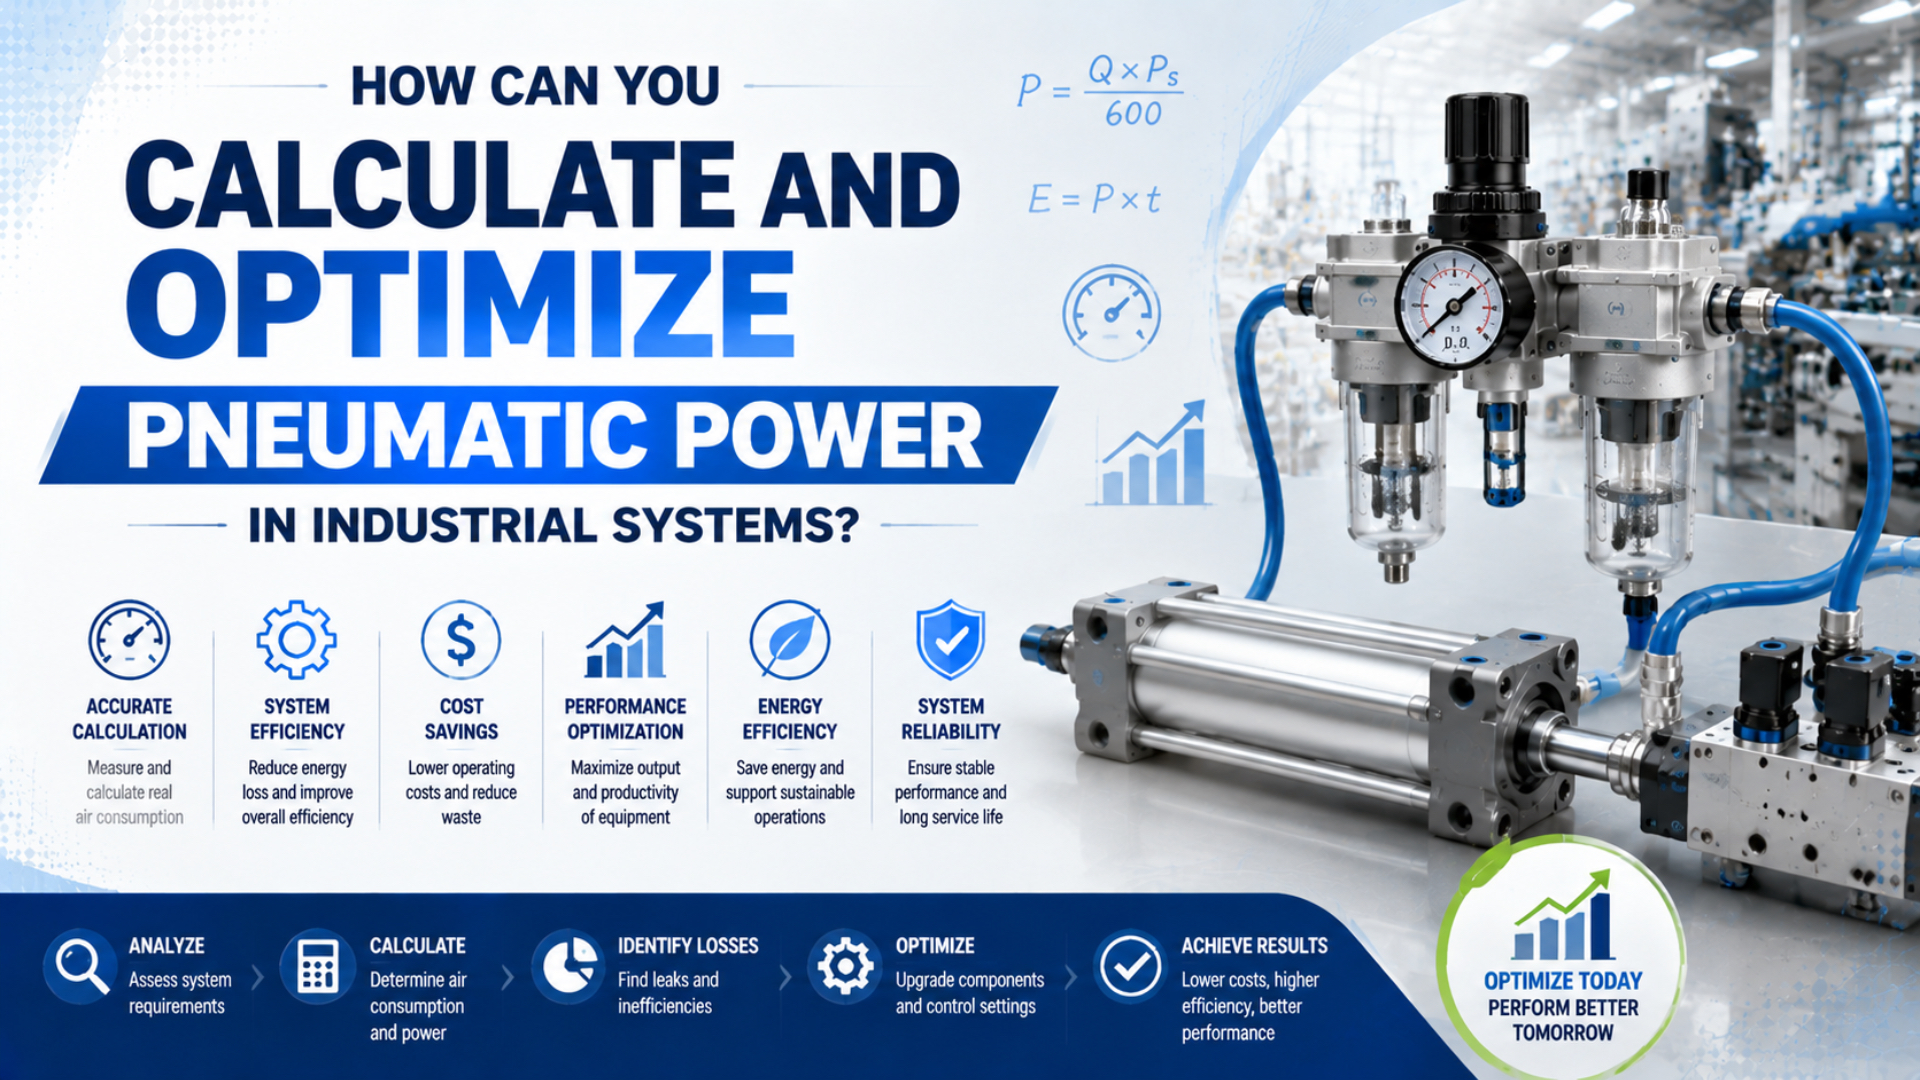
Pneumatic power is an energy-transfer rate whose calculation changes with the measurement boundary. A cylinder’s instantaneous mechanical output, a plant’s reference-air demand, and a compressor package’s electrical input are different quantities. Use force and velocity at the actuator, measured reference flow for air demand, and ISO 1217 package data or a wattmeter for compressor input.
The reliable optimization method is equally direct: record power, pressure, flow, temperature, production, and machine state on the same timeline. Then change one constraint, repeat the same operating window, and compare normalized energy rather than isolated gauge readings.
Key Takeaways
- Separate the 3 boundaries: electrical input, reference-air flow, and useful mechanical output.
- Use only at the actuator boundary.
- Convert measured flow to electrical demand with compressor-specific performance data.
- Verify improvements with synchronized before-and-after measurements under equivalent production conditions.
What Does “Pneumatic Power” Mean at Each Boundary?
The U.S. Department of Energy recommends measuring power, pressure, flow, and temperature when establishing a compressed-air baseline. Those measurements belong to different system locations, so one pressure-flow equation cannot describe the whole chain. Label every result as compressor electrical input, delivered reference-air rate, chamber power, or useful load output (DOE Sourcebook, accessed 2026).
The boundary determines what the number can prove:
| Boundary | Defensible quantity | Preferred evidence | Common mistake |
|---|---|---|---|
| Compressor package | electrical input power or energy | three-phase power meter; ISO 1217 data sheet | estimating input from discharge pressure alone |
| Plant or machine feed | reference-air volume or rate | calibrated flow meter with stated reference conditions | mixing actual volume with standard or free-air volume |
| Cylinder chamber | pressure-volume behavior | synchronized port pressure and piston position | treating static regulator pressure as dynamic chamber pressure |
| Machine load | useful force, work, or power | load cell, displacement, velocity, cycle state | calling theoretical piston force useful load force |
ISO 4414 covers pneumatic machinery systems and their safety and energy-efficiency requirements, but it excludes the compressor and typical factory distribution system (ISO 4414, accessed 2026). ISO 1217 addresses compressor acceptance testing for flow and power (ISO 1217, confirmed 2021). A complete audit may therefore use both scopes without pretending they are interchangeable.
The most important line in a pneumatic power worksheet is often the boundary label beside the units. “12 kW,” “1.8 m³/min,” and “220 W” can all be correct for one machine at the same moment, yet none can replace the others.
How Do You Calculate Useful Cylinder Power?
Useful mechanical power is load force multiplied by load velocity at the actuator boundary. For scale, SMC’s pressure-area method gives 754 N for an ideal 40 mm bore at 0.6 MPa. Start with the selected direction and measured load, not nominal compressor pressure (SMC cylinder selection guide, accessed 2026).
Here, is useful mechanical power in watts, is useful load force in newtons, and is load velocity in metres per second. If the useful force changes with position, integrate force over the working stroke:
For one repeatable machine cycle:
Do not substitute theoretical piston force for without saying so. Theoretical extension force at gauge pressure and bore diameter is:
Actual useful force may be lower because the opposing chamber has pressure, seals and guides create friction, the load accelerates, gravity acts along the motion axis, or the cylinder pressure falls during high flow. The cylinder theoretical-force guide establishes the ideal starting point; the force-loss guide shows how to use both chamber pressures.
Worked example: instantaneous power is not cycle-average power
Consider a 40 mm bore cylinder supplied at 6 bar gauge. Ignoring rod area, opposing pressure, friction, and acceleration, the ideal extension force is:
At 0.5 m/s, the gross instantaneous piston-power reference is:
Suppose an independently measured useful resisting load is 500 N during a one-second, 0.5 m extension. The useful work and power during extension are:
If the complete cycle lasts 2 seconds and the return stroke performs no defined useful work, the cycle-average useful output is 125 W. These are illustrative boundary calculations, not a measured efficiency rating. A real test must record force, position, and time through both strokes.
From Instantaneous Power to Energy per Cycle
ISO 4376:2024 defines a cycle-energy test method for electrically driven compressors, showing why a dynamic duty cannot be represented by one steady power value. The same time-accounting principle applies at the machine boundary: integrate useful work and electrical input over identical cycles, while keeping the compressor standard’s scope separate from actuator testing (ISO 4376, 2024).
A cylinder may draw air during filling, do useful work during part of the stroke, dissipate kinetic energy during cushioning, dwell under pressure, and exhaust without useful output. Record these states separately:
- Fill and acceleration.
- Constant-speed working travel.
- Deceleration and cushioning.
- Pressurized dwell.
- Return stroke.
- Idle or blocked production.
For matched production cycles, define boundary efficiency as:
The numerator and denominator must cover the same interval and production state. If one compressor feeds several machines, the denominator cannot be assigned to one cylinder without submetering or a documented allocation method. Reporting joules per accepted part is often more useful than reporting a plant-wide percentage.
The cylinder air-consumption guide explains cap-end and rod-end volume calculations. Use the Air Consumption Calculator for preliminary demand estimates, then replace assumptions with measured flow when verifying savings.
Why Is Pressure Times Flow Not One Universal Power Formula?
Flow meters commonly report 4 different volume bases: actual volume, free-air delivery, standard cubic feet, or normalized cubic metres. DOE warns users to check the reference conditions. Pressure multiplied by a mismatched reference-air flow is not compressor electrical input, and it is not automatically recoverable actuator work (DOE Sourcebook, accessed 2026).
At one location and instant, pressure times volumetric flow has power dimensions:
This expression is useful only when and describe the same thermodynamic state and the intended boundary is stated. For example, 1 bar equals 100 kPa, so pressure in bar multiplied by flow in m³/min requires a factor of to produce kilowatts:
Even then, is not the measured compressor package input. Compression heats the air, real compressors have losses, controls consume power at partial load, dryers and fans may add demand, and a reference-flow value may describe air at inlet conditions rather than discharge volume. Thermodynamic compressor models can support design studies, but plant optimization should use verified package data or direct electrical measurement.
Never write with pressure in bar and claim the result is kilowatts. That version is missing a factor of 100. Also avoid multiplying gauge pressure by free-air flow and labeling the product “available pneumatic power” without defining the reference state.
How Do You Measure Compressor Input and Specific Power?
Compressor specific power is package electrical input per unit of flow at a stated pressure. One CAGI sample reports 36.12 kW for 175.0 acfm, or 20.64 kW per 100 acfm. CAGI’s verification program uses ISO 1217 and total package input, not motor nameplate power alone (CAGI, accessed 2026).
Define package specific power as:
is total package electrical input and is free-air delivery at the stated reference condition. Keep the units attached. A common North American presentation is kW per 100 acfm.
One CAGI sample sheet lists 175.0 acfm at 125 psig with 36.12 kW total package input. Its specific power is:
That matches the published value. The same sheet lists 9.1 kW at zero flow, demonstrating why a compressor that is unloaded or idling can still consume substantial power (CAGI sample data sheet, accessed 2026).
For a first cost estimate using average reference flow:
Use compatible flow units in and . Here, is annual operating time and is the applicable energy price. Demand charges, taxes, compressor sequencing, maintenance, cooling, and dryer energy may require separate terms.
For direct measurement, use a true three-phase power meter or a wattmeter suitable for the compressor drive. DOE recommends measuring full-load and no-load power, not inferring both from motor nameplate data. On a multi-compressor station, record each package’s state because sequencing can move load from an efficient machine to an inefficient one.
Build a Synchronized Baseline Before Optimizing
DOE links 4 baseline streams: airflow, pressure, electrical energy, and production. A defensible comparison therefore needs a common clock and a representative operating period. One overnight leak reading, compressor display screenshot, or regulator gauge cannot prove annual energy or per-part savings (DOE Sourcebook, accessed 2026).
At minimum, log:
- Compressor package kW and control state.
- Reference-air flow and the meter’s stated reference conditions.
- Compressor discharge, receiver, main-header, machine-inlet, and critical actuator-port pressure.
- Air and ambient temperature where they affect meter correction or equipment behavior.
- Machine cycle command, cylinder position, and accepted production count.
- Planned downtime, blocked production, purge use, blow-off use, and shift changes.
In our experience, when a pressure complaint disappears during a maintenance test, the missing variable is often concurrent demand. A useful trace includes the other machines, blow-off events, and compressor transitions that shared the header during production. Repeating the test with only one cylinder moving can hide the actual constraint.
Choose a normalization denominator before collecting data. Useful choices include kWh per accepted part, reference litres per cycle, kWh per production hour at a specified rate, or joules of useful work per cycle. Record rejected parts separately so an apparent energy improvement is not created by lower output.
Which Improvements Should You Test First?
DOE notes that higher discharge pressure can increase compressor energy and unregulated demand, but the effect depends on compressor type, operating point, and the share of unregulated loads. Around 100 psig at full output, certain compressors use about 1% more energy for each 2 psi increase, so test pressure changes instead of applying a universal percentage (DOE Sourcebook, accessed 2026).
Use the baseline to rank changes in this order:
- Remove inappropriate demand. Replace continuous open blowing, cooling, vacuum generation, or abandoned equipment demand when a lower-energy method meets the requirement.
- Repair leaks and idle consumption. Measure the isolated or nonproduction condition, repair named leak points, then repeat the same test. The internal-leakage guide covers actuator-side paths.
- Reduce pressure drop. Measure pressure at several points during peak demand. Dirty filters, undersized tubing, restrictive fittings, manifolds, valves, and silencers should be corrected before raising compressor pressure. Use the pressure-drop troubleshooting guide for the distribution calculation.
- Lower pressure only to a verified limit. Confirm force, speed, cushioning, control stability, and product quality at the critical actuator. A regulator setting is not a complete pressure test.
- Right-size end-use components. Match cylinder bore to force, valve flow to stroke time, and tubing volume to the response requirement. The bore-size and air-consumption guide shows why an oversized bore repeats its penalty every cycle.
- Optimize compressor sequencing and part load. Compare verified specific power across the actual operating range. An unloaded package can consume power while delivering no useful flow.
- Evaluate recovery after demand is controlled. Recovered heat or reused exhaust should not conceal a leak, excessive pressure, or avoidable air demand.
The decision metric should reflect the constraint. For a slow cylinder, compare dynamic port pressure, velocity, and flow. For compressor energy, compare kWh per accepted part. For an oversize cylinder, compare required load force with measured chamber pressure and air per cycle. One global “efficiency” percentage is too blunt for all three.
Energy Recovery Needs a Separate Boundary
DOE states that 80% to 93% of the electrical energy used by an industrial air compressor is converted to heat, and a properly designed heat-recovery system can recover 50% to 90% of the available thermal energy. These figures describe compressor heat recovery, not cylinder exhaust-air reuse (DOE Sourcebook, accessed 2026).
Keep the opportunities separate:
| Recovery route | Input boundary | Useful output | Main verification |
|---|---|---|---|
| Compressor heat recovery | compressor package electrical input and rejected heat | useful hot air or water | thermal flow, temperatures, operating hours, displaced heating energy |
| Exhaust-air reuse | actuator exhaust at a measured pressure and flow | a defined lower-pressure task | receiver pressure, back pressure, air quality, timing, displaced primary air |
| Regeneration or expansion device | pressurized gas at stated conditions | shaft or electrical output | inlet and outlet state, device output, controls, duty cycle |
Define the recovery fraction dimensionlessly:
Do not write “recoverable energy percent equals exhaust energy times efficiencies.” The right-hand side would still have energy units unless divided by an energy reference. For exhaust-air reuse, also check whether added back pressure reduces cylinder force, speed, or cushioning stability. A receiver, check valve, pressure regulator, relief protection, filtration, and fail-safe bypass may be needed.
Heat-recovery economics depend on simultaneous heat demand. Hot compressor-room air has little value when the building needs no heat. Exhaust reuse depends on a compatible lower-pressure demand occurring at the right time. Measure displaced electrical or compressed-air demand rather than assigning a generic recovery percentage.
How Do You Verify Savings and Payback?
DOE connects 3 compressed-air measurements, flow, pressure, and energy, with production data because a lower utility bill can result from lower output or schedule changes. Verification should repeat the baseline boundary, normalize to accepted production, and document meter accuracy, reference conditions, and compressor control changes (DOE Sourcebook, accessed 2026).
Use this verification sequence:
- Freeze the comparison boundary, product mix, and acceptance metric.
- Repeat the same measurement duration or a statistically comparable production window.
- Compare kWh, reference-air volume, pressure margin, cycle time, and accepted parts.
- Confirm that compressor sequencing, weather-sensitive cooling, shutdowns, and unrelated production changes are accounted for.
- Recheck after several weeks to confirm the improvement persists.
Annual cost reduction is the difference between comparable baseline and post-change energy cost:
Simple payback is:
Keep the time units consistent. If a project costs 19,500 currency units and verified annual savings are 3,350, simple payback is about 5.82 years, or about 69.9 months. It is not 5.8 months. Include maintenance, calibration, finance, downtime, rebates, and demand charges when the decision requires a lifecycle analysis rather than simple payback.
A flow reduction does not guarantee an equal electrical-energy reduction. The compressor’s control method, storage, pressure band, leakage, minimum power, and sequencing determine how the package responds. Verify at the electrical meter. The CAGI sample’s 9.1 kW zero-flow input is a practical warning against assuming perfect proportionality.
Pneumatic Power FAQs
These answers preserve the 3 measurement boundaries used throughout the guide. ISO 1217 supplies compressor flow-and-power test context, ISO 4414 addresses pneumatic machinery systems, and DOE recommends synchronized power, pressure, flow, temperature, and production data for baselines. None establishes one universal pneumatic-system efficiency percentage (ISO 1217, confirmed 2021).
What is the correct formula for pneumatic power?
At a linear actuator’s useful-load boundary, instantaneous mechanical power is load force multiplied by load velocity. At the compressor boundary, use measured package electrical input or verified ISO 1217 performance data. Pressure times flow is meaningful only when pressure, volumetric flow state, units, and thermodynamic boundary are explicitly consistent.
Can I calculate compressor electrical power from pressure and flow?
Not accurately from discharge pressure and reference-air flow alone. Compression path, temperature, efficiency, motor and fan losses, controls, inlet conditions, and part-load behavior affect package input. Use a suitable three-phase power meter or the selected compressor’s verified ISO 1217 data at the relevant pressure and operating point.
What is a good efficiency for an industrial pneumatic system?
There is no defensible universal percentage for every plant and machine. Define the numerator, denominator, time interval, production state, and included equipment first. Useful metrics include kWh per accepted part, reference litres per cycle, cylinder work per cycle, compressor specific power, pressure margin, and leakage during a controlled nonproduction test.
Does lowering pressure always save the same percentage of energy?
No. DOE’s pressure-energy guidance is conditional on compressor type and operating point, while unregulated demand adds a separate effect. Lower the setpoint only after measuring pressure at the critical end use during peak flow and confirming force, speed, cushioning, control stability, and product quality across relevant operating conditions.
How should I compare two pneumatic optimization projects?
Compare verified annual energy reduction, production performance, reliability risk, implementation cost, and persistence using the same baseline boundary. A leak repair, pipe change, pressure reduction, cylinder resize, and heat-recovery project affect different measurements. Normalize results to accepted production and calculate payback from verified electrical or displaced-energy savings, not assumed air-flow percentages.
Sources and technical references
- U.S. Department of Energy, Improving Compressed Air System Performance: A Sourcebook for Industry, baseline measurement, pressure effects, compressor power measurement, and heat recovery. Accessed 2026-07-27.
- U.S. Department of Energy, Compressed Air Systems, industrial compressed-air assessment resources. Accessed 2026-07-27.
- CAGI Performance Verification, ISO 1217 test context, specific power, isentropic efficiency, and standardized data sheets. Accessed 2026-07-27.
- CAGI Sample Rotary Compressor Data Sheet, 175.0 acfm, 36.12 kW package input, 20.64 kW per 100 acfm, and zero-flow power example. Accessed 2026-07-27.
- ISO 1217:2009, displacement-compressor acceptance testing for flow and power. Confirmed 2021.
- ISO 4376:2024, cycle-energy requirement test method for electrically driven compressors.
- ISO 4414:2010, pneumatic fluid power system safety and energy-efficiency scope.
- SMC Cylinder Selection, effective areas and theoretical extension/retraction force. Accessed 2026-07-27.