

Measure first.
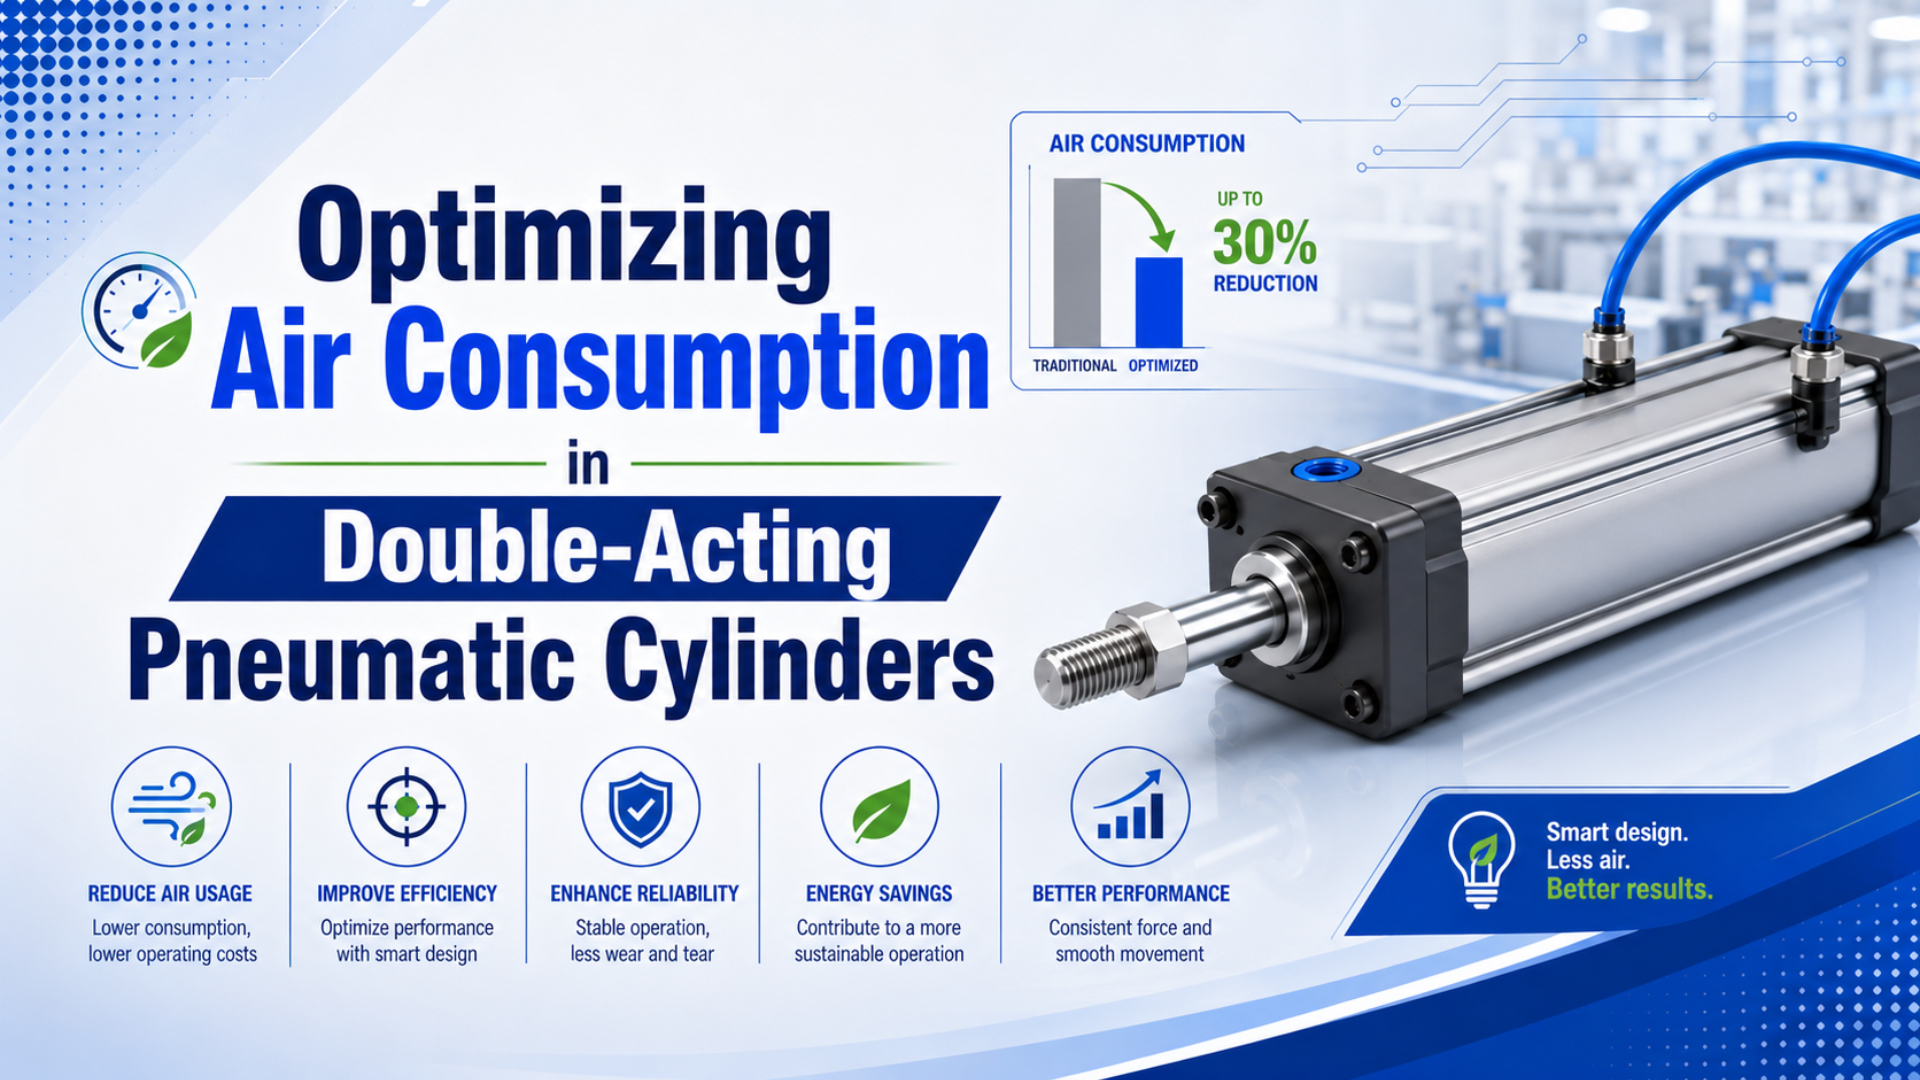
Optimizing a double-acting pneumatic cylinder starts with one measured baseline: normal liters or standard cubic feet per complete extend-and-retract cycle. Calculate both cylinder chambers and the valve-to-cylinder tubing, multiply by cycles per minute, then compare that theoretical demand with a flow measurement at the machine. Only then change pressure, bore, stroke, dead volume, cycle count, leakage, or idle pressurization.
This baseline matters because SMC’s selection guide works through a complete machine example. It uses ten 50 mm bore cylinders with 600 mm strokes at 0.5 MPa, five cycles per minute, and 2 m of 6 mm-bore piping. Using those inputs, the guide estimates 13 L (ANR) per cylinder cycle, adds 0.56 L for piping, and arrives at 678 L/min total demand (SMC Air Cylinders Model Selection, accessed 2026).
Key Takeaways
- Calculate the cap-end volume, rod-end annular volume, and both valve-to-cylinder lines.
- Pressure affects standard-air consumption through absolute pressure, while usable force follows gauge pressure.
- Under SMC’s volume formula, a 25% shorter stroke cuts swept cylinder volume by 25%, but fixed tubing demand remains.
Use manufacturer calculations, U.S. Department of Energy guidance, Festo engineering material, and ISO energy-efficiency guidance when estimating air consumption. Technical corrections should include bore, stroke, pressure, cycle count, and measured air volume.
What Counts as Air Consumption in a Double-Acting Cylinder?
Cylinder air consumption is the standard-reference volume charged into both working chambers during one complete cycle. SMC’s worked example separates 13 L (ANR) of cylinder consumption from 0.56 L of valve-to-cylinder piping consumption, showing that the tube between the valve and actuator is part of every switching event (SMC Air Cylinders Model Selection, accessed 2026).
Geometry breaks the symmetry.
Double-acting cylinders don’t fill the same geometric volume in each direction. Areas set the split. During extension, compressed air enters the full piston area, while retraction fills the annular area left after subtracting the rod. Because the rod occupies area, return-side volume is smaller for a single-rod cylinder. Equal rods can make the two effective areas equal in a double-rod design. Consumption and required flow also need separate treatment. Required flow is the standard-air rate needed during the actual stroke time. Even modest average consumption can require a large valve flow coefficient for a fast 0.2 second stroke. Its guide treats consumption and required flow as separate selection calculations.
Readers can use the double-acting cylinder operating guide to trace how the directional valve alternately pressurizes and exhausts the two chambers. Count the valve-to-actuator tube with its chamber. Supply-header volume upstream of the valve isn’t normally refilled once per stroke, so it belongs to a different system boundary.
| Quantity | What it represents | Typical unit | Why it matters |
|---|---|---|---|
| Air per cycle | Extension chamber + retraction chamber + switched tubing | L/cycle (ANR) or scf/cycle | Compressor and operating-cost baseline |
| Average demand | Air per cycle x cycles per minute x cylinder count | L/min (ANR) or SCFM | Branch and compressor capacity |
| Required stroke flow | Chamber and tubing volume divided by stroke time | L/min (ANR) or SCFM | Valve, FRL, fitting, and tube selection |
| Measured branch flow | Actual machine flow over a defined production period | L/min, Nm3, or scf | Reveals leakage, idle use, and unmodeled loads |
An optimization project fails when these boundaries are mixed. Valve sizing needs peak flow; energy accounting needs standard volume over time; compressor planning needs the sum of coincident demands plus a documented margin. One number cannot safely do all three jobs.
How Do You Calculate Double-Acting Cylinder Air Consumption?
SMC’s cycle model has four separate charged volumes: two cylinder chambers and two switched pipes. Cylinder terms use (gauge pressure + atmospheric pressure) / atmospheric pressure, while switched-pipe terms use the pressure rise above atmosphere (SMC Air Cylinders Model Selection, accessed 2026).
For a single-rod cylinder, begin with these areas:
Piston area = pi x bore^2 / 4
Rod area = pi x rod diameter^2 / 4
Retraction annular area = piston area - rod area

Extension chamber volume = piston area x stroke
Retraction chamber volume = annular area x stroke

Cylinder standard-air volume =
  extension chamber volume x absolute-pressure ratio
  + retraction chamber volume x absolute-pressure ratio

Cycle consumption = cylinder standard-air volume
  + charged cap-end tube volume
  + charged rod-end tube volume
Use consistent units. If area is in mm2 and stroke is in mm, multiply by 10^-6 to obtain liters. When operating pressure is in MPa gauge and the reference atmospheric pressure is approximated as 0.1 MPa, a cylinder at 0.6 MPa gauge uses an absolute-pressure ratio of (0.6 + 0.1) / 0.1 = 7. Don’t apply that ratio blindly to every published catalog value. Manufacturers may report ANR, NL, Nl, dm3, scf, or another reference condition, and temperature or reference pressure definitions can differ. Record the exact basis beside the result so that a supplier calculation and a flow-meter reading can be reconciled later.
Worked example: 50 mm bore, 20 mm rod, 200 mm stroke
Consider one single-rod cylinder operating at 0.6 MPa gauge with a 50 mm bore, 20 mm rod, 200 mm stroke, and one 1 m length of 6 mm-ID tube connected to each port. At 20 complete cycles per minute, the SMC calculation method gives the following rounded result:
| Component | Standard-air volume per cycle |
|---|---|
| Cap-end cylinder chamber | 2.749 L (ANR) |
| Rod-end cylinder chamber | 2.309 L (ANR) |
| Two switched 1 m tubes | 0.339 L (ANR) |
| Complete cycle | 5.397 L (ANR) |
| At 20 cycles/min | 107.9 L/min (ANR) |
This is a calculated baseline, not a promise of measured demand. That baseline excludes valve pilot consumption, leakage, blow-off devices, grippers, vacuum ejectors, regulators that vent, and any air used while the machine is stopped. It also assumes the cylinder reaches the stated pressure in both directions. A lightly loaded, rapidly reversed cylinder may not fully charge before the valve switches.
The pneumatic cylinder formula reference covers the area and force equations behind this calculation. Keep its force result beside the consumption result because the lowest-air setting is useful only if the actuator still delivers the required load margin.
Which Inputs Change Air Consumption the Most?
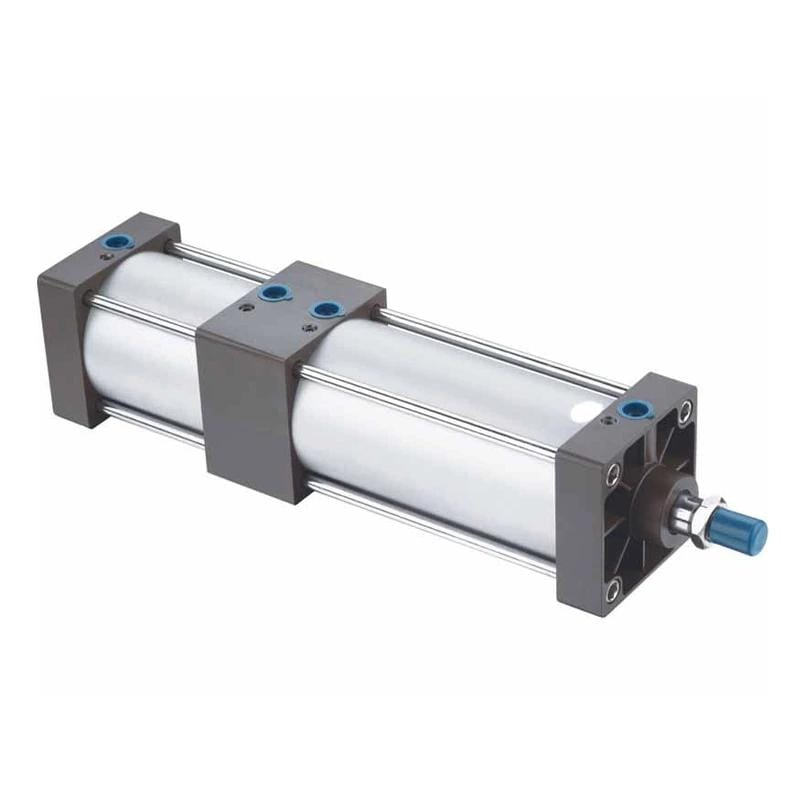
Festo’s cylinder air-consumption tool asks for cylinder size, stroke length, and operating pressure, while SMC adds both switched piping volumes and cycle frequency. Those five input groups explain the repeatable theoretical demand; measured flow above that baseline points toward leakage, idle consumption, pilot air, or another device on the branch (Festo Cylinder Air Consumption, accessed 2026).
The variables don’t all behave the same way:
- Bore changes area with the square of diameter. Moving from a 50 mm bore to a 40 mm bore reduces cap-end piston area by 36%. Force falls by the same 36% at unchanged gauge pressure, so a bore change always needs a load review.
- Stroke changes swept cylinder volume linearly. A reduction from 200 mm to 150 mm removes 25% of chamber volume. Fixed valve-to-cylinder tubing remains, so total cycle savings will be slightly less than 25%.
- Cycle frequency changes consumption per minute linearly. Reducing an unnecessary test stroke from 20 to 15 cycles per minute cuts that motion’s theoretical demand by 25%.
- Pressure changes standard-air mass per charged volume. The comparison uses absolute pressure for consumption, while cylinder force uses the gauge-pressure differential across the piston.
- Valve-to-cylinder tube volume is charged repeatedly. Long tubes, oversized IDs, and remote valve cabinets can turn a small-cylinder circuit into a large dead-volume load.
- Leakage and idle flow sit outside the ideal swept-volume formula. A meter can capture both, but the calculation cannot predict them without separate leakage inputs.
SMC’s own 50 mm bore example assigns 0.56 L of its 13.56 L cycle total to the two meter-scale pipe runs. That is about 4.1% of the stated example. The share becomes larger with smaller cylinders, longer tubes, larger IDs, or higher cycling rates. Place the valve close to the actuator when response, maintenance access, and machine safety permit. The high-speed cylinder checklist helps separate average consumption from the peak flow needed to meet a short stroke time. A smaller valve may reduce purchase cost but will not save theoretical chamber air if the cylinder still reaches the same final pressure. It may simply slow the cycle or increase pressure loss.
How Much Does Lowering Pressure Actually Save?
For the 50 mm worked example, lowering pressure from 0.6 to 0.5 MPa gauge reduces calculated cycle demand from 5.397 to about 4.618 L (ANR), a 14.4% reduction. Theoretical cap-end force simultaneously falls from about 1,178 N to 982 N before friction and safety factors (SMC Air Cylinders Model Selection, accessed 2026).
| Gauge pressure | Calculated cycle demand | Calculated demand at 20 cycles/min | Theoretical cap-end force |
|---|---|---|---|
| 0.6 MPa | 5.397 L (ANR) | 107.9 L/min | 1,178 N |
| 0.5 MPa | 4.618 L (ANR) | 92.4 L/min | 982 N |
| 0.4 MPa | 3.839 L (ANR) | 76.8 L/min | 785 N |
The percentage is specific to this geometry, tube volume, and reference condition. It is not a universal electricity-saving percentage. Compressor input power depends on compressor type, control mode, discharge pressure, storage, leakage, and how much of the total plant demand actually changes. The U.S. Department of Energy says lowering and controlling downstream system pressure can reduce energy consumption by 10% or more when end uses were not properly regulated and compressor controls respond efficiently to the reduced demand. Its system example is conditional, not a guaranteed result for one cylinder (DOE Improving Compressed Air System Performance, 2003).
DOE’s Federal Energy Management Program gives another plant-level relationship. In a system near 100 psig with 30% to 50% unregulated use, a 2 psi discharge-pressure increase can raise combined energy use by about 1.6% to 2%. That includes artificial demand and compressor effects across the system, not only the cylinder chamber (DOE Compressed Air Assessment Basics, 2011).
Festo adds an important counterexample: a correctly sized 6 bar cylinder may need the next larger bore when redesigned for 4 bar, and the larger 4 bar actuator can use about the same amount of air as the correctly sized 6 bar actuator. Pressure reduction is most effective when it removes an existing force surplus, reduces an unloaded return stroke, or allows the plant header itself to run lower (Festo Optimise Compressed Air Use, 2025).
The working-pressure guide explains why the pressure at the cylinder port during motion matters more than the regulator label. Measure under flow. Check both sides of filters, regulators, valves, tubes, and fittings. Otherwise, a setting that looks like energy optimization may actually be a hidden pressure-drop problem.
When Does Right-Sizing Bore or Stroke Reduce Air Use?
A bore change from 50 mm to 40 mm cuts cap-end swept volume by 36% because piston area follows diameter squared; shortening a 200 mm stroke to 150 mm cuts chamber volume by 25%. SMC’s formula makes these changes explicit, while force falls with piston area (SMC Air Cylinders Model Selection, accessed 2026).
Right-sizing means selecting the smallest actuator that still passes the real load case with friction, acceleration, mounting, side load, pressure drop, and a justified margin. It doesn’t mean automatically choosing the next smaller catalog bore. A clamp that must preserve force during a supply dip has a different margin from a horizontal transfer that only overcomes rolling resistance.
Use this order when reviewing an oversized cylinder:
- Measure the dynamic pressure at both cylinder ports during the highest-force part of the cycle. Capture the minimum pressure during acceleration and the peak process load, not only the steady dwell.
- Establish the required push or pull force, including tooling mass, process force, friction, acceleration, and orientation.
- Check whether the rod is in compression and whether buckling or side load controls the design.
- Compare the current bore with the next standard bore at the measured pressure.
- Recheck valve flow, tube ID, cushioning, cycle time, mounting, and spare-parts availability.
The adjacent force calculation sits in the pneumatic cylinder force and air-use guide. This article keeps a deliberately different boundary: it asks what each acceptable geometry consumes over a complete double-acting cycle, including both chambers and switched piping.
Travel isn’t free.
Stroke reduction is simpler mathematically but not always simple mechanically. A shorter working stroke can save swept volume only when the tool doesn’t need the removed travel; moving the workpiece closer, changing tooling geometry, or eliminating an unnecessary clearance move may achieve that result. Cushioning length, sensor locations, maintenance access, and safe withdrawal distance still need review.
Cycle elimination can be even cleaner. Diagnostic shuttles, redundant confirmation strokes, and cylinders left cycling during upstream starvation consume full cycles without creating production output. Correcting sequence logic can remove that demand without changing hardware. Record the before-and-after cycle count so the saving can be calculated and checked at the flow meter.
Do Flow Controls and Valves Reduce Cylinder Consumption?
A conventional speed controller changes motion by throttling flow; it doesn’t automatically reduce the final air mass in a chamber that reaches the same pressure. SMC’s separate AS-R/AS-Q product claims a 25% reduction by adding two-pressure or rapid supply-and-exhaust functions, which shows that the saving comes from circuit behavior, not ordinary throttling alone (SMC AS-R/AS-Q, accessed 2026).
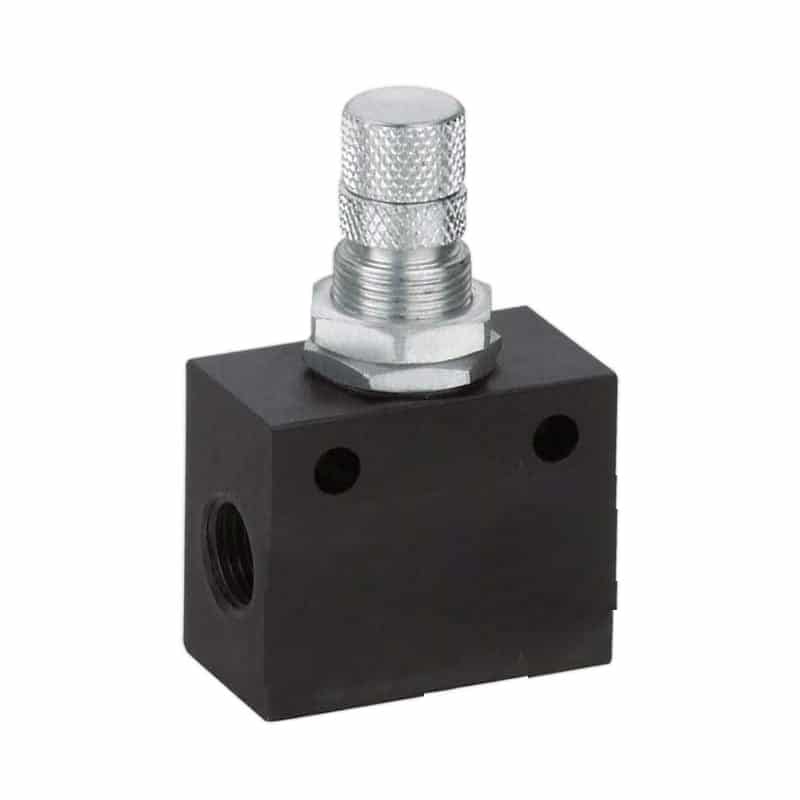
Meter-out control can improve speed stability by restricting exhaust from the leaving chamber. That may prevent impact, bounce, or a wasteful repeat cycle. It can also create back pressure that reduces net cylinder force. The theoretical charge volume remains tied to chamber geometry and final pressure unless the circuit changes the pressure reached or stops filling early. Meter-in control limits supply flow. It can reduce peak flow and, in a rapidly reversed light-load application, may prevent the chamber from reaching full supply pressure before the valve changes state. That effect must be measured because it also changes acceleration, force, and response. It isn’t a safe basis for assuming a fixed saving.
The useful distinction is between a speed device and an air-saving circuit. A speed device controls how quickly mass enters or leaves. An air-saving circuit changes how much mass is admitted, which pressure each stroke needs, how much dead volume is charged, or whether idle branches remain pressurized.
Special two-pressure circuits can use full pressure for the loaded working stroke and lower pressure for an unloaded return. Early supply shutoff or expansion circuits can stop charging before end of stroke. Exhaust-air recovery can transfer residual pressure to another chamber. Each design changes force, timing, safety behavior, and fault response, so use the manufacturer’s circuit and selection rules rather than adding a generic restriction.
Valve selection still matters. An undersized valve causes dynamic pressure loss and slow cycles; an oversized remote valve may require larger tubes and more switched dead volume. Pilot-operated valves may consume pilot air, while direct-operated valves avoid that pneumatic pilot demand but have different electrical, flow, and size limits. The pneumatic pilot-operated valve guide covers that selection boundary.
For applications needing changing pressure or flow, the proportional flow-control guide explains closed-loop options. Proportional hardware is useful when the machine needs controlled profiles or multiple force levels; it isn’t automatically the lowest-cost answer for a fixed two-position cycle.
Verify Air Savings on the Running Machine
SMC’s example predicts 678 L/min for ten cylinders, but SMC also advises considering temperature drop, leakage, and intermediary equipment when selecting compressor capacity. Festo’s energy services measure flow, consumption, and pressure at the machine because theoretical swept volume cannot reveal standby leakage or other branch loads (SMC Air Cylinders Model Selection, accessed 2026; Festo Energy Saving Services, accessed 2026).
Choose the boundary first.
Cycle-normalized air consumption is accumulated standard-air volume divided by complete accepted production cycles; a flow sensor at the machine inlet can capture cylinders, pilot air, blow-off, vacuum, leakage, and idle demand together. A sensor on the cylinder branch isolates the actuator circuit. Port pressure sensors show whether the assumed operating pressure is actually reached during the loaded part of the stroke.
Normalize the result.
In our experience, the most useful record pairs one production counter with accumulated standard-air volume over the same interval; average flow alone is easy to misread when the machine spends part of the test waiting, starved, or stopped. Record accepted parts, complete cycles, idle time, pressure, and rejected cycles beside the air total.
Follow the same procedure before and after a change:
- Define the boundary. Name the machine, branch, valve manifold, or individual cylinder included in the measurement.
- Stabilize production. Use the same product, tooling, pressure, cycle program, and operating temperature.
- Record cycle-normalized air. Divide accumulated normal liters or standard cubic feet by complete accepted cycles.
- Measure idle flow. Stop commanded motion while keeping the normal pressurization state. Investigate any sustained flow.
- Capture dynamic pressure. Record supply and both actuator ports during the highest-flow and highest-force events.
- Make one controlled change. Pressure, bore, stroke, tubing, logic, and leakage repairs should not all change in one test.
- Repeat the measurement. Compare air per accepted cycle, not a single instantaneous flow reading. Keep the original test sheet with the machine so maintenance can repeat the same boundary, load, timing, and acceptance conditions after future changes.
| Result | Likely interpretation | Next check |
|---|---|---|
| Measured cycle air matches calculation | Geometry and cycle count explain most demand | Review whether bore, pressure, stroke, or cycles can safely change |
| Measured production air is higher | Leakage, pilot flow, blow-off, vacuum, or extra movements are present | Isolate branch loads one at a time |
| Idle flow remains high | Leaks, venting regulators, open blow-off, or standby circuits | Perform a stopped-machine leak and isolation test |
| Port pressure is below the model input | Supply restriction or valve/tube pressure drop | Use the pressure-drop troubleshooting guide |
| Air per cycle falls but rejects rise | Force, speed, cushioning, or sequence margin was removed | Restore the last stable condition and review the load case |
Costs come later.
Convert the measured result to cost only after the volume boundary is credible; annual compressor electricity is not a universal dollars-per-SCF constant. Then use measured specific power, control behavior, hours, tariff, and schedule.
Optimization Order for Existing Machines
DOE reports that lowering controlled system pressure can reduce energy by 10% or more under specific unregulated-demand and compressor-control conditions. ISO/TR 22165 takes the safer position: improve pneumatic energy efficiency while considering function and economic efficiency, without assigning one universal saving to every machine (DOE Sourcebook, 2003; ISO/TR 22165:2018, 2018).
Start with changes that preserve the machine’s design intent and produce measurable results:
| Priority | Action | Why it comes here | Acceptance evidence |
|---|---|---|---|
| 1 | Repair external and internal leakage | Removes demand without changing the intended cycle | Lower idle flow and unchanged production |
| 2 | Stop air during planned idle states | Prevents nonproductive pressurization and blow-off | Near-zero safe-state branch flow where permitted |
| 3 | Remove unnecessary movements | Saves complete cycles without reducing cylinder capability | Same accepted output with fewer commanded strokes |
| 4 | Set the lowest verified working pressure | Reduces charged mass when force surplus exists | Load, speed, and safety tests pass at measured port pressure |
| 5 | Reduce unloaded return pressure | Targets the low-force half of the cycle | Return timing and fault behavior remain acceptable |
| 6 | Shorten valve-to-cylinder tubing | Cuts repeatedly charged dead volume | Same response with lower air per cycle |
| 7 | Shorten unnecessary stroke | Removes swept volume directly | Tooling clearance and safe withdrawal remain adequate |
| 8 | Right-size the bore | Can produce a large area-based reduction | Force, buckling, speed, cushioning, and mounting all pass |
| 9 | Evaluate an air-saving circuit | Useful when ordinary settings cannot separate force needs | Manufacturer-specific circuit test confirms the saving |
Don’t begin by lowering the whole plant header. First separate critical high-pressure users from applications with excess local pressure. The compressor, receiver, dryer, distribution system, and production transients must be reviewed together before changing a shared setpoint. Don’t begin with a new valve either. A new valve can solve pressure drop or enable a two-pressure circuit, but it cannot remove oversized chamber volume by itself. The calculation and measurement should identify which variable is responsible before hardware is ordered. The final acceptance sheet should include the cylinder model, bore, rod, stroke, valve, tube ID and length, regulator setting, dynamic port pressures, air per cycle, idle flow, cycle time, load condition, temperature, and date. That record turns future maintenance from guesswork into a comparison with known-good behavior.
Air Consumption FAQ
SMC’s published example combines 13 L (ANR) of cylinder volume with 0.56 L of switched piping per cycle, while DOE warns that plant energy response depends on unregulated demand and compressor controls. Those two boundaries explain why cylinder liters per cycle and electricity savings must be calculated separately (SMC, accessed 2026; DOE, 2003).
How much air does a double-acting pneumatic cylinder use per cycle?
Count every charged volume. Add the standard-reference volume for the full-bore extension chamber, the annular retraction chamber, and both switched valve-to-cylinder tubes. The result depends on bore, rod diameter, stroke, gauge pressure, reference condition, and tube geometry. Multiply by complete cycles per minute and cylinder count to obtain average demand.
Does a double-acting cylinder consume the same air extending and retracting?
Not for a normal single-rod cylinder. Extension fills the full piston area, while retraction fills the smaller annular area after rod area is subtracted. A double-rod cylinder with equal rods can have equal effective areas. Pressure settings and tube volumes may still make the measured directional consumption different.
Does lowering pressure from 7 bar to 6 bar save 14%?
Use absolute pressure. When 7 bar and 6 bar are gauge pressures, a fixed chamber compares approximately 8 bar absolute with 7 bar absolute, which is a 12.5% reduction. Actual cycle savings also depend on rod-side volume, tubing, final chamber pressure, and leakage.
Will a speed controller reduce cylinder air consumption?
Speed isn’t consumption. A conventional speed controller primarily changes flow rate and motion time. If the chamber still reaches the same pressure, its theoretical charged mass is essentially unchanged. Air-saving speed controllers or two-pressure circuits can change return pressure, fill timing, or final pressure. Their application limits still need to be checked.
How do you prove that an optimization saved compressed air?
Measure accumulated normal liters or standard cubic feet over the same number of accepted production cycles before and after one controlled change. Record idle flow and dynamic pressure alongside cycle time, load and rejects. Then compare air per accepted cycle. Verify safety and process quality without losing force or timing.
The lowest reading isn’t automatically the best setting. The correct result is the lowest repeatable air consumption that still passes every requirement for force, timing and safety as well as process quality and fault response.
External technical references and retrieval dates
SMC, Air Cylinders Model Selection: Double-acting cylinder and piping air-consumption formulas, required-flow distinction, 50 mm bore worked example, and compressor-capacity note. Retrieved 2026-07-10.
Festo, Cylinder Air Consumption: Cylinder size, stroke, and operating-pressure inputs for configuration comparison. Retrieved 2026-07-10.
U.S. Department of Energy, Improving Compressed Air System Performance: Systems approach, artificial demand, pressure control, storage, and conditional energy reduction. Retrieved 2026-07-10.
U.S. Department of Energy FEMP, Compressed Air Assessment Basics: Conditional pressure and artificial-demand effects for systems near 100 psig. Retrieved 2026-07-10.
ISO/TR 22165:2018: Application guidance scope for pneumatic system energy efficiency with functional and economic considerations. Retrieved 2026-07-10.
Festo, Optimise Compressed Air Use in Pneumatic Systems: Pressure-reduction benefits, sizing tradeoffs, and unloaded return-pressure guidance. Retrieved 2026-07-10.
SMC, Air Saving Speed Controller AS-R/AS-Q: Product-specific two-pressure air-saving claim and application context. Retrieved 2026-07-10.
Festo Energy Saving Services: Machine-level flow, consumption, and pressure measurement approach. Retrieved 2026-07-10.