

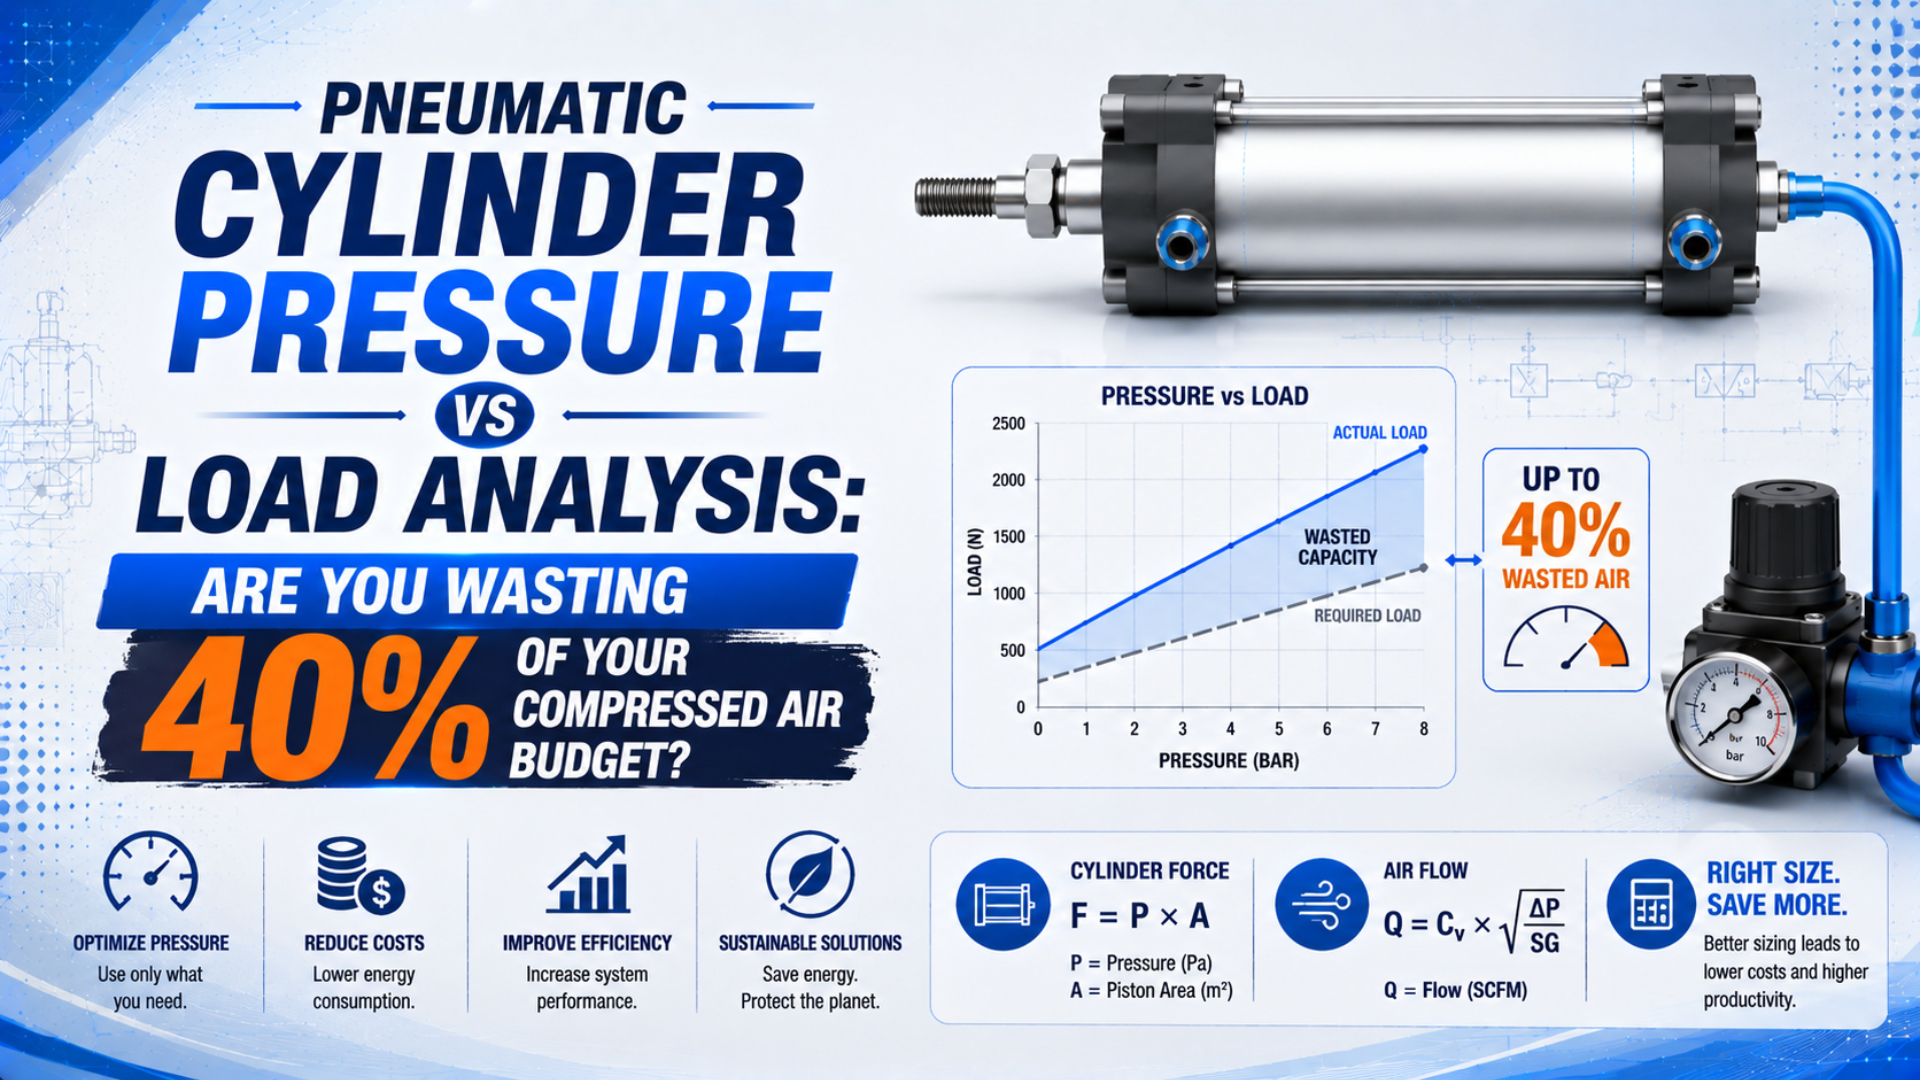
A pneumatic cylinder can waste air when its working pressure is higher than the load requires, but 40% is not a universal saving. Treat it as a testable hypothesis. Calculate the load in both directions, measure both cylinder-port pressures during the hardest part of the stroke, and compare normalized air consumption before changing the regulator.
Pneumatic cylinder pressure-load analysis is the process of matching directional force demand to measured chamber pressure, then checking whether the selected pressure also meets speed, structure, and air-consumption requirements.
Key Takeaways
- Pressure must be measured at the cylinder during motion, not inferred from the compressor header.
- A 40% cylinder-air reduction requires roughly a 40% drop in absolute filling pressure at unchanged volume and cycles.
- Force, flow, guidance, cushioning, and compressor response must all pass before a lower setting becomes an energy saving.
This analysis is deliberately narrower than a general air-cylinder working-pressure guide or an effective piston-area calculation. The question here is whether the pressure supplied to one cylinder is justified by its measured load and whether any reduction reaches the plant’s compressed-air budget.
Is a 40% Compressed-Air Saving Realistic?
DOE reports a documented plant project in which reducing system pressure by 22 psig lowered compressed-air energy costs by 11%. That verified result is useful precisely because it is not 40%: savings depend on load, unregulated demand, compressor controls, and the pressure actually reduced (DOE Better Plants, retrieved 2026-07-22).
Three different percentages are often mixed together:
- Cylinder air-volume reduction: the normalized air used by that actuator.
- Plant air-demand reduction: the cylinder saving after all other actuators, leaks, blow-off, purge, and unregulated end uses are included in the total demand profile.
- Electrical energy reduction: the compressor response after controls, storage, pressure bands, and specific power are considered.
If one cylinder uses 40% less normalized air, the plant does not automatically use 40% less electricity. Lightly loaded compressor controls can unload inefficiently, another compressor can remain online, or unregulated users can dominate header demand. The only defensible budget claim comes from measured flow or a validated cycle-volume model combined with compressor power data. The title’s 40% threshold is therefore best used as a falsifiable target. First ask whether the cylinder’s absolute filling pressure can fall by about 40% without violating force and cycle requirements. Then ask whether the compressor controls turn the lower air demand into lower kilowatt-hours. This two-stage proof separates an actuator calculation from a plant energy result. Record both results because either can invalidate a savings claim even when the other looks favorable.
Build the Pressure-Load Calculation from a Force Balance
Parker’s ISO 15552 P1F catalog lists a 50 mm bore, 20 mm rod cylinder at 1,178 N theoretical extension force and 990 N theoretical return force at 6 bar. The unequal values show why pressure-load analysis must use the correct area and motion direction (Parker P1F catalog, retrieved 2026-07-22).
Let represent bore diameter and represent rod diameter. The extension and retraction areas are:
is full piston area and is annular area. Use millimeters for both diameters to obtain square millimeters, or meters for both to obtain square meters.
During extension, the pressure-force balance is:
is cap-side pressure, is rod-side exhaust back pressure, and includes seal and guide friction plus any other resistance not already included in the external load. Both pressures must use the same reference, normally gauge pressure for a two-port balance.
Solving for the cap-side pressure required to move the load gives:
is the process force, $m a$ is acceleration force, and is positive when gravity opposes motion. Reverse the chamber areas and pressure roles for retraction. Keep every term signed to the chosen motion direction.
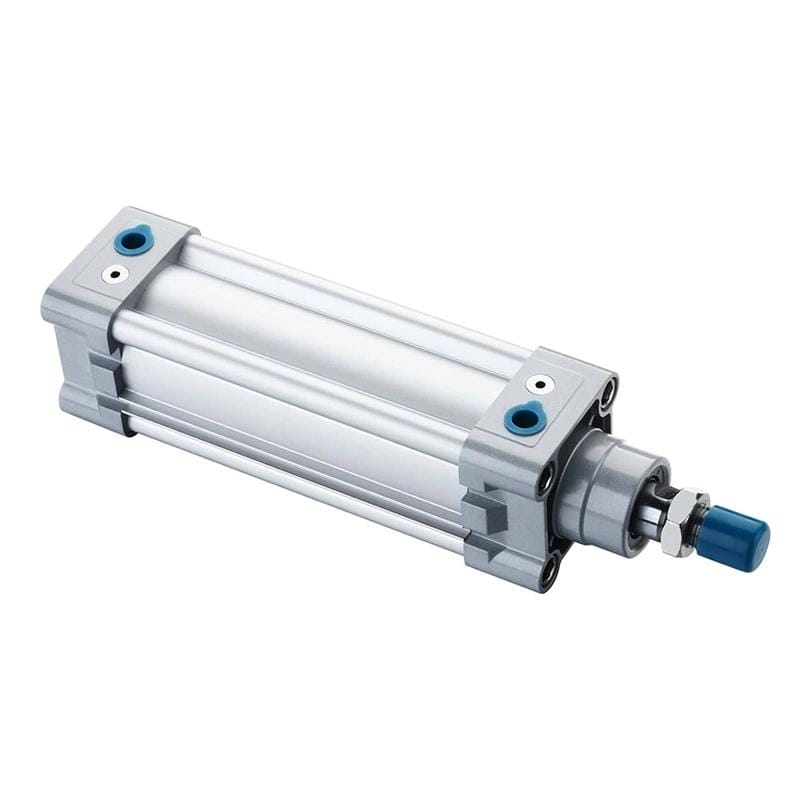
A single-rod cylinder has full piston area on extension and a smaller annular area on retraction, so the two directions require separate checks.
Worked example: 50 mm bore, 20 mm rod, 700 N clamp load
For and :
Ignoring back pressure and friction for the first theoretical check, a 700 N extension load requires:
That value only balances the stated load. It is not the regulator setting. SMC’s cylinder-selection guide uses purpose-dependent load factors, including 0.7 and 0.5, and recommends still lower factors for high-speed cases. If the chosen manufacturer’s stationary-work method limits load factor to 0.7, the same 700 N load needs at least 1,000 N theoretical force, equivalent to about 5.09 bar for this bore (SMC Air Cylinders Model Selection, retrieved 2026-07-22).
Notice the distinction: 3.565 bar is a force-balance result, while 5.09 bar comes from one documented selection method. Don’t bury acceleration, friction, back pressure, and application margin inside an invented universal “cylinder efficiency” percentage.
If the required load is known but the bore is not, use the Cylinder Bore Size Calculator as the reverse-sizing step. For the geometric basis behind push and pull force, see the pneumatic cylinder theoretical-force guide.
What Changes for Static, Dynamic, and Vertical Loads?
SMC’s selection guide publishes load-factor limits of 0.7, 0.5, and lower values for faster operating cases, rather than one universal multiplier. This is the practical answer: load type changes the required force terms and the manufacturer’s acceptable load ratio, not merely a percentage added to theoretical pressure (SMC, retrieved 2026-07-22).
| Load case | Include in the force balance | Main verification risk |
|---|---|---|
| Static clamp | Process force, friction, exhaust back pressure | Minimum holding force at the lowest supply pressure |
| Horizontal guided motion | Guide friction, acceleration, process contact force | Breakaway, speed change, and end impact |
| Vertical lifting | Weight, acceleration, friction, back pressure | Controlled lowering and loss-of-pressure behavior |
| Variable payload | Worst credible mass and process force | Stable motion over the entire load range |
| High-cycle motion | Acceleration, flow loss, cushion energy | Dynamic pressure collapse and overheating |
For a vertical axis, weight is . Add $m a$ when accelerating upward. During controlled lowering, gravity can drive the load, so the circuit must also control overrunning motion. A larger cylinder or higher pressure does not by itself provide load holding, safe exhaust behavior, or protection after supply loss.
For a guided horizontal axis, do not treat payload mass as an axial force by multiplying it by gravity. The cylinder overcomes guide friction, acceleration, cable drag, and process forces. The load’s weight matters to bearing reactions and friction, but the guide carries it when the mechanism is designed correctly.
A pressure-load worksheet should have two columns: required axial force and non-axial load reactions. Pressure can increase axial thrust. It cannot correct a side load, an excessive overturning moment, a flexible mount, or a misaligned guide. Mixing those columns is a common reason an apparently powerful cylinder still wears seals and binds.
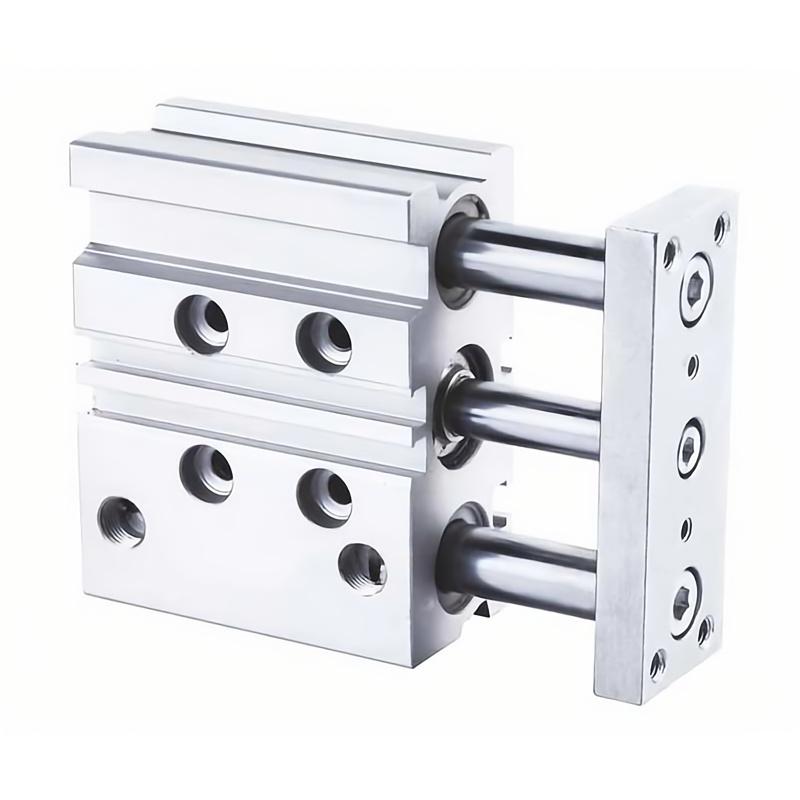
A guided actuator manages side load and anti-rotation requirements that extra air pressure cannot solve.
If the rod or carriage sees significant side loading, review the cylinder mounting and load-capacity guide before increasing pressure.
Measure Dynamic Pressure at Both Cylinder Ports
The DOE says a well-designed compressed-air distribution system should have pressure loss much less than 10% of compressor discharge pressure, measured from receiver output to point of use. It also identifies hoses, quick disconnects, filters, regulators, lubricators, and tubing as common point-of-use restrictions (DOE Sourcebook, retrieved 2026-07-22).
A regulator gauge observed while the machine is idle cannot show what the cylinder receives during peak flow. Install pressure transducers or fast gauges at both cylinder ports and record a complete extend-hold-retract cycle. At minimum, capture:
Dynamic cylinder pressure is the pressure recorded at a cylinder port while air is flowing and the actuator is moving, rather than the static value shown after flow stops.
- header pressure upstream of the machine regulator, including transients created by concurrent machine demand;
- regulator outlet pressure at idle and throughout acceleration, constant-speed travel, cushion entry, dwell, reversal, retraction, and maximum payload;
- cap-side and rod-side cylinder-port pressure;
- stroke position or time reference;
- cycle time and payload condition.
Look for two different problems. A falling supply-side port pressure indicates insufficient flow through the regulator, valve, fitting, tubing, or supply path. A high exhaust-side pressure indicates back pressure through a flow control, muffler, small valve passage, or restricted exhaust. Both reduce net force even when the static regulator setting looks adequate.
DOE’s end-use guidance says to monitor pressure at the tool inlet and not confuse maximum allowable pressure with required pressure. The same rule applies to cylinders: the component’s maximum rating is a boundary, not a target operating value (DOE End-Use Tip Sheet, retrieved 2026-07-22).
The troubleshooting sequence in what causes pressure drop in pneumatic systems helps isolate each restriction without raising the whole plant header.
Can Lower Cylinder Pressure Cut Air Use by 40%?
Parker’s P1F table gives a 50/20 mm cylinder 0.136 Nl per 10 mm on extension and 0.114 Nl per 10 mm on retraction at 6 bar. For a 500 mm stroke, that is about 12.5 normalized liters per complete cycle before tubing volume and leakage (Parker P1F catalog, retrieved 2026-07-22).
For an idealized double-acting cycle with the same filling pressure in both directions:
is normalized air per cycle, is stroke, is cylinder filling pressure on an absolute basis, and is the chosen normal reference pressure. State the reference conditions whenever comparing Nl, NL/min, SCF, or SCFM.
At 6 bar gauge, the ideal absolute filling pressure is about 7 bar absolute. For the 50/20 mm, 500 mm-stroke example, the calculated swept volume is about 1.806 liters, giving about 12.64 normalized liters per cycle at a 1 bar absolute reference. That closely checks Parker’s rounded catalog total of about 12.5 Nl per cycle.
To reduce this fixed-volume cylinder’s ideal air use by 40% without changing stroke or cycle count:
Starting from 7 bar absolute, the target would be 4.2 bar absolute, or roughly 3.2 bar gauge:
NIST defines 1 psi as 6,894.757 Pa, so mixed-unit pressure records should be converted before comparing setpoints, port traces, or catalog data (NIST, retrieved 2026-07-22).
This calculation immediately rejects the 40% target for the 700 N clamp example. At 3.2 bar, a 50 mm bore produces only about 628 N theoretical extension force, less than the process load even before back pressure, friction, or a manufacturer load factor. The air-saving target and load requirement cannot both be true for that cylinder.
Use the Air Consumption Calculator to extend the check across cycle rate and operating hours. The related article on pneumatic cylinder bore size and operating cost explains why increasing bore while reducing pressure does not by itself prove a lower total demand.
Choose the Correct Engineering Change
DOE estimates that, around 100 psig, each 2 psi increase in compressor discharge pressure raises full-output energy use by about 1%, before extra unregulated demand is counted. Its first recommendation is to reduce restrictions and use the lowest efficient operating pressure, not automatically raise the compressor setpoint (DOE Sourcebook, retrieved 2026-07-22).
| Evidence from the machine | Best first action | Why |
|---|---|---|
| Force margin is adequate and cycle time passes | Lower the local regulator in measured steps | Directly tests whether pressure is unnecessary |
| Supply port pressure collapses during motion | Increase flow capacity or reduce restriction | Header pressure cannot compensate efficiently for a local bottleneck |
| Exhaust port back pressure is high | Review meter-out valve, muffler, valve and exhaust path | Back pressure subtracts from net cylinder force |
| Required force exceeds catalog selection method | Increase bore, revise mechanism, or use another actuator architecture | Avoid exceeding component pressure limits |
| Side load or moment is excessive | Add an external guide or select a guided actuator | Pressure does not support non-axial reactions |
| End impact is unacceptable | Reduce speed or verify cushion and shock capacity | More pressure can increase kinetic energy and impact |
| One small zone needs higher pressure | Review a local booster and storage arrangement | Avoid raising the entire header for one user |
Never raise a cylinder above its exact catalog pressure rating to avoid selecting the correct bore. A smaller high-pressure cylinder is not automatically more energy efficient: its absolute-pressure ratio is higher, leakage consequences can increase, and the compressor must still produce that pressure.
Run changes in controlled increments. At each setting, record minimum cap- and rod-side pressure, stroke time, peak impact, repeatability, load result, and normalized air per cycle. Then watch compressor kW and system pressure long enough to include the relevant production mix and control cycles.
Acceptance worksheet
Record these values before and after the change:
- bore and rod;
- load in each direction and product variant, process force, guided friction, acceleration, gravity, and resistance during contact or tool engagement under the worst operating recipe;
- header, regulator-outlet, cap-port, and rod-port pressure traces;
- valve, tube, fitting, flow-control, and muffler sizes;
- extend time, retract time, dwell time, impact, and repeatability;
- normalized liters or SCF per cycle, cycles per shift, and operating hours;
- compressor kW, loaded/unloaded state, header band, and production count.
The result should be expressed as a range tied to operating conditions, not as a permanent percentage. If a lower regulator setting saves air during one product recipe but misses cycle time on the heaviest recipe, zone control or recipe-specific pressure can be better than one compromise setting.
Pneumatic Cylinder Pressure vs Load FAQs
Parker’s catalog shows that a 50/20 mm cylinder at 6 bar has 1,178 N theoretical push force but only 990 N theoretical pull force. These FAQs address the measurements and decisions that turn those two catalog values into a safe machine setting and a defensible compressed-air saving (Parker P1F catalog, retrieved 2026-07-22).
Can I calculate cylinder pressure from load alone?
No. Load divided by piston area gives only a theoretical balance pressure. A working selection must also address motion direction, acceleration, gravity, exhaust back pressure, friction, minimum dynamic supply pressure, and the manufacturer’s load-factor method. Verify the result against the exact cylinder catalog and a measured machine cycle.
Why is cylinder-port pressure lower than the regulator setting?
Flow through regulators, valves, fittings, tubing, quick disconnects, and filters creates pressure drop. The drop is greatest during high flow, so an idle gauge can look normal while port pressure collapses during acceleration. Measure the supply and exhaust ports through a full cycle before increasing the plant header.
Does a 40% pressure reduction equal a 40% air saving?
Not when comparing gauge pressure. For a fixed chamber volume, normalized air tracks absolute filling pressure. Reducing 6 bar gauge to 3.2 bar gauge changes absolute pressure from roughly 7 to 4.2 bar, a 40% ideal cylinder-volume reduction. Leakage, tubing volume, cycle changes, and compressor response alter the plant result.
Should I raise pressure or choose a larger bore?
Choose from the force balance, catalog limits, package space, air demand, and available dynamic pressure. A larger bore increases force at the same pressure but also increases chamber volume. Higher pressure increases force without changing bore but can raise air use and system energy. Compare both options at the required cycle rate.
How do I prove that lower pressure saves electrical energy?
Measure normalized air demand and compressor power over comparable production. Confirm that output, cycle time, pressure stability, and quality remain acceptable. A local cylinder reduction lowers plant electricity only when compressor controls respond to the lower demand; compressor kW, loaded hours, and production-normalized energy provide the final evidence.
Sources and technical references
- Parker P1F ISO 15552 Pneumatic Cylinders Technical Catalogue - theoretical force and normalized air-consumption tables for extension and retraction, including the 50/20 mm example used to cross-check this article’s force and cycle-volume calculations. Retrieved 2026-07-22.
- SMC Air Cylinders Model Selection - purpose-dependent load factors, operating-pressure selection, and high-speed cautions. Retrieved 2026-07-22.
- DOE Improving Compressed Air System Performance: A Sourcebook for Industry - pressure drop, point-of-use restrictions, artificial demand, and pressure-energy guidance. Retrieved 2026-07-22.
- DOE Engineer End Uses for Maximum Efficiency - required versus maximum pressure and point-of-use measurement guidance. Retrieved 2026-07-22.
- DOE Better Plants TE Connectivity case study - measured 22 psig system-pressure reduction and 11% compressed-air energy-cost reduction. Retrieved 2026-07-22.
- NIST Pressure and Gas Flow Unit Conversions - pressure conversion factors. Retrieved 2026-07-22.