

Are you experiencing unexpected machine shutdowns, inconsistent pneumatic system performance, or premature sensor failures in challenging environments? These common problems often stem from improper sensor selection, leading to costly downtime, quality issues, and excessive maintenance. Choosing the right pneumatic sensors can immediately solve these critical issues.
Der ideale pneumatische Sensor muss auf die spezifischen Druckanforderungen Ihres Systems kalibriert sein, schnell genug reagieren, um kritische Durchflussereignisse zu erfassen, und einen angemessenen Umweltschutz für Ihre Betriebsbedingungen bieten. Für die richtige Auswahl müssen Sie die Kalibrierungsverfahren, die Testmethoden für die Ansprechzeit und die Schutzklassenstandards kennen.
I remember visiting a food processing facility in Wisconsin last year where they were replacing pressure switches every 2-3 months due to washdown damage. After analyzing their application and implementing properly rated sensors with appropriate IP67 protection, their replacement frequency dropped to zero over the following year, saving over $32,000 in downtime and materials. Let me share what I’ve learned over my years in the pneumatic industry.
Inhaltsübersicht
- Pressure Switch Calibration Standards and Procedures
- How to Test and Verify Flow Sensor Response Time
- Comprehensive IP Rating Guide for Harsh Environments
How Should You Calibrate Pressure Switches for Maximum Accuracy and Reliability?
Proper pressure switch calibration ensures accurate triggering points, prevents false alarms, and maximizes system reliability.
Pressure switch calibration establishes precise activation and deactivation setpoints while accounting for hysteresis effects. Standard calibration procedures involve controlled pressure application, setpoint adjustment, and verification testing under actual operating conditions. Following established calibration protocols ensures consistent performance and extends sensor life.
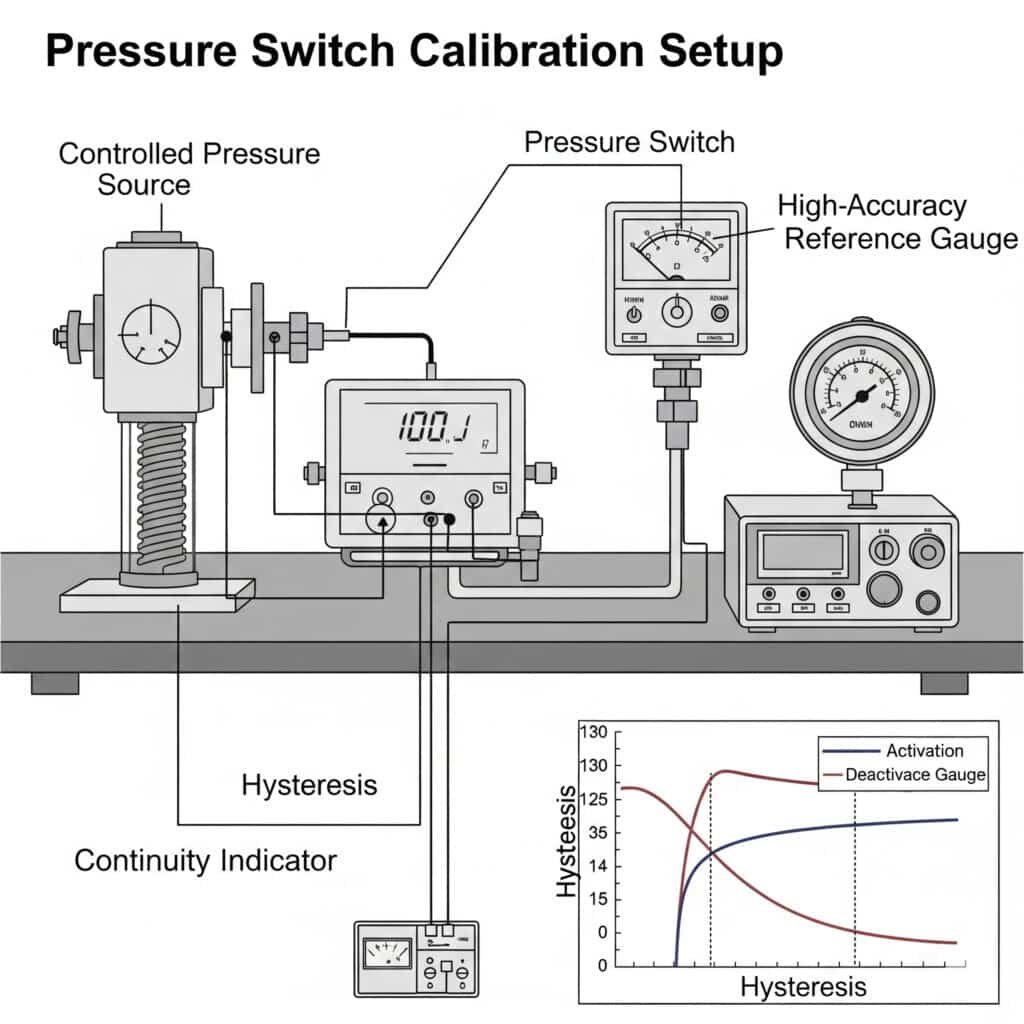
Understanding Pressure Switch Fundamentals
Before diving into calibration procedures, it’s essential to understand key pressure switch concepts:
Key Pressure Switch Parameters
- Setpoint (SP): The pressure value at which the switch changes state
- Reset point (RP): The pressure value at which the switch returns to its original state
- Hysterese1: The difference between setpoint and reset point
- Reproduzierbarkeit: Consistency of switching at the same pressure value
- Accuracy: Deviation from the true pressure value
- Deadband: Another term for hysteresis, the pressure differential between activation and deactivation
Types of Pressure Switches and Their Calibration Characteristics
| Switch Type | Calibration Method | Typische Messgenauigkeit | Hysteresis Range | Beste Anwendungen |
|---|---|---|---|---|
| Mechanical diaphragm | Manual adjustment | ±2-5% | 10-25% of range | General industrial, cost-sensitive |
| Piston-type | Manual adjustment | ±1-3% | 5-15% of range | Higher pressure applications |
| Electronic with display | Digital programming | ±0.5-2% | 0.5-10% (adjustable) | Precision applications, data monitoring |
| Smart/IoT-enabled | Digital + remote calibration | ±0.25-1% | 0.1-5% (programmable) | Industry 4.02, remote monitoring |
| Bepto DigiSense | Digital with auto-compensation | ±0.2-0.5% | 0.1-10% (programmable) | Critical applications, varying conditions |
Standard Pressure Switch Calibration Procedure
Follow this comprehensive calibration procedure to ensure accurate and reliable pressure switch performance:
Equipment Requirements
- Pressure source: Capable of generating stable pressure throughout the required range
- Reference gauge: At least 4× more accurate than the switch being calibrated
- Connection hardware: Appropriate fittings and adapters
- Documentation tools: Calibration record forms or digital system
Step-by-Step Calibration Process
Preparation phase
– Allow switch to acclimate to ambient temperature (minimum 1 hour)
– Verify reference gauge calibration is current
– Inspect switch for physical damage or contamination
– Document initial settings before making changes
– Relieve all pressure from the systemInitial verification
– Connect switch to calibration system
– Apply pressure slowly to current setpoint
– Record actual switching pressure
– Reduce pressure slowly to reset point
– Record actual reset pressure
– Calculate actual hysteresis
– Repeat 3 times to verify repeatabilityAdjustment procedure
– For mechanical switches:
– Remove adjustment cover/lock
– Adjust setpoint mechanism per manufacturer’s instructions
– Tighten locknut or secure adjustment mechanism
– For electronic switches:
– Enter programming mode
– Input desired setpoint and hysteresis/reset values
– Save settings and exit programming modeVerification testing
– Repeat initial verification procedure
– Confirm setpoint is within required tolerance
– Confirm reset point/hysteresis is within required tolerance
– Perform minimum 5 cycles to verify repeatability
– Document final settings and test resultsSystem installation
– Install switch in actual application
– Perform functional test under normal operating conditions
– Verify switch operation at process extremes if possible
– Document final installation parameters
Calibration Frequency and Documentation
Establish a regular calibration schedule based on:
- Manufacturer’s recommendations: Typically 6-12 months
- Application criticality: More frequent for safety-critical applications
- Environmental conditions: More frequent in harsh environments
- Regulatory requirements: Follow industry-specific standards
- Historical performance: Adjust based on drift observed in previous calibrations
Maintain detailed calibration records including:
- Date and technician information
- As-found and as-left settings
- Reference equipment used and its calibration status
- Environmental conditions during calibration
- Observed anomalies or concerns
- Next scheduled calibration date
Hysteresis Optimization for Different Applications
Proper hysteresis setting is critical for application performance:
| Application Type | Recommended Hysteresis | Reasoning |
|---|---|---|
| Precision pressure control | 0.5-2% of range | Minimizes pressure fluctuations |
| General automation | 3-10% of range | Prevents rapid cycling |
| Compressor control | 10-20% of range | Reduces start/stop frequency |
| Alarm monitoring | 5-15% of range | Prevents nuisance alarms |
| Pulsating systems | 15-25% of range | Accommodates normal fluctuations |
Common Calibration Challenges and Solutions
| Herausforderung | Potential Causes | Lösungen |
|---|---|---|
| Inconsistent switching | Vibration, pressure pulsations | Increase hysteresis, add dampening |
| Drift over time | Temperature variations, mechanical wear | More frequent calibration, upgrade to electronic switch |
| Cannot achieve required setpoint | Outside of adjustment range | Replace with appropriate range switch |
| Excessive hysteresis | Mechanical friction, design limitations | Upgrade to electronic switch with adjustable hysteresis |
| Poor repeatability | Contamination, mechanical wear | Clean or replace switch, add filtration |
Case Study: Pressure Switch Calibration Optimization
I recently worked with a pharmaceutical manufacturing facility in New Jersey that was experiencing intermittent false alarms from pressure switches monitoring critical process lines. Their existing calibration procedure was inconsistent and poorly documented.
After analyzing their application:
- Required setpoint accuracy: ±1%
- Operating pressure: 5.5 bar
- Ambient temperature fluctuations: 18-27°C
- Pressure pulsations present from reciprocating equipment
We implemented a comprehensive solution:
- Upgraded to Bepto DigiSense electronic pressure switches
- Developed standardized calibration procedure with temperature compensation
- Optimized hysteresis settings to 8% to accommodate pressure pulsations
- Implemented quarterly verification and annual full calibration
- Created digital documentation system with historical trending
Die Ergebnisse waren signifikant:
- False alarms reduced by 98%
- Calibration time reduced from 45 minutes to 15 minutes per switch
- Documentation compliance improved to 100%
- Process reliability improved measurably
- Annual savings of approximately $45,000 in reduced downtime
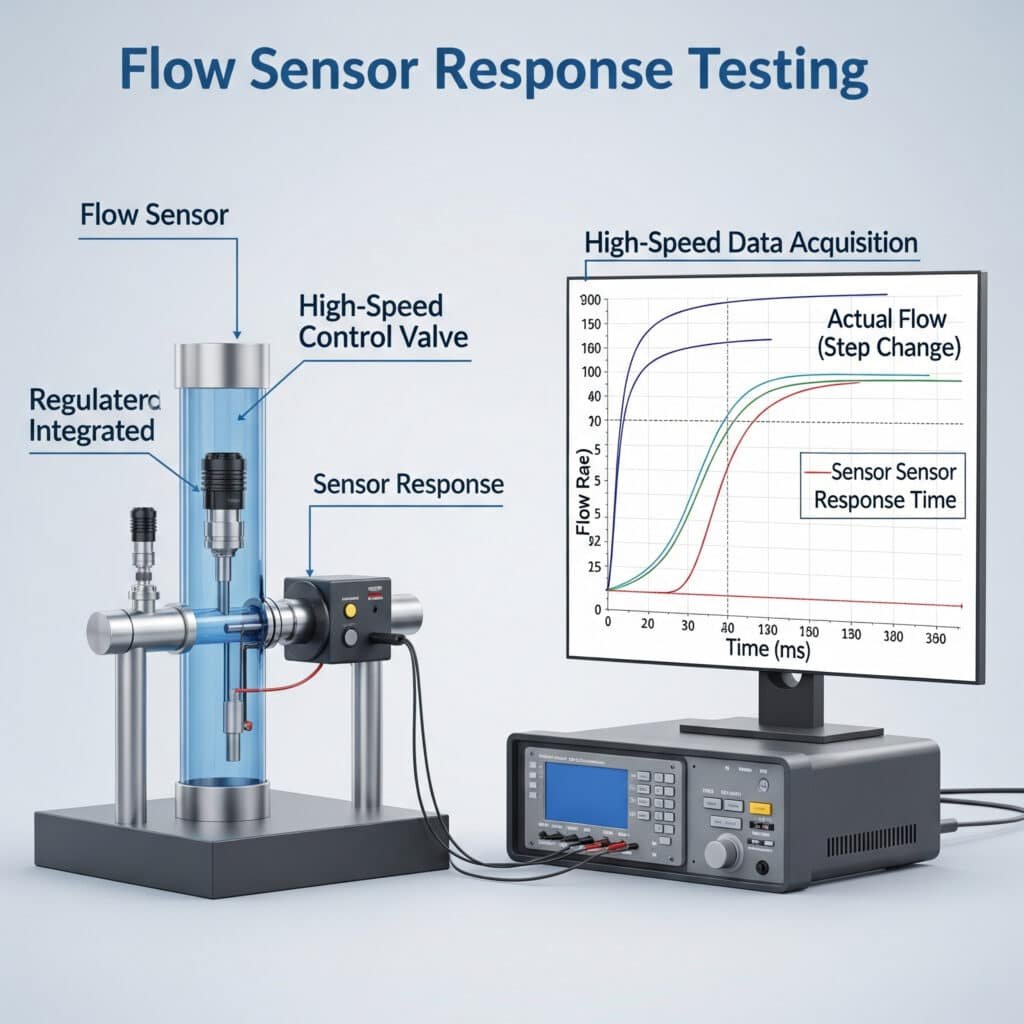
How Can You Accurately Test Flow Sensor Response Time for Critical Applications?
Flow sensor response time is critical for applications requiring rapid detection of flow changes, particularly in safety systems or high-speed processes.
Flow sensor response time measures how quickly a sensor detects and signals a change in flow conditions. Standard testing involves creating controlled step changes in flow while monitoring sensor output with high-speed data acquisition equipment. Understanding response characteristics ensures sensors can detect critical events before system damage occurs.
Understanding Flow Sensor Response Dynamics
Flow sensor response time involves several distinct components:
Key Response Time Parameters
- Dead time (T₀): Initial delay before any sensor response begins
- Rise time (T₁₀₋₉₀): Time to rise from 10% to 90% of final value
- Settling time (Tₛ): Time to reach and remain within ±2% of final value
- Response time (T₉₀): Time to reach 90% of final value (most commonly specified)
- Overshoot: Maximum value exceeded beyond final stable value
- Recovery time: Time to return to normal after flow returns to initial state
Flow Sensor Response Time Testing Methodology
Properly testing flow sensor response requires specialized equipment and procedures:
Test Equipment Requirements
- Flow generator: Capable of creating rapid, repeatable step changes in flow
- Reference sensor: With response time at least 5× faster than sensor under test
- Data acquisition system: Sampling rate at least 10× faster than expected response time
- Signal conditioning: Appropriate for sensor output type
- Analysis software: Capable of calculating response parameters
Standard Test Procedure
Test setup preparation
– Mount sensor according to manufacturer specifications
– Connect to data acquisition system
– Verify proper sensor operation at steady-state conditions
– Configure rapid-acting valve or flow controller
– Establish baseline flow conditionsStep change testing (increasing flow)
– Establish stable initial flow (typically zero or minimum)
– Record baseline output for at least 30 seconds
– Create rapid step increase in flow (valve opening time should be <10% of expected response time)
– Record sensor output at high sampling rate
– Maintain final flow until output fully stabilizes
– Repeat minimum 5 times for statistical validityStep change testing (decreasing flow)
– Establish stable initial flow at maximum test value
– Record baseline output for at least 30 seconds
– Create rapid step decrease in flow
– Record sensor output at high sampling rate
– Maintain final flow until output fully stabilizes
– Repeat minimum 5 times for statistical validityAnalyse der Daten
– Calculate average response parameters from multiple tests
– Determine standard deviation to assess consistency
– Compare to application requirements
– Document all results
Flow Sensor Response Time Comparison
| Sensor-Typ | Technologie | Typical T₉₀ Response | Beste Anwendungen | Beschränkungen |
|---|---|---|---|---|
| Thermal mass flow | Hot-wire/film | 1-5 seconds | Clean gases, low flow | Slow response, affected by temperature |
| Turbine | Mechanical rotation | 50-250 milliseconds | Clean liquids, medium flows | Moving parts, maintenance required |
| Vortex | Vortex shedding | 100-500 milliseconds | Steam, industrial gases | Minimum flow requirement |
| Differential pressure | Druckverlust | 100-500 milliseconds | General purpose, economical | Affected by density changes |
| Ultrasonic | Transit time | 50-200 milliseconds | Clean liquids, large pipes | Affected by bubbles/particles |
| Coriolis3 | Mass measurement | 100-500 milliseconds | High accuracy, mass flow | Expensive, size limitations |
| Bepto QuickSense | Hybrid thermal/pressure | 30-100 milliseconds | Critical applications, leak detection | Premium pricing |
Application-Specific Response Requirements
Different applications have specific response time requirements:
| Anmeldung | Erforderliche Reaktionszeit | Critical Factors |
|---|---|---|
| Leak detection | <100 milliseconds | Early detection prevents product loss and safety issues |
| Machine protection | <200 milliseconds | Must detect problems before damage occurs |
| Batch control | <500 milliseconds | Affects dosing accuracy and product quality |
| Process monitoring | <2 seconds | General trending and supervision |
| Billing/custody transfer | <1 second | Accuracy more important than speed |
Response Time Optimization Techniques
To improve flow sensor response time:
Sensor selection factors
– Choose inherently faster technologies when needed
– Select appropriate sensor size (smaller sensors typically respond faster)
– Consider direct immersion vs. tap-off installation
– Evaluate digital vs. analog output optionsInstallation optimization
– Minimize dead volume in sensor connections
– Reduce distance between process and sensor
– Eliminate unnecessary fittings or restrictions
– Ensure proper orientation and flow directionSignal processing improvements
– Use higher sampling rates
– Implement appropriate filtering
– Consider predictive algorithms for critical applications
– Balance noise rejection against response time
Case Study: Flow Response Time Optimization
I recently consulted with an automotive parts manufacturer in Michigan that was experiencing quality issues in their cooling system test stand. Their existing flow sensors weren’t detecting brief flow interruptions that were causing part failures in the field.
Die Analyse ergab:
- Existing sensor response time: 1.2 seconds
- Duration of flow interruptions: 200-400 milliseconds
- Critical detection threshold: 50% flow reduction
- Test cycle time: 45 seconds
By implementing Bepto QuickSense flow sensors with:
- Response time (T₉₀): 75 milliseconds
- Digital output with 1 kHz sampling
- Optimized installation position
- Custom signal processing algorithm
Die Ergebnisse waren beeindruckend:
- 100% detection of flow interruptions >100 milliseconds
- False positive rate <0.1%
- Test reliability improved to Six Sigma level
- Customer warranty claims reduced by 87%
- Annual savings of approximately $280,000
Which IP Protection Rating Do Your Pneumatic Sensors Need for Harsh Environments?
Selecting the appropriate IP (Ingress Protection) rating4 ensures sensors can withstand challenging environmental conditions without premature failure.
IP ratings define a sensor’s resistance to solid particle and liquid ingress using a standardized two-digit code. The first digit (0-6) indicates protection against solid objects, while the second digit (0-9) indicates protection against liquids. Properly matching IP ratings to environmental conditions dramatically improves sensor reliability and lifespan.
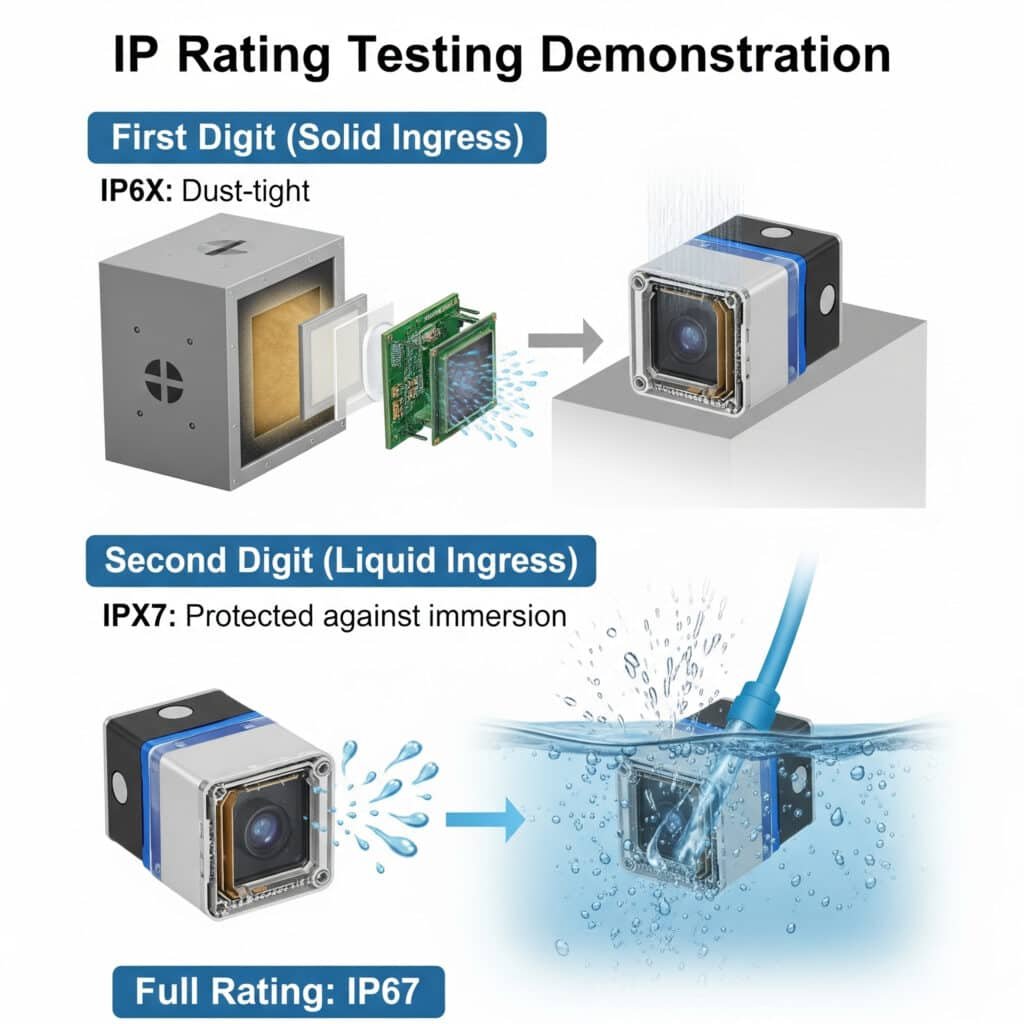
Understanding IP Rating Fundamentals
The IP (Ingress Protection) rating system is defined by IEC standard 60529 and consists of:
- IP prefix: Indicates the standard being used
- First digit (0-6): Protection against solid objects and dust
- Second digit (0-9): Protection against water and liquids
- Optional letters: Additional specific protections
Comprehensive IP Rating Reference Chart
| IP Rating | Solid Protection | Liquid Protection | Suitable Environments | Typische Anwendungen |
|---|---|---|---|---|
| IP00 | No protection | No protection | Clean, dry indoor environments | Laboratory equipment, internal components |
| IP20 | Protected against objects >12.5mm | No protection | Basic indoor environments | Control cabinet components |
| IP40 | Protected against objects >1mm | No protection | General indoor use | Panel-mounted displays, enclosed controls |
| IP54 | Dust protected (limited ingress) | Protected against splashing water | Light industrial, outdoor protected | General machinery, outdoor control boxes |
| IP65 | Dust tight (no ingress) | Protected against water jets | Washdown areas, outdoor exposed | Food processing equipment, outdoor sensors |
| IP66 | Dust tight (no ingress) | Protected against powerful water jets | High-pressure washdown | Heavy industrial equipment, marine applications |
| IP67 | Dust tight (no ingress) | Protected against temporary immersion (up to 1m for 30 minutes) | Occasional submersion, heavy washdown | Submersible pumps, washdown environments |
| IP68 | Dust tight (no ingress) | Protected against continuous immersion (beyond 1m, manufacturer-specified) | Continuous submersion | Underwater equipment, submersible sensors |
| IP69K5 | Dust tight (no ingress) | Protected against high-temp, high-pressure washdown | Steam cleaning, aggressive washdown | Food processing, pharmaceutical, dairy |
First Digit: Solid Particle Protection
| Level | Protection | Test Method | Effective Against |
|---|---|---|---|
| 0 | No protection | Keine | No protection |
| 1 | Objects >50mm | 50mm probe | Large body parts (hand) |
| 2 | Objects >12.5mm | 12.5mm probe | Fingers |
| 3 | Objects >2.5mm | 2.5mm probe | Tools, thick wires |
| 4 | Objects >1mm | 1mm probe | Most wires, screws |
| 5 | Dust protected | Dust chamber test | Dust (limited ingress permitted) |
| 6 | Dust tight | Dust chamber test | Dust (no ingress) |
Second Digit: Liquid Ingress Protection
| Level | Protection | Test Method | Effective Against |
|---|---|---|---|
| 0 | No protection | Keine | No protection |
| 1 | Dripping water | Dripping water test | Condensation, light drips |
| 2 | Dripping water (15° tilted) | 15° tilt test | Drips when tilted |
| 3 | Spraying water | Spray test | Rain, sprinklers |
| 4 | Splashing water | Splash test | Splashing from any direction |
| 5 | Water jets | 6.3mm nozzle test | Low-pressure washing |
| 6 | Powerful water jets | 12.5mm nozzle test | Heavy seas, powerful washing |
| 7 | Temporary immersion | 30min @ 1m immersion | Temporary flooding |
| 8 | Continuous immersion | Manufacturer-specified | Continuous submersion |
| 9K | High-temp, high-pressure jets | 80°C, 8-10MPa, 10-15cm | Steam cleaning, pressure washing |
Industry-Specific IP Rating Requirements
Different industries have specific environmental challenges requiring appropriate protection:
Food and Beverage Processing
- Typical requirements: IP65 to IP69K
- Environmental challenges:
– Frequent washdown with chemicals
– High-pressure hot water cleaning
– Potential food particle contamination
– Temperature fluctuations - Recommended minimum: IP66 for general areas, IP69K for direct washdown zones
Outdoor and Heavy Industrial
- Typical requirements: IP65 to IP67
- Environmental challenges:
– Exposure to weather conditions
– Dust and airborne particles
– Occasional water exposure
– Temperature extremes - Recommended minimum: IP65 for protected locations, IP67 for exposed positions
Automobilherstellung
- Typical requirements: IP54 to IP67
- Environmental challenges:
– Oil and coolant exposure
– Metal chips and dust
– Weld spatter
– Cleaning processes - Recommended minimum: IP65 for general areas, IP67 for coolant exposure areas
Chemische Verarbeitung
- Typical requirements: IP65 to IP68
- Environmental challenges:
– Corrosive chemical exposure
– Washdown requirements
– Potentially explosive atmospheres
– High humidity - Recommended minimum: IP66 with appropriate chemical resistance
Sensor Protection Beyond IP Ratings
While IP ratings address ingress protection, other environmental factors require consideration:
Chemische Beständigkeit
- Verify housing material compatibility with process chemicals
- Consider PTFE, PVDF, or stainless steel for chemical environments
- Evaluate gasket and seal materials
Temperature Considerations
- Verify operating and storage temperature ranges
- Consider thermal cycling effects
- Evaluate need for insulation or cooling
Vibration and Mechanical Protection
- Check vibration and shock specifications
- Consider mounting options to dampen vibration
- Evaluate cable strain relief and protection
Electromagnetic Protection
- Verify EMC/EMI immunity ratings
- Consider shielded cables and proper grounding
- Evaluate need for additional electrical protection
Case Study: IP Rating Selection Success
I recently worked with a dairy processing plant in California that was experiencing frequent sensor failures in their clean-in-place (CIP) system. Their existing sensors with IP65 ratings were failing after 2-3 months of service.
Die Analyse ergab:
- Daily cleaning with caustic solution at 85°C
- Weekly acid cleaning cycle
- High-pressure spray during manual cleaning
- Ambient temperature cycling from 5°C to 40°C
By implementing Bepto HygiSense sensors with:
- IP69K rating for high-temperature, high-pressure protection
- 316L stainless steel housing
- EPDM seals for chemical compatibility
- Factory-sealed cable connections
Die Ergebnisse waren signifikant:
- Zero sensor failures in over 18 months of operation
- Reduzierte Wartungskosten durch 85%
- System reliability improved to 99.8%
- Production uptime increased by 3%
- Annual savings of approximately $67,000
IP Rating Selection Guide by Environment
| Umwelt | Minimum Recommended IP Rating | Key Considerations |
|---|---|---|
| Indoor, controlled environment | IP40 | Dust protection, occasional cleaning |
| General industrial indoor | IP54 | Dust, occasional water exposure |
| Machine shop, light manufacturing | IP65 | Coolants, cleaning, metal chips |
| Outdoor, protected | IP65 | Rain, dust, temperature changes |
| Outdoor, exposed | IP66/IP67 | Direct weather exposure, potential submersion |
| Washdown environments | IP66 to IP69K | Cleaning chemicals, pressure, temperature |
| Submersible applications | IP68 | Continuous water exposure, pressure |
| Food processing | IP69K | Sanitation, chemicals, high-temperature cleaning |
Schlussfolgerung
Selecting the right pneumatic sensors requires understanding pressure switch calibration procedures, flow sensor response time testing methods, and appropriate IP protection ratings for your specific environment. By applying these principles, you can optimize system performance, reduce maintenance costs, and ensure reliable operation of your pneumatic equipment in any application.
FAQs About Pneumatic Sensor Selection
How often should pressure switches be calibrated in a typical industrial environment?
In typical industrial environments, pressure switches should be calibrated every 6-12 months. However, this frequency should be increased for critical applications, harsh environments, or if drift has been observed in previous calibrations. Some regulated industries may have specific requirements. Establish a calibration schedule based on manufacturer recommendations and your specific operating conditions, then adjust based on historical performance data.
What factors affect a flow sensor’s response time besides the sensor technology itself?
Beyond sensor technology, flow sensor response time is affected by installation factors (pipe diameter, sensor position, distance from flow disturbances), media characteristics (viscosity, density, temperature), signal processing (filtering, sampling rate, averaging), and environmental conditions (temperature fluctuations, vibration). Additionally, the magnitude of the flow change being measured impacts perceived response time—larger changes are typically detected more quickly than subtle variations.
Can I use a sensor with a lower IP rating if I add additional protection like an enclosure?
Yes, you can use a sensor with a lower IP rating inside an appropriate enclosure, provided the enclosure itself meets the environmental requirements and is properly installed. However, this approach introduces potential failure points at enclosure seals and cable entries. Consider the accessibility needs for maintenance, potential condensation issues inside the enclosure, and heat dissipation requirements. For critical applications, using sensors with appropriate native IP ratings is generally more reliable.
How does hysteresis in a pressure switch affect my pneumatic system performance?
Hysteresis in a pressure switch creates a buffer between activation and deactivation points, preventing rapid cycling when pressure fluctuates around the setpoint. Too little hysteresis can cause “chattering” (rapid on/off cycling), which damages both the switch and connected equipment while creating unstable system performance. Too much hysteresis can result in excessive pressure variation in the system. Optimal hysteresis settings balance stability against pressure control precision based on your specific application requirements.
What is the difference between IP67 and IP68 ratings, and how do I know which one I need?
Both IP67 and IP68 provide complete protection against dust ingress, but differ in water protection: IP67 protects against temporary immersion (up to 30 minutes at 1 meter depth), while IP68 protects against continuous immersion at depths and durations specified by the manufacturer. Choose IP67 for applications where occasional, brief submersion might occur. Choose IP68 when equipment must operate reliably while continuously submerged. If submersion depth and duration are specified for your application, match these requirements to the manufacturer’s IP68 specifications.
How can I verify if my flow sensor is responding quickly enough for my application?
To verify flow sensor response time adequacy, compare the sensor’s specified T₉₀ response time (time to reach 90% of final value) against your application’s critical time window. For precise verification, conduct step-change testing using a high-speed data acquisition system (sampling at least 10× faster than expected response time) and a rapid-acting valve. Create sudden flow changes similar to those in your application while recording sensor output. Analyze the response curve to calculate actual response parameters and compare to application requirements.
-
Provides a clear definition of hysteresis in the context of sensors and control systems, explaining it as the phenomenon where the output at a specific input point depends on whether that point was approached with an increasing or decreasing input. ↩
-
Describes Industry 4.0, also known as the fourth industrial revolution, which refers to the ongoing automation of traditional manufacturing and industrial practices using modern smart technology like the Internet of Things (IoT), cloud computing, and AI. ↩
-
Explains the operating principle of Coriolis flow meters, which use the Coriolis effect to measure mass flow rate directly by vibrating a tube through which the fluid passes and measuring the resulting twist. ↩
-
Details the international standard IEC 60529, which classifies the degrees of protection provided by mechanical casings and electrical enclosures against intrusion, dust, accidental contact, and water. ↩
-
Provides specific information on the IP69K rating, which is the highest level of protection defined by the ISO 20653 and DIN 40050-9 standards, signifying protection against high-pressure, high-temperature washdowns. ↩
