

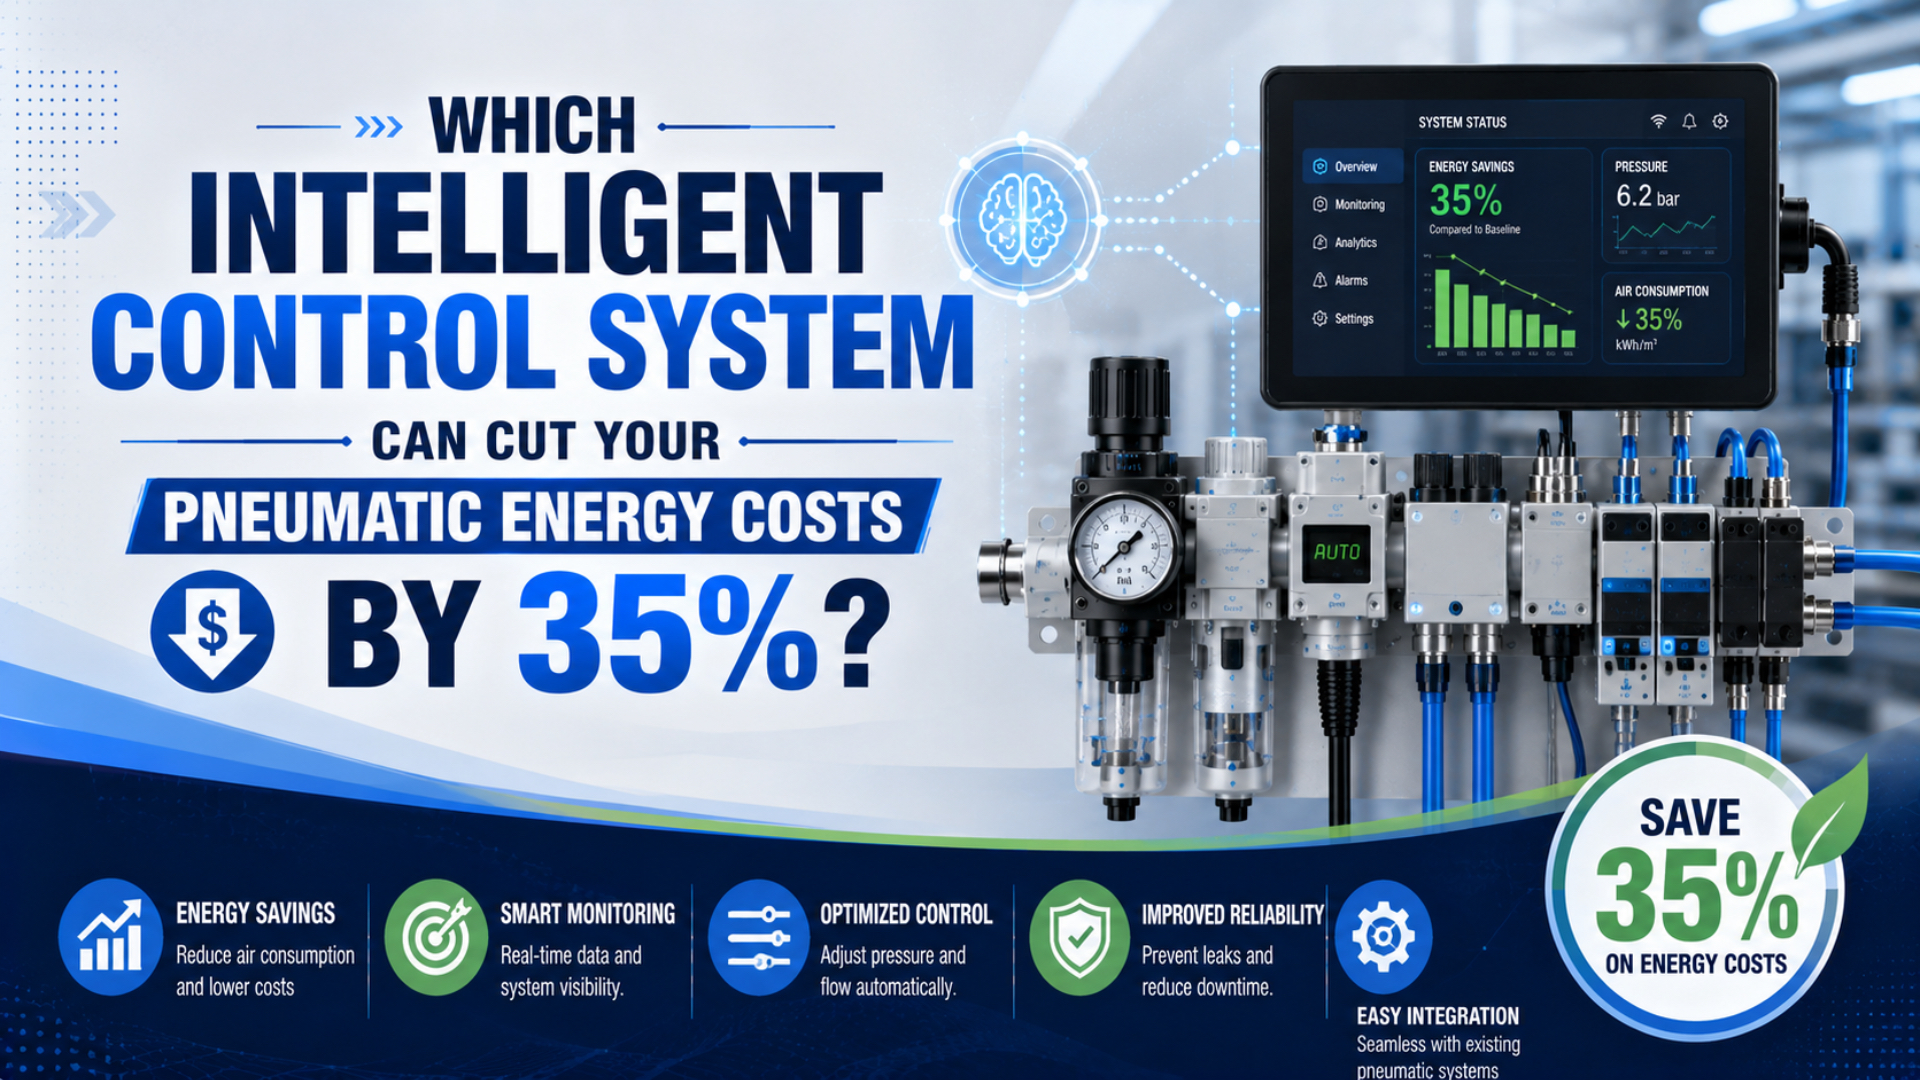
The intelligent control system most likely to support a 35% pneumatic energy-cost target is a closed-loop demand-management architecture, not a single protocol, gateway, or digital twin. It measures compressor power, air flow, pressure, machine state, and production output; then it acts through zone isolation, pressure control, end-use shutoff, and compressor sequencing.
Treat 35% as a target to verify, not a guaranteed product result. The U.S. Department of Energy says a repeatedly modified compressed-air system maintained mainly to keep running can often save 20% to 50% or more, but the result depends on the waste present and the actions taken (U.S. DOE, Improving Compressed Air System Performance, 2016).
Key Takeaways
- Protocols expose data. They do not save air by themselves.
- Treat 35% as a measured project target, not a catalog promise.
- Start with comparable power, flow, pressure, operating-state, and production baselines.
- Keep time-critical action in deterministic controls; use IO-Link for devices and OPC UA or MQTT for governed data exchange.
Which Intelligent Control Architecture Can Realistically Support a 35% Target?
DOE reports 20% to 50% or greater savings potential in neglected compressed-air systems, but ties the result to a systems approach, not one smart component (U.S. DOE Sourcebook, 2016). A defensible 35% project needs measurement, physical action, and post-change verification.
Close this four-step loop:
- Measure: log package power, standardized flow, pressure, machine state, and production on one time base.
- Diagnose: separate productive demand from leaks, idle flow, artificial demand, restriction-caused pressure loss, and compressor states that consume power without useful output.
- Act: isolate zones, change validated setpoints, or modify compressor sequencing.
- Verify: compare reporting energy with a production-adjusted baseline, then confirm that safety, quality, force, cycle time, reliability, and restart behavior remain acceptable.
Monitoring dashboards complete only the first two steps. They may reveal waste, but they cannot save air until a person or controller changes a valve, setpoint, operating schedule, or compressor state.
This distinction prevents a common procurement mistake: buying more data without assigning an actuator, control owner, acceptance limit, and verification method to each alarm. Write the specification as “when this measured condition occurs, take this bounded action and prove the energy response,” not “connect 50 smart devices.”
For broader opportunity screening, use the seven-system pneumatic energy guide. The pneumatic energy-conversion guide explains the physical loss boundary. This article stays focused on the control architecture that turns those opportunities into repeatable actions.
Control Layers: From Field Devices to Enterprise Systems
IO-Link supports three standard communication rates: 4.8, 38.4, and 230.4 kbaud, and it provides bidirectional process data, parameters, identification, and diagnostics for sensors and actuators (IO-Link Community, accessed 2026). Those functions make IO-Link useful at the field layer, but they do not replace the machine controller or plant energy strategy.
Machine safety must not depend on the historian, edge computer, or enterprise network being available. Keep interlocks, emergency functions, position sequences, and time-critical pressure control in the deterministic controller designed for that task.
OPC UA is suited to structured information exchange across embedded devices, PLCs, servers, and enterprise systems. Its architecture includes authentication, encryption, auditing, subscriptions, and information modeling (OPC Foundation, accessed 2026). MQTT is a publish-subscribe messaging standard; it can transport selected events or measurements, but the topic structure, payload meaning, security, and command authority still require engineering (MQTT.org, accessed 2026).
Which Actions Actually Reduce Compressed-Air Energy?
DOE estimates a 2 psi pressure reduction near 100 psig can lower energy use about 1% to 1.6% when unregulated demand is 30% to 50% and process needs remain satisfied (U.S. DOE Sourcebook, 2016). Control must act on measured waste.
| Control action | Required measurements | Physical action | Acceptance check |
|---|---|---|---|
| Idle-zone isolation | Machine state, shift schedule, downstream pressure | Close a monitored soft-start or isolation valve | Safe exhaust state and correct restart |
| Pressure optimization | Inlet and point-of-use pressure during peak flow | Reduce a validated regulator or header setpoint | Force, speed, quality, and stability |
| Leak and abnormal-flow response | Off-cycle flow, pressure decay, valve state | Create repair work or isolate a confirmed idle branch | Recheck flow after repair |
| Recipe-based pressure | Product code, load, pressure, motion result | Select an approved pressure setpoint | Every product variant passes |
| Compressor coordination | Package kW, flow, pressure, load state | Change base, trim, standby, or stop sequence | Stable pressure with lower kWh |
Do not add the percentage estimates from these projects and call the sum a verified result. Pressure reduction changes leakage and open-flow demand. Leak repair changes compressor loading. Storage changes how controls respond. Measure the combined system after the interacting changes.
Zone isolation often provides a clearer first automation project than a complex model. If a cell consumes air during breaks, nights, or product changeovers, a controller can close a monitored valve only after the machine reaches a defined safe state. Compare off-state flow before and after the change, then confirm restart behavior.
Pressure optimization requires more care. Record dynamic pressure at the critical actuator or tool during its highest simultaneous demand. Fix restrictions before lowering the source setpoint. The pressure-drop troubleshooting guide explains how filters, tubing, fittings, valves, and exhaust restrictions can hide behind an apparently low-pressure complaint.
How Should You Choose IO-Link, MQTT, and OPC UA?
IO-Link defines three device communication rates, while OPC UA spans embedded-to-enterprise information exchange and MQTT supplies publish-subscribe messaging (IO-Link Community; OPC Foundation; MQTT.org). These technologies solve different layers of the problem, so a single “best protocol” ranking would be technically misleading.
Choose the protocol after defining the data owner and decision path:
| Requirement | Appropriate starting point | Why |
|---|---|---|
| Read a pressure sensor and parameterize it | IO-Link device and master | Point-to-point field data, identification, diagnostics, and parameters |
| Execute a valve or pressure sequence | PLC or deterministic controller | Predictable control cycle and local fail behavior |
| Expose structured machine information | OPC UA | Information models, subscriptions, security, and cross-platform access |
| Send selected events to an analytics service | MQTT | Lightweight publish-subscribe transport through a broker |
| Store energy history | Historian or energy-management database | Retention, timestamps, auditability, and reporting |
Protocol conversion is not semantic integration. Gateways can move a number from one network to another, but the receiving system still needs its unit, reference conditions, timestamp quality, operating state, and engineering meaning. Without standard-condition metadata, one flow value can corrupt both energy calculations and leak alarms.
OPC UA and IO-Link can be connected through a defined information model for IO-Link masters and devices (OPC Foundation, OPC 30120, accessed 2026). Use that kind of documented mapping when several vendors must exchange device identity, process values, parameters, and diagnostics.
What Should an Edge Controller Be Sized For?
NIST SP 800-82 Revision 3 treats industrial control and measurement systems as operational technology with distinct performance, reliability, and safety requirements (NIST, 2023). Select an edge controller from its verified workload and failure behavior, not a generic dual-core or 4 GB recommendation.
Build the hardware specification from the workload:
- Count incoming signals, sample rates, timestamp accuracy, and protocol overhead.
- Separate continuous calculations from event-driven analytics. Include the worst simultaneous workload, not the average dashboard load.
- Size local history for the longest credible network outage.
- Set a maximum delay for each approved action, then keep functions that need deterministic response in the PLC.
- Document storage redundancy, watchdogs, secure boot, signed updates, network interfaces, and recovery behavior only where the risk assessment requires them.
- Verify the complete installation boundary: temperature, vibration, ingress, power quality, electromagnetic conditions, mounting space, cooling, operating-system support, replacement availability, and security-patch ownership throughout the expected service life.
Keep cloud loss and edge-computer failure inside the hazard and operability review. Depending on process risk, a safe default may hold the last approved setpoint, return supervisory optimization to manual mode, or block new remote commands as the PLC continues normal production.
Cybersecurity belongs in the design, not in a final checklist. Define network zones, permitted data flows, identities, certificates or credentials, update ownership, backups, logging, and recovery tests before connecting pneumatic controls to an enterprise network. Remote write access should be narrower than read access and should never bypass machine safety logic.
When Does a Digital Twin Earn Its Complexity?
NIST organizes its advanced-manufacturing digital-twin work around three research areas: implementation and testing methods, standards development, and a validation testbed (NIST, Digital Twins for Advanced Manufacturing, accessed 2026). That emphasis on verification, validation, and uncertainty is stronger than assigning a universal accuracy percentage to every pneumatic model.
Use a digital twin when a synchronized model changes a recurring decision that simpler trends or rules cannot resolve. Suitable cases include:
- Compare pressure-control strategies before commissioning.
- Model the interaction between storage, compressor sequencing, and variable demand when a static calculation cannot represent the operating states.
- Test a large recipe set against pressure and cycle-time limits before production trials.
- Diagnose a dynamic problem that ordinary historical trends cannot separate from product mix or machine state.
Do not build a full digital twin merely to display pressure and flow. For basic monitoring, a historian, state model, and clear alarm logic may solve the task with less maintenance.
ISO 23247-2 provides a manufacturing digital-twin reference architecture, but the acceptance criteria still come from the intended decision (ISO 23247-2:2021). NIST’s credibility work likewise calls for verification, validation, and uncertainty quantification throughout the model lifecycle rather than one universal error band (NIST, Credibility Consideration for Digital Twins in Manufacturing, 2022).
Specify the consequence of model error before specifying fidelity. An energy-planning model may be accepted when it ranks projects correctly within a documented uncertainty range. Models that write pressure setpoints need tighter limits, bounded authority, independent process checks, and a safe fallback. Let decision risk determine the validation burden.
How Do You Verify a 35% Energy-Cost Reduction?
ISO 11011 divides a compressed-air assessment into three functional subsystems: supply, transmission, and demand, and it requires the assessment to follow energy input through useful work and waste (ISO 11011:2013). Verify the 35% target across that whole boundary rather than at one smart valve or sensor.
Establish a baseline before enabling optimization. DOE recommends measuring power, pressure, flow, temperature, and leak load under different operating conditions, then correlating energy with production (U.S. DOE Sourcebook, 2016).
Use an adjusted energy baseline:
Here, is verified energy savings, is baseline electricity adjusted to reporting-period production and operating conditions, and is reporting-period electricity. Comparable, documented data meet the target when they produce without violating production, quality, safety, or reliability criteria.
Convert verified kWh reduction into cost with the applicable tariff. If demand charges, time-of-use rates, or production schedules changed, calculate their effects separately. Do not claim the full avoided-air estimate as utility savings unless compressor package power and billed energy respond.
See the 42% cost-and-sustainability planning guide for the normalized baseline and project register. For individual leaks, use the compressed-air leak detection guide before aggregating the result at the system meter.
Implementation Plan: Pilot Before Plant-Wide Rollout
DOE’s baseline method uses five evidence groups: power, pressure, flow, temperature, and leak load, correlated with production (U.S. DOE Sourcebook, 2016). A pilot should prove that this data can drive one safe control action before the architecture expands across the plant.
Use a staged acceptance plan:
- Choose one bounded use case. Off-shift isolation is often easier to verify than plant-wide optimization.
- Record the existing condition. Capture normal production, idle periods, peak demand, changeovers, and fault recovery over a representative interval.
- Define action limits. Name who can change each setpoint and document the maximum adjustment, interlocks, safe state, manual override, and rollback trigger.
- Implement locally. Keep action in deterministic controls.
- Test faults before production acceptance. Interrupt the sensor, device network, edge computer, historian, and enterprise connection separately; record the response, operator indication, fallback state, and recovery procedure.
- Verify production before energy. Confirm safety, quality, force, speed, and restart behavior, then compare normalized energy over the agreed reporting period.
- Scale with a reusable template. Standardize names, units, timestamps, alarm classes, security ownership, evidence retention, and acceptance records across the next machines.
Procure the project around evidence and outcomes. RFQ requirements should identify meters and accuracy classes, reference conditions for flow, available control interfaces, network ownership, cybersecurity responsibilities, retention time, fail behavior, commissioning tests, and the method used to accept energy savings.
Intelligent Pneumatic Control FAQs
ISO 11011 evaluates compressed air across three subsystems, while NIST’s OT guidance covers programmable systems that monitor and control physical processes (ISO 11011; NIST SP 800-82 Rev. 3). Together, these boundaries keep energy, controls, communications, and risk in one engineering decision.
Can an existing pneumatic system be retrofitted with intelligent control?
Yes, when the plant can add suitable measurement and bounded control authority without defeating the machine’s safety design. Typical retrofits add branch flow and pressure sensing, monitored isolation valves, controller logic, or a protocol gateway. Start with one measurable loss and confirm electrical, pneumatic, network, and restart requirements before expanding.
Does IO-Link itself reduce compressed-air consumption?
No. IO-Link transfers process values, identification, diagnostics, and parameters between a device and master. Savings occur only when that information triggers a verified action such as isolating an idle zone, correcting a setpoint, scheduling maintenance, or changing a compressor state. Without an action path, the connected sensor remains a monitoring device.
Should MQTT or OPC UA control pneumatic motion directly?
Time-critical motion and safety-related behavior should remain in the deterministic controller designed and validated for the machine. OPC UA can expose structured information and approved commands; MQTT can transport selected messages. Neither should create an undocumented remote path around PLC interlocks, local fallback behavior, access control, or machine risk assessment.
Is a digital twin required to reach a 35% savings target?
No. Many projects can verify savings with calibrated meters, state-based logic, a historian, and production normalization. Add a digital twin when model-based prediction changes a recurring decision that simpler rules cannot solve. Its accuracy and update rate should be validated against that intended decision, not copied from a generic percentage table.
What data proves that the intelligent control project worked?
Use comparable before-and-after records for compressor package kWh, standardized air flow, pressure profiles, operating states, pressurized hours, and production output. Document the assessment boundary, baseline adjustment, control changes, tariff treatment, and process acceptance results. Plant-level energy-cost savings cannot be proven by a component dashboard alone.
Sources and technical references
- U.S. Department of Energy, Improving Compressed Air System Performance: A Sourcebook for Industry, Third Edition, retrieved 2026-07-27: energy.gov PDF
- ISO, ISO 11011:2013 Compressed air - Energy efficiency - Assessment, retrieved 2026-07-27: ISO 11011
- IO-Link Community, IO-Link Technology, retrieved 2026-07-27: io-link.com
- OPC Foundation, Unified Architecture, retrieved 2026-07-27: OPC UA
- NIST, Guide to Operational Technology Security: NIST Publishes SP 800-82, Revision 3, retrieved 2026-07-27: nist.gov
- NIST, Digital Twins for Advanced Manufacturing, retrieved 2026-07-27: nist.gov