

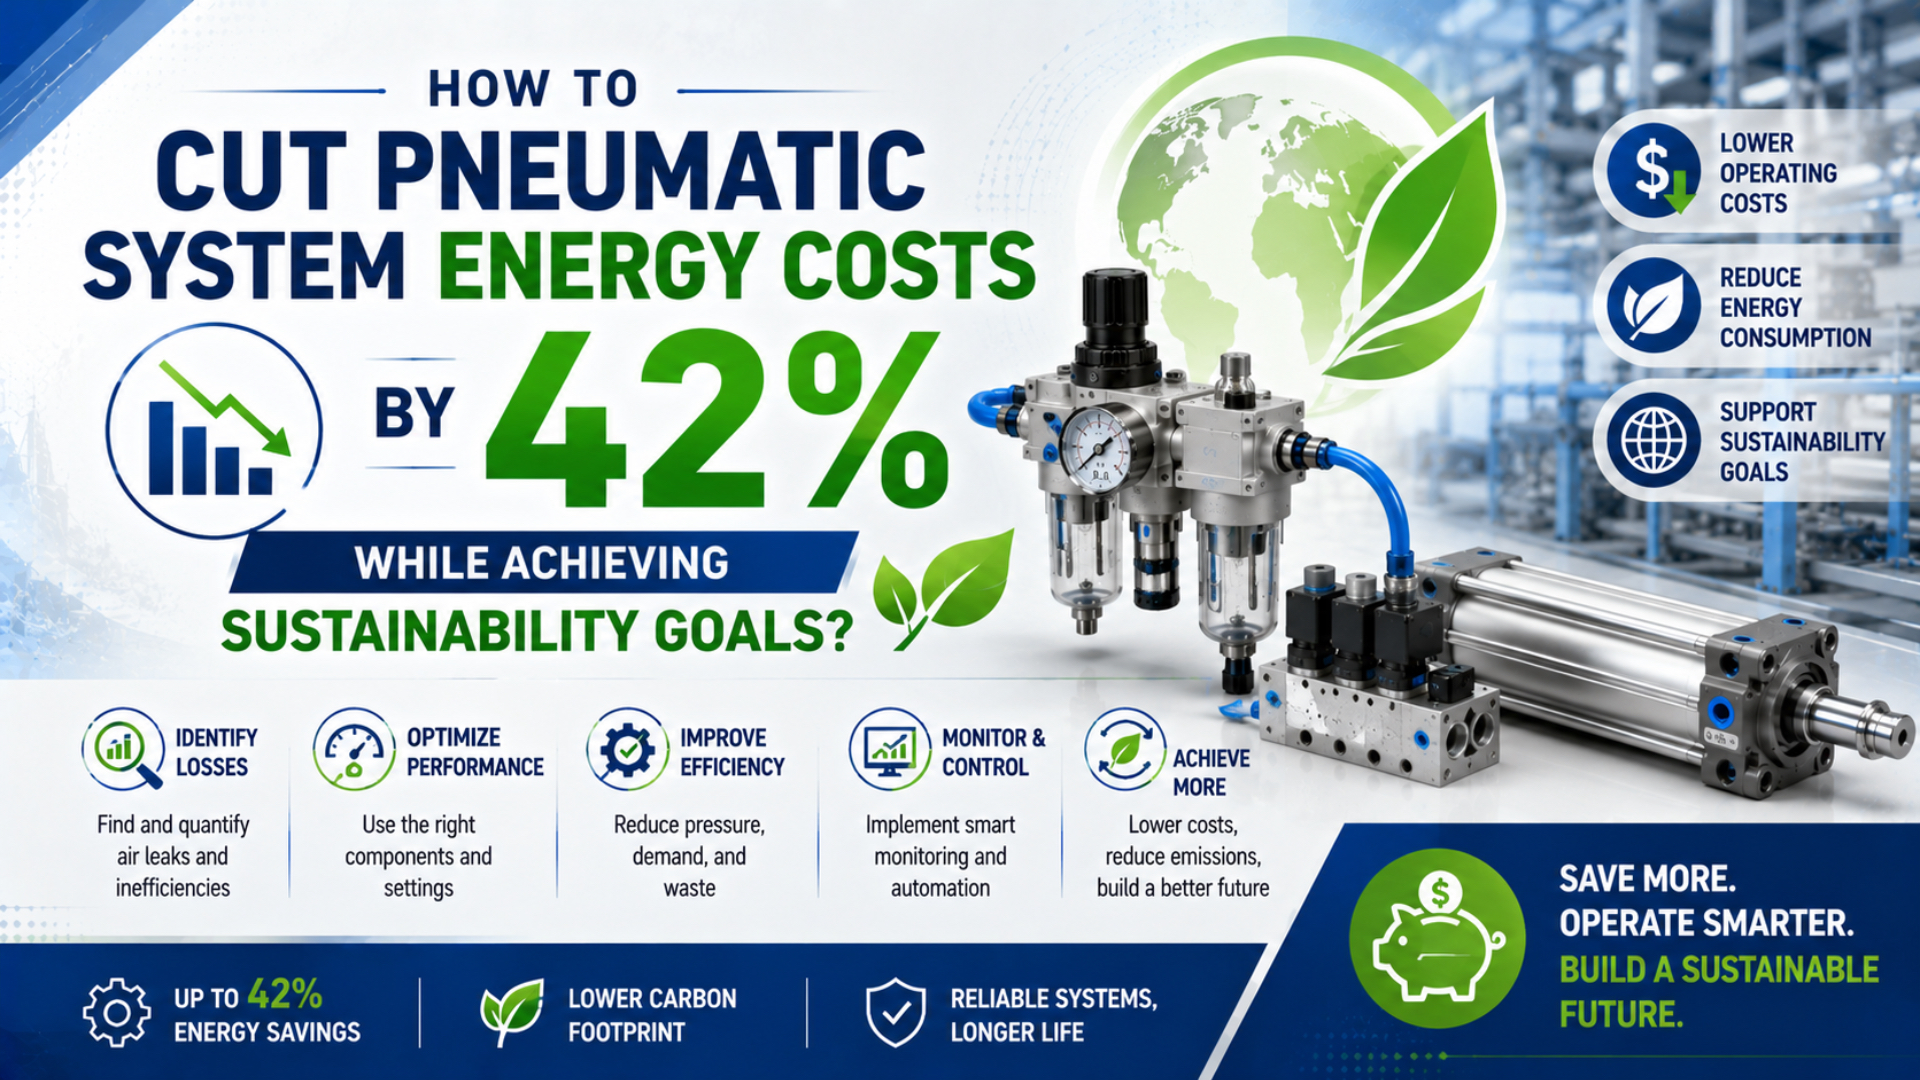
Cutting pneumatic system energy costs by 42% is possible only when the plant has enough verified waste to remove and measures the result against an adjusted baseline. The U.S. Department of Energy says a repeatedly modified system maintained mainly to keep running can often save 20% to 50% or more, but that range is not a guarantee for any individual facility (U.S. DOE, Improving Compressed Air System Performance, 2016).
Treat 42% as a site-specific target. Establish power, pressure, flow, operating-state, and production baselines first. Then reduce demand, correct pressure and control problems, remeasure the whole system, and convert only the verified kilowatt-hour reduction into cost and greenhouse-gas results.
Key Takeaways
- DOE reports 20% to 50% savings can be possible in neglected, repeatedly modified systems.
- Measure power, pressure, flow, leak load, and production before forecasting savings.
- Do not add overlapping project estimates and call the sum verified.
- Use the same metered electricity reduction for both cost and Scope 2 emissions.
Is a 42% Pneumatic Energy-Cost Reduction Realistic?
DOE places the potential improvement range at 20% to 50% or more for compressed-air systems that have been repeatedly modified and minimally maintained (U.S. DOE Sourcebook, 2016). A 42% target therefore fits inside a published opportunity range, but only measured site data can prove it.
The distinction is essential. A target is a management commitment. A forecast is an engineering estimate. A verified result compares an adjusted baseline with reporting-period energy under defined production and environmental conditions.
Verified energy savings are the difference between an adjusted baseline and reporting-period energy within the same documented boundary and acceptance conditions.
Use this savings equation:
Here, is verified energy savings as a percentage, is baseline electricity adjusted to reporting-period conditions in kWh, and is reporting-period electricity in kWh. If the adjusted baseline is 100 energy-index units and the reporting value is 58, the calculated reduction is 42%.
The title’s 42% is best treated as an acceptance criterion, not a bundle of assumed percentages. That framing changes the project question from “Which upgrades add up to 42%?” to “What evidence proves that normalized system energy fell from the baseline by 42%?”
What Baseline Data Does a Compressed-Air Audit Need?
DOE’s baselining guidance calls for power, pressure, flow, and temperature measurements under different operating conditions, plus an estimate of leak load and correlation with production (U.S. DOE Sourcebook, 2016). A utility bill alone cannot show where pneumatic energy is being lost.
Define the assessment boundary before installing meters. ISO 11011 divides a compressed-air system into supply, transmission, and demand subsystems and requires an assessment to consider energy input through the work performed (ISO 11011:2013, confirmed 2020).
An adjusted energy baseline is a reference model recalculated for reporting-period production, schedule, weather, or other relevant variables rather than an uncorrected historical bill.
| Measurement | Minimum evidence | Decision it supports |
|---|---|---|
| Compressor package power | Logged kW for loaded, unloaded, stopped, and part-load states | Annual energy and control efficiency |
| Main flow | Standardized flow with documented reference conditions | System specific power and demand profile |
| Pressure profile | Compressor discharge, treatment stages, headers, and critical end uses | Pressure loss and minimum viable setpoint |
| Operating states | Compressor sequence, unload time, blow-off, dryer purge, and shutdown status | Control and off-shift waste |
| Production driver | Parts, machine hours, tonnes, or another relevant output | Normalized energy baseline |
| Leak load | Non-production flow, compressor duty method, or receiver decay test | Repair priority and post-repair verification |
Specific power is the compressor-system input power required to deliver a stated standardized flow at a stated pressure:
Here, is specific power, is measured package input in kW, and is delivered flow at documented normal or standard reference conditions. Never compare two specific-power values until their pressure, flow reference, treatment boundary, and included auxiliaries match.
Normalize energy to the production driver when output changes:
is energy intensity, is electrical energy in kWh, and is the selected production or service unit. Use both absolute kWh and normalized intensity. A lower kWh total caused by reduced production is not an efficiency improvement.
Where Should a Plant Look for the Largest Savings First?
DOE says leaks can waste 20% to 30% of compressor output and recommends a cost-effective leak target around 5% to 10% of total system flow (U.S. DOE, Minimize Compressed Air Leaks, 2004). Leakage is a strong first check, but it is not the only demand-side loss.
Rank opportunities by measured annual kWh, production risk, implementation cost, and interaction with compressor controls:
| Opportunity | Evidence to collect | Corrective action | Verification |
|---|---|---|---|
| Leaks and idle flow | Off-shift flow, acoustic survey, repair log | Repair, isolate idle zones, verify closures | Compare non-production flow and compressor run time |
| Excess pressure | Header and point-of-use pressure profiles | Correct local restrictions, then lower setpoint carefully | Confirm minimum end-use pressure and package kW |
| Poor compressor sequencing | Loaded and unloaded kW by machine | Reset sequence, control band, or trim strategy | Compare specific power across the demand profile |
| Distribution loss | Differential pressure at maximum flow | Resize restrictions and service treatment equipment | Recheck peak pressure profile |
| Inappropriate end uses | Branch flow and duty duration | Replace open blowing, cooling, or vacuum generation where justified | Meter the affected branch |
| Oversized pneumatic functions | Bore, stroke, cycle rate, load, and pressure | Right-size actuators or regulate individual functions | Compare cycle air and production acceptance |
DOE gives a limited rule of thumb for systems near 100 psig: reducing discharge pressure by 2 psi lowers full-output energy about 1%, with another 0.6% to 1.0% possible when 30% to 50% of demand is unregulated (U.S. DOE Sourcebook, 2016). Check actual compressor curves and end-use pressure before applying that estimate.
The same source recommends pressure loss well below 10% from compressor discharge to the point of use, with main distribution lines designed for roughly 1% to 2% maximum loss. Fix restrictions before raising the compressor setpoint. The compressed-air pressure-drop guide explains how to separate piping, filter, valve, fitting, and hose losses.
In our application reviews, we found that a high header-pressure request often begins with one restricted filter, undersized hose, or short peak-flow event at the machine. Logging pressure on both sides of the suspect component is more useful than raising the plant setpoint and increasing every unregulated demand.
For cylinders, measure cycle demand rather than assuming the installed bore is necessary. The cylinder air-consumption guide connects bore, stroke, pressure, and cycle rate, while the double-acting cylinder consumption article covers extension and retraction volume separately.
Compressed air used for cleaning also has a safety boundary. OSHA permits it only below 30 psi and with effective chip guarding and personal protective equipment (OSHA 1910.242(b), accessed 2026). That rule does not make an open blow-off energy-efficient; evaluate engineered nozzles or another method.
How Do You Build a Defensible 42% Savings Plan?
DOE’s 20% to 50% opportunity range is broad because each plant begins with different leakage, controls, pressure, production, and maintenance conditions (U.S. DOE Sourcebook, 2016). Build the 42% plan from measured project boundaries and a system model, not generic percentages copied from separate sources.
Start with a savings register:
| Project | Baseline variable | Reporting variable | Interaction to control |
|---|---|---|---|
| Leak repair | Leak flow and pressurized hours | Verified post-repair flow | Compressor controls must unload or stop |
| Pressure optimization | Header pressure, unregulated flow, package kW | Lower stable pressure and kW | Leak and blow demand changes with pressure |
| Sequencing | Individual compressor state and power | New sequence power profile | Demand reductions change trim-machine loading |
| Distribution repair | Differential pressure at peak flow | Lower differential at equal flow | May permit a lower discharge setpoint |
| End-use redesign | Branch flow per accepted cycle | New cycle flow and quality result | Production rate and load must remain equivalent |
Do not add independent percentages. Leak repair can reduce flow, which changes compressor loading. A lower pressure also reduces leakage. Better sequencing can turn both changes into electrical savings. If every estimate uses the original baseline, the sum counts some energy more than once.
Use a sequential energy index to test the target without pretending the example predicts a plant. An illustrative register might move from 100 baseline units to 88 after control changes, 76 after verified leak repair, 68 after pressure and distribution work, and 58 after end-use changes. The result is 42%, but each reporting value still requires a meter.
Annual energy cost under a simple tariff is:
is annual electricity cost, is energy consumed in tariff period , is the applicable energy rate, is measured demand-charge cost, and contains fixed charges assigned under the project’s accounting rule. DOE advises using the actual marginal electricity cost, including demand, season, and time-of-use effects.
Quantify a repair queue with the Compressed Air Leak Cost Calculator. For a system-level check without a flow meter, the Pressure Decay Leak Rate Calculator can estimate isolated leakage from receiver volume, absolute pressure change, and test time.
How Should Energy Savings Be Measured and Verified?
ISO 50015:2014, reconfirmed in 2025, establishes general principles for measurement and verification of organizational energy performance (ISO 50015:2014, confirmed 2025). It does not award savings for installing equipment. The claim depends on a defined boundary, a valid baseline, reporting data, and transparent adjustments.
Write the M&V plan before implementation:
- Define the system boundary and excluded loads.
- Name every meter, location, interval, calibration status, and unit.
- Select baseline and reporting periods that represent normal operation.
- Record production, schedule, ambient conditions, pressure, and other relevant variables.
- Define how baseline energy will be adjusted when those variables change.
- Set production, pressure, air quality, and reliability acceptance limits.
- State how missing data, shutdowns, abnormal production, and meter failure will be handled.
- Require post-project persistence checks rather than one favorable day.
ISO 50006:2023 provides guidance for establishing and maintaining energy performance indicators and energy baselines (ISO 50006:2023, 2023). For compressed air, useful EnPIs include package specific power at stated pressure, kWh per production unit, non-production flow, and pressure loss at a defined peak flow.
An adjusted baseline can be expressed as:
is the documented baseline model, represents production, and can represent temperature and operating hours, and can represent a relevant pressure condition. Include only variables that materially affect consumption and can be measured consistently. Publish the model form, coefficients, valid range, and uncertainty with the result.
Set a dual acceptance test. Energy must improve, but production must still pass. Confirm cycle time, point-of-use pressure, air quality, product quality, equipment temperature, fault behavior, and maintenance load. A reduction caused by starving actuators or stopping production is not a successful energy project.
How Do Verified kWh Savings Become Cost and Carbon Results?
EPA’s 2025 GHG Emission Factors Hub updated purchased-electricity factors from eGRID and added regional grid-loss percentages for a Scope 3 transmission-and-distribution calculation (U.S. EPA GHG Emission Factors Hub, 2025). Use the factor that matches the reporting boundary, geography, year, and accounting method.
For location-based operational emissions:
is purchased-electricity emissions in kg CO2e, is metered electricity in kWh, and is the applicable grid factor in kg CO2e/kWh. The avoided operational emissions use verified saved kWh multiplied by the consistently selected factor.
Do not add a separate “leak emissions” percentage when compressor electricity already includes the energy used to supply those leaks. Repairing leaks reduces metered electricity; that kWh change already carries the operational emissions effect. Separate embodied equipment, refrigerant, maintenance, and end-of-life impacts only when the inventory boundary and data sources require them.
The GHG Protocol Scope 2 Guidance standardizes accounting for purchased electricity and sets quality criteria for contractual instruments used in market-based reporting. Keep location-based and market-based results distinct. Renewable energy certificates can change market-based reporting, but they do not prove that the pneumatic system used less energy.
Cost follows the utility tariff, not carbon intensity. Report energy-charge, demand-charge, and fixed-charge effects separately. Load shifting may reduce cost without reducing kWh, while a physical efficiency measure can reduce both. This separation prevents a tariff saving from being presented as an energy or emissions reduction.
ISO 50001 as the Control Loop
ISO 50001:2018 was reconfirmed in 2024 and has one 2024 amendment; it uses the Plan-Do-Check-Act model to improve energy performance (ISO 50001:2018, confirmed 2024). The standard supplies a management framework. It does not prescribe a compressor, guarantee a percentage, or replace the compressed-air assessment.
| PDCA stage | Compressed-air application |
|---|---|
| Plan | Define the boundary, significant energy uses, baseline, EnPIs, 42% target, responsibilities, and project register |
| Do | Repair leaks, correct controls, reduce restrictions, optimize pressure, redesign end uses, and train operators |
| Check | Compare adjusted baseline and reporting energy, review production acceptance, and investigate deviations |
| Act | Lock in setpoints, update maintenance triggers, revise procedures, and select the next measured opportunity |
ISO 11011 supplies the compressed-air system assessment structure. ISO 50006 supports EnPIs and baselines. ISO 50015 supports M&V. ISO 50001 connects those technical practices to objectives, operational control, management review, and continual improvement.
Change control matters. A new production cell, altered dryer setting, bypassed regulator, added blow-off, or changed shift pattern can erase savings without appearing as a component failure. Add an energy review to pneumatic design changes and use the system design guide when capacity or distribution changes are proposed.
A Production-Ready 42% Verification Checklist
DOE’s compressed-air analysis tip sheet gives a seven-step action plan: map the system, measure the baseline, set controls, remeasure, inspect maintenance needs, correct leaks and inappropriate uses, and continue improving (U.S. DOE, Analyzing Your Compressed Air System, 2004). Turn that sequence into release evidence.
- The electrical and pneumatic assessment boundary is documented.
- Package power, main flow, pressure profile, temperature, and operating states are logged.
- Energy is correlated with the selected production driver.
- Leak load and non-production demand are measured.
- Pressure and air-quality limits are tied to valid end-use requirements.
- Project estimates identify interactions and avoid double counting.
- Baseline adjustment rules and uncertainty are approved before implementation.
- Reporting-period energy and production acceptance are complete.
- Cost uses the applicable tariff and carbon uses the selected reporting factor.
- New setpoints, isolation rules, maintenance triggers, and review ownership are controlled.
David Li prepared this energy-efficiency framework for Bepto Pneumatic. For a system review, provide the compressor list, logged kW and flow, pressure profile, operating schedule, production driver, electricity tariff, non-production demand, and proposed acceptance limits through the contact page.
Pneumatic Energy-Cost FAQs
DOE says leaks can waste 20% to 30% of compressor output and gives 5% to 10% of total system flow as a typical cost-effective leakage target (U.S. DOE leak guidance, 2004). The practical questions below focus on proving savings without compromising production.
Does lowering compressor pressure always save energy?
Lower pressure usually reduces compressor work and unregulated demand, but only if every critical end use still receives its required pressure during peak flow. Measure the pressure profile first, correct local restrictions, and review storage and controls. DOE’s 100 psig rule of thumb is not a substitute for the selected compressor’s performance curve.
Can leak-survey estimates be added directly to pressure savings?
No. Leakage changes with pressure, and repaired demand changes compressor loading and sequencing. Adding two independent estimates can count the same energy twice. Model the interaction, then verify system kWh after controls have been adjusted to the lower flow. Keep leak flow as diagnostic evidence, not a second electricity meter.
Is a 42% cost reduction the same as a 42% energy reduction?
Not necessarily. Time-of-use rates, demand charges, fixed charges, and production schedules can change cost independently of kWh. Report verified energy reduction, energy-charge savings, demand-charge savings, and total bill impact separately. A tariff change may reduce cost while physical consumption remains unchanged.
How should a plant calculate avoided carbon emissions?
Multiply verified electricity savings by the emission factor that matches the inventory geography, year, and Scope 2 method. Do not add leakage emissions separately when leak energy was already included in metered compressor electricity. Disclose whether the result is location-based or market-based and keep the factor source with the calculation.
Does ISO 50001 certification prove the 42% result?
No. ISO 50001 provides an energy-management framework based on continual improvement, while ISO 50006 addresses baselines and EnPIs and ISO 50015 addresses M&V principles. The percentage still depends on the plant’s boundary, meters, adjusted baseline, reporting period, operating conditions, and production acceptance evidence.
Sources and technical references
- U.S. Department of Energy, Improving Compressed Air System Performance: A Sourcebook for Industry, Third Edition. Systems approach, pressure, controls, baselining, leak load, economics, and 20% to 50% opportunity range. Accessed July 27, 2026. https://www.energy.gov/sites/default/files/2016/03/f30/Improving%20Compressed%20Air%20Sourcebook%20version%203.pdf
- U.S. Department of Energy, Minimize Compressed Air Leaks, Tip Sheet #3. Leak-loss range, leak-program target, detection, control adjustment, and worked cost example. Accessed July 27, 2026. https://www.energy.gov/sites/prod/files/2014/05/f16/compressed_air3.pdf
- U.S. Department of Energy, Analyzing Your Compressed Air System, Tip Sheet #4. Seven-step assessment and continuous-improvement sequence. Accessed July 27, 2026. https://www.energy.gov/sites/prod/files/2014/05/f16/compressed_air4.pdf
- ISO 11011:2013, Compressed air - Energy efficiency - Assessment. Supply, transmission, and demand assessment boundary. Accessed July 27, 2026. https://www.iso.org/standard/46580.html
- ISO 50001:2018, Energy management systems - Requirements with guidance for use. Energy-management framework and PDCA model. Accessed July 27, 2026. https://www.iso.org/standard/69426.html
- ISO 50006:2023, Energy management systems - Evaluating energy performance using energy performance indicators and energy baselines. EnPI and baseline guidance. Accessed July 27, 2026. https://www.iso.org/standard/79367.html
- ISO 50015:2014, Energy management systems - Measurement and verification of energy performance of organizations. M&V principles, reconfirmed in 2025. Accessed July 27, 2026. https://www.iso.org/standard/60043.html
- U.S. EPA, GHG Emission Factors Hub. Purchased-electricity and regional grid-loss factors. Accessed July 27, 2026. https://www.epa.gov/climateleadership/ghg-emission-factors-hub
- GHG Protocol, Scope 2 Guidance. Location-based and market-based purchased-electricity accounting. Accessed July 27, 2026. https://ghgprotocol.org/scope-2-guidance
- OSHA 29 CFR 1910.242(b). Compressed-air cleaning pressure, chip-guarding, and personal protective equipment requirements. Accessed July 27, 2026. https://www.osha.gov/laws-regs/regulations/standardnumber/1910/1910.242