

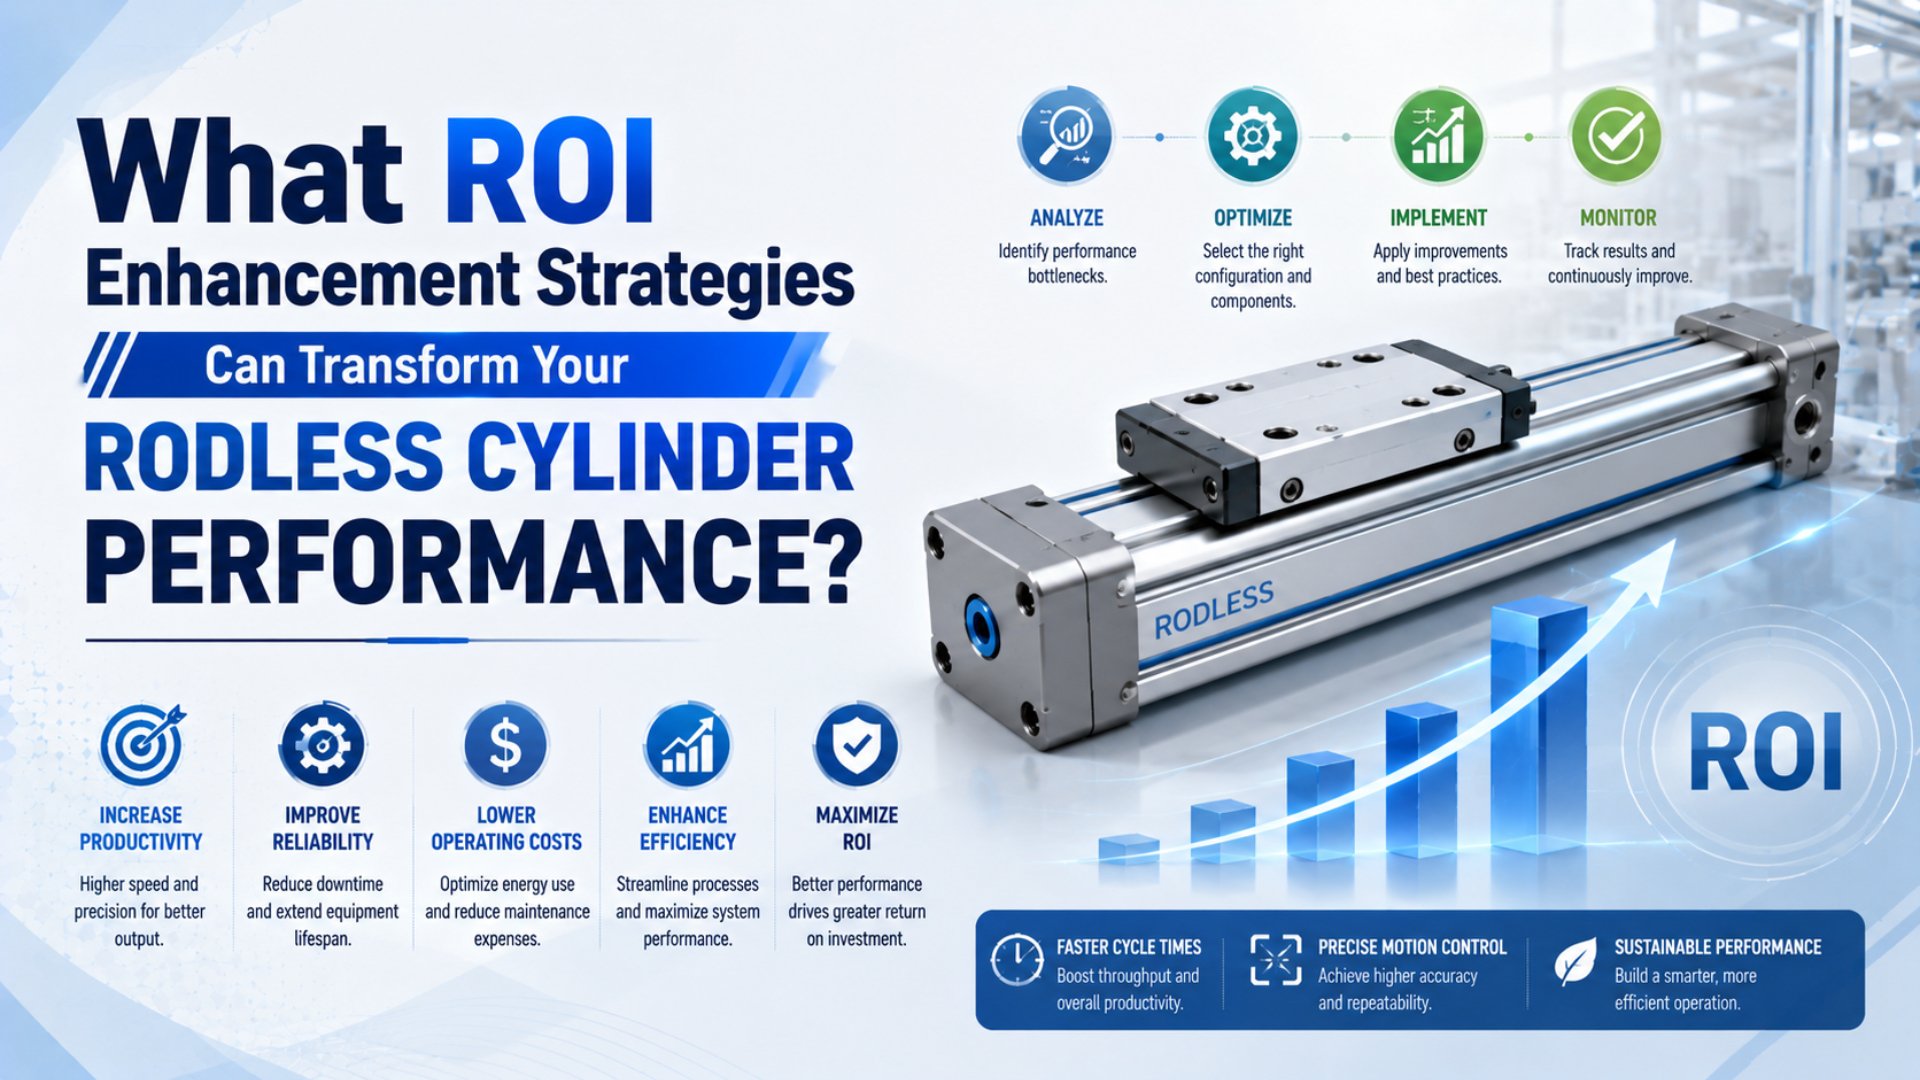
Rodless cylinder ROI improves when a project removes a measured cost without creating a new production or safety risk. The strongest cases usually start with a stable baseline, then test a limited change such as repairing leakage, reducing unnecessary pressure, correcting motion sequencing, or changing the spare-parts policy. A promised industry-average payback isn’t a business case.
ISO 50006:2023 provides 36 pages of guidance on energy performance indicators and baselines, while ISO 50015:2014, confirmed as current in 2025, addresses measurement and verification. Together, they support a practical rule: compare like-for-like operating conditions and state what changed before assigning savings to a pneumatic project (ISO 50006, 2023; ISO 50015, confirmed 2025).
Key Takeaways
- DOE says neglected compressed-air systems can lose 20% to 30% of compressor output through leaks.
- Calculate ROI from measured benefits, project cost, and recurring cost.
- Normalize the baseline for production and operating conditions.
- Treat energy, uptime, maintenance, and inventory as separate cash-flow lines.
Rodless cylinder ROI is the financial return attributable to a defined improvement in a rodless-cylinder application. It isn’t the return from the entire machine, compressor room, or maintenance department. The measurement boundary must be narrow enough to defend and wide enough to capture the real effect of the change.
This guide focuses on the economic decision. For component care and inspection intervals, use the rodless cylinder preventive-maintenance checklist. For part-order timing, see the predictive-maintenance spare-parts guide.
How Should Rodless Cylinder ROI Be Defined?
ISO 50006:2023 uses energy performance indicators and energy baselines to evaluate improvement, and its 36-page scope includes establishing, using, and maintaining both. For a rodless-cylinder project, define the asset boundary, reference period, production state, and adjustment variables before calculating a percentage. Otherwise, ordinary production variation can look like savings (ISO 50006, 2023).
Use two views of the investment. First-year ROI shows whether the first 12 months recover the initial outlay and produce an additional return. Simple payback estimates how long the recurring net benefit takes to recover that outlay.
Here, is annual net benefit in currency per year. Each term is a separately documented annual benefit. is the annual cost required to sustain the change, such as leak surveys, calibration, software, inspection labor, or a service agreement.
In this equation, is first-year ROI and is the one-time implementation cost. Keep financing, tax, depreciation, and discounted cash flow outside this simple screen unless the finance team asks for them. A multi-year capital request may need net present value instead.
The result is in months when is a one-time currency amount and is annual currency per year. If the benefit varies with production, use a monthly cash-flow schedule instead of this shortcut.
The denominator deserves as much attention as the numerator. Include engineering time, sensors, flow meters, valves, installation, controls changes, validation, training, planned downtime, and initial spares. Omitting internal labor can make a technically good project look financially stronger than it is.
Which Costs and Benefits Belong in the Model?
DOE reports that poorly maintained compressed-air systems can lose 20% to 30% of capacity through leakage. This is a system-level screening range, not promised savings for one rodless cylinder. Measure the selected boundary before assigning an energy benefit (DOE Compressed Air Sourcebook, accessed 2026).
Separate each cash-flow line and name its evidence. What would an approver challenge first? Usually it is not the arithmetic. It is whether the avoided event was likely, whether production losses were counted twice, or whether the project changed the machine’s output.
| Cash-flow line | Preferred evidence | Common mistake |
|---|---|---|
| Compressed-air energy | Flow or compressor power, operating hours, specific power, energy tariff | Pricing free-air volume as electrical energy without compressor data |
| Avoided downtime | Verified fault history, lost contribution per hour, recovery time | Using sales revenue as profit or counting planned stops as failures |
| Maintenance labor and parts | Work orders, technician hours, issued parts, repair frequency | Treating every past repair as permanently eliminated |
| Quality or scrap | Confirmed defect mechanism, units rejected, variable cost | Attributing unrelated process variation to cylinder motion |
| Inventory | Average capital released, carrying-cost policy, obsolescence exposure | Counting the full inventory value as annual savings |
| Implementation | Hardware, engineering, installation, validation, training, planned stop | Omitting internal labor or sustaining cost |
For compressed air, calculate current annual energy cost before claiming savings. The Compressed Air Energy Cost Calculator uses average flow, duty cycle, operating hours, compressor specific power, and electricity price. It doesn’t prove that a proposed change will preserve force, speed, cushioning, or cycle reliability.
If a leak is the main finding, rank it with the Compressed Air Leak Cost Calculator. When a safely isolated volume can be tested, the Pressure Decay Leak Rate Calculator provides a separate estimate from volume, pressures, and elapsed time.
Don’t add energy savings and leak savings when both represent the same reduced air flow. Choose one primary calculation path. The same discipline applies to downtime and maintenance: labor saved during an avoided breakdown may already be included in the downtime model.
How Should the Baseline Be Measured?
ISO 50015:2014 is a 19-page measurement-and-verification standard that was reviewed and confirmed in 2025. It applies to an organization or its components and to all energy types. For one rodless-cylinder axis, record a representative reference period and the variables that materially change demand before comparing results (ISO 50015, confirmed 2025).
Start with the machine’s operating state. Record product, payload, stroke, cycles, shift schedule, supply pressure during motion, valve and flow-control settings, and whether the machine is warm or starting cold. A static regulator reading isn’t enough. Air use and stroke time need the same cycle boundary.
A practical baseline can include:
- total completed cycles and good units;
- free-air flow or air consumption per comparable cycle;
- dynamic pressure at the machine inlet and, when needed, near the valve or actuator;
- extend and retract times under the same load;
- fault codes, unplanned stops, repair hours, and issued parts;
- electricity tariff and compressor specific power for the same operating period;
- the measurement device, calibration status, sample interval, and data owner.
The baseline period should cover normal variation, but there is no universal number of days. A stable single-product cell may need less time than a machine that changes tooling, recipes, loads, or shifts. If production volume changes, report air per good unit or per accepted cycle alongside total consumption.
Version the baseline after any material configuration change. A new valve, bore, payload, pressure setting, tube size, control sequence, or cylinder revision can invalidate the old comparison. Keep the old record for history, then qualify a new reference rather than silently overwriting it.
For pressure-related symptoms, use synchronized measurements instead of assuming the cylinder is the restriction. The guide to pressure drop across cylinder ports and fittings explains how upstream and downstream traces separate supply loss from exhaust restriction.
Which ROI Enhancement Strategies Deserve Testing First?
Parker’s current OSP-P catalog lists filtered, unlubricated compressed air, permanent grease lubrication, and an 8 bar maximum pressure for that series. These values show why an ROI project must check pressure, load, cushioning, and service rules for the exact model (Parker OSP-P catalog, accessed 2026).
Repair measured leakage
Locate the leak, identify whether it belongs to a fitting, tube, valve, port, band, seal, or adjacent branch, and verify the repair. DOE’s 20% to 30% figure describes neglected systems, not each actuator. Use measured flow, pressure decay under an approved procedure, or compressor behavior to quantify the selected boundary.
Remove unnecessary pressure without losing margin
Test the minimum pressure at the actuator during its hardest motion, not just at the regulator during idle. Preserve load force, acceleration, speed, cushion performance, valve switching, vertical-load behavior, and restart reliability. Lowering a setpoint without dynamic measurements can turn an energy project into an intermittent production fault.
Reduce avoidable air volume and idle demand
Check whether long tubes, oversized chambers, purge functions, blow-offs, or unused branches are filled every cycle. For the cylinder itself, compare bore, stroke, pressure, cycle rate, and load requirement. The article on cylinder bore size, air consumption, and operating cost covers that engineering relationship.
Coordinate high-demand motions
Staggering simultaneous movements can reduce peak flow and pressure sag even when total air per completed cycle changes little. That may protect cycle consistency or avoid a larger valve, header, or compressor intervention. Measure both peak demand and total consumption, because they answer different financial questions.
Reusing exhaust air is a specialized circuit decision, not a default “pressure cascade” upgrade. Exhaust pressure, available mass flow, contamination, back pressure, control state, failure behavior, and the receiving load all need review. ISO 4414 applies safety principles to the design, modification, installation, operation, and maintenance of pneumatic systems (ISO 4414, confirmed current).
Change the spare-parts policy
Classify spares by failure consequence, replenishment time, compatibility, installed population, repair level, and storage life. Don’t treat reduced stock value as an annual benefit. Apply the approved annual carrying-cost rate to average capital released, then subtract supplier fees, inspection, expedite risk, and any added downtime exposure.
Use condition evidence to time an order, but don’t order a seal kit from one slow stroke. The predictive-maintenance indicators guide shows how to confirm the fault and identify the correct part before procurement.
What Does a Transparent Worked Example Look Like?
ISO 50006:2023 distinguishes an energy baseline from the indicator used to evaluate performance. The following example uses one 12-month comparison and fully disclosed assumptions. It is not a benchmark or customer result. Replace every amount with plant records before using it for approval (ISO 50006, 2023).
Assume a plant proposes leak repair, point-of-use flow measurement, control-sequence adjustment, and a revised spare policy for one rodless-cylinder cell.
| Input | Illustrative value | Evidence required in a real project |
|---|---|---|
| One-time implementation cost, | USD 7,200 | Purchase orders, internal labor, installation and validation |
| Annual energy benefit | USD 3,600 | Comparable flow or power data and tariff |
| Annual avoided downtime benefit | USD 4,800 | Fault history and approved contribution loss |
| Annual maintenance benefit | USD 1,600 | Work orders, labor and parts |
| Annual inventory benefit | USD 600 | Average capital released times carrying-cost rate |
| Annual sustaining cost | USD 1,200 | Inspection, calibration and review labor |
The annual gross benefit is USD 10,600. After the USD 1,200 recurring cost, annual net benefit is USD 9,400. The first-year ROI is about 30.6%, and simple payback is about 9.2 months.
These results do not prove the project will perform that way. They only show what follows from the stated inputs. Before approval, reduce uncertain benefits, extend the validation period, or assign probability weights. What happens if only half of the avoided downtime is realized? That single change may matter more than a precise leak-cost estimate.
Use the sensitivity result to set a decision gate. A plant might approve the project only if the conservative case stays below its maximum payback period and the engineering validation shows no loss of force, cycle time, quality, or safety function.
How Should Savings Be Verified After Implementation?
ISO 50015:2014 was confirmed in 2025 and sets general principles for measuring and verifying energy performance. Verification should therefore be planned before installation, not reconstructed after the invoice arrives. Define the post-change period, comparison conditions, adjustment method, data owner, and acceptance rule while the baseline is still available (ISO 50015, confirmed 2025).
Use a closeout record with five parts:
- Configuration: model, bore, stroke, valve, tubing, pressure settings, software revision, load, and changed parts.
- Cost: invoices, internal hours, planned downtime, training, validation, and recurring commitments.
- Performance: air demand, pressure, stroke time, cycle output, faults, repair labor, quality, and production state.
- Adjustment: documented normalization for product mix, schedule, ambient condition, or throughput changes.
- Decision: accept, correct, expand, or reverse the change, with an owner and review date.
Run the machine through normal, worst-load, restart, and fault-recovery conditions required by its risk assessment. A lower energy number isn’t a success if the change increases end impact, causes magnetic decoupling, creates pressure sag, weakens a vertical-load control measure, or makes maintenance harder.
ISO 4414 is a 38-page standard covering significant hazards associated with pneumatic systems used on machinery. It also considers adjustment, uninterrupted operation, maintenance, reliability, energy efficiency, and environmental aspects. Any circuit or control modification needs the machine’s authorized safety review, isolation procedure, and restart validation (ISO 4414, confirmed current).
Review the business case again after the first representative operating period. Keep measured and forecast values in separate columns. If the project misses its target, the record should reveal whether the cause was lower production, incomplete implementation, measurement error, a wrong assumption, or a new operating cost.
Rodless Cylinder ROI FAQs
DOE identifies 20% to 30% leakage losses in poorly maintained compressed-air systems. That range explains why leaks deserve screening, but it cannot establish one rodless-cylinder project’s ROI. The calculation still needs local flow, compressor power, operating hours, tariff, repair cost, and post-change demand (DOE, accessed 2026).
What is a good ROI for a rodless cylinder improvement?
There is no universal percentage. A good result clears the plant’s approved financial threshold under a conservative scenario and still passes engineering validation. Report first-year ROI, payback, included cash flows, excluded effects, uncertainty, and measurement boundary. Finance may also require net present value for multi-year projects.
How long should a rodless cylinder ROI project take to pay back?
Calculate payback from one-time cost divided by verified annual net benefit, then convert the result to months. Don’t copy a supplier or industry-average period. Use conservative energy, downtime, maintenance, and inventory assumptions, and show how the result changes when the largest uncertain benefit is reduced.
Can compressed-air leak percentages be used as rodless cylinder savings?
No. DOE’s 20% to 30% figure describes losses possible in poorly maintained compressed-air systems. It is not a guaranteed saving and isn’t specific to rodless cylinders. Measure the selected branch or machine, locate the leakage, repair it, and compare normalized post-repair demand before recognizing a benefit.
Should reduced spare-parts inventory count as annual savings?
Only the economic effect should count. Releasing USD 20,000 of inventory is not automatically USD 20,000 of annual benefit. Apply the organization’s carrying-cost method to average capital released, then account for supplier fees, obsolescence, inspection, expedites, and added downtime risk before entering the result.
What must be checked before lowering pneumatic pressure?
Measure pressure during the hardest motion and verify force margin, acceleration, stroke time, cushioning, valve switching, restart behavior, and every relevant safety function. ISO 4414 covers pneumatic-system modification and safety principles. Never reduce pressure solely because a static regulator reading appears higher than the catalog minimum.
Sources and Technical References
- ISO 50006:2023, Energy performance indicators and energy baselines, accessed 2026-07-27.
- ISO 50015:2014, Measurement and verification of energy performance, reviewed and confirmed 2025.
- ISO 4414:2010, Pneumatic fluid power safety requirements, accessed 2026-07-27.
- DOE, Improving Compressed Air System Performance: A Sourcebook for Industry, accessed 2026-07-27.
- Parker OSP-P Pneumatic Rodless Cylinders and Linear Guides, accessed 2026-07-27.
- SMC Basic Characteristics of Rodless Cylinders, accessed 2026-07-27.