

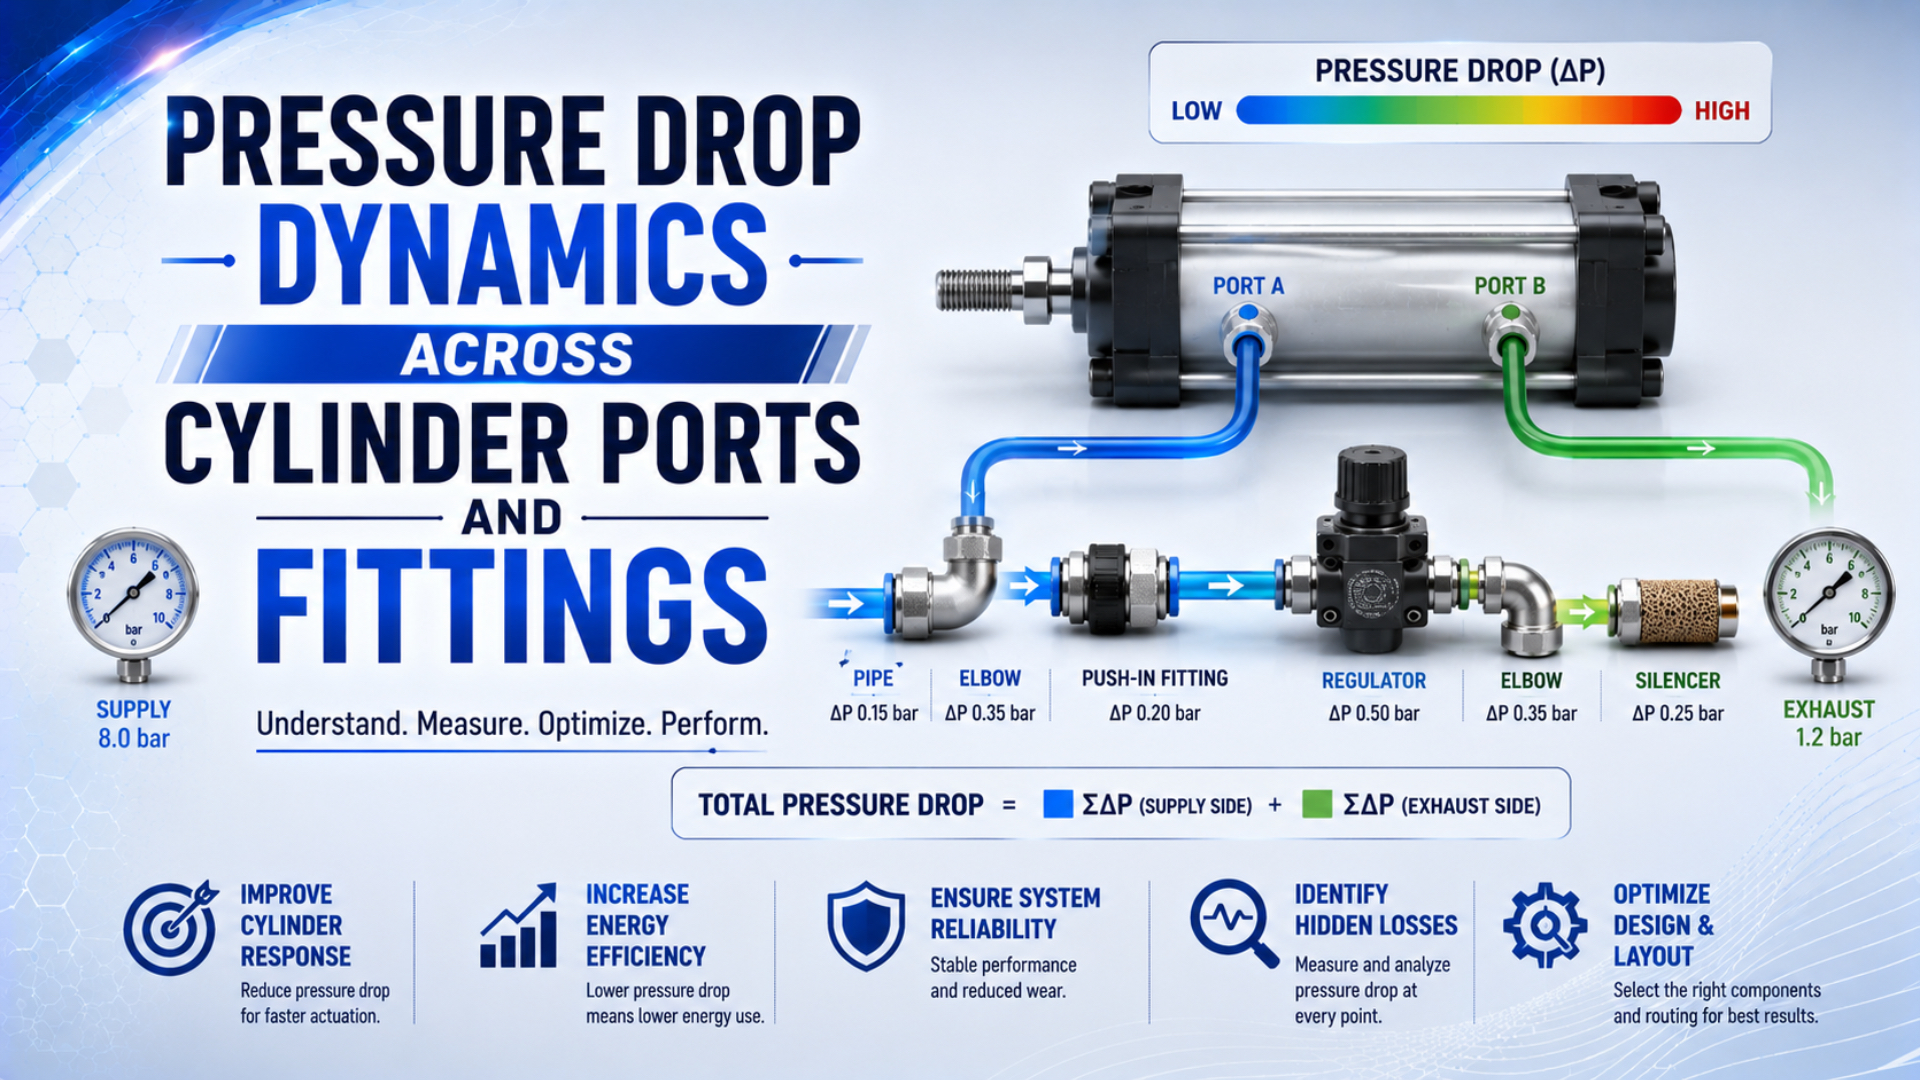
Pressure drop across cylinder ports and fittings is the dynamic pressure difference created while air passes from a valve outlet, through connectors and tubing, into a working chamber or back through the exhaust path. Diagnose it with synchronized pressure measurements during motion. Static regulator pressure can’t show which local restriction is consuming the margin.
Count alone isn’t the useful question. Find which segment produces the largest repeatable pressure difference during the failed part of the stroke. Measure first. Then compare the component’s ISO 6358 flow data, manufacturer curve, internal bore, tube size, and installation condition before changing hardware.
Key Takeaways
- CAGI’s system-level target is no more than 10% pressure drop from compressor discharge to the point of use.
- Port thread size doesn’t disclose the smallest internal passage or tested conductance.
- Measure supply and exhaust paths separately during the same timed motion.
- Standard flow must be converted before calculating local tube velocity.
Scope matters. Our broader pneumatic system pressure-drop guide covers compressors, dryers, filters, regulators, headers, and machine branches. Cylinder flow demand and tube ID belong in the hose and fitting sizing guide. This guide instead uses synchronized pressure traces to isolate local loss.
What Does Pressure Drop Across Cylinder Ports and Fittings Mean?
CAGI says a well-designed compressed-air system should remain within 10% pressure drop from compressor discharge to any point of use (CAGI, Technical Brief on Pressure Drop, accessed 2026-07-22). That target can be narrowed to the short, active flow path beside the cylinder.
Pressure drop across a component is the upstream pressure minus the downstream pressure while air is flowing through that component. For segment , record both pressure signals against the same clock:
In this equation, is the instantaneous segment pressure drop, is the upstream pressure, and is the downstream pressure. Keep one pressure reference and one unit across both channels. Subtraction remains valid for gauge or absolute readings when their reference is consistent.
At one instant, adjacent measured drops telescope across a series path:
This equation sums measurements, not fixed catalog losses. Each component does not carry a permanent 0.1 or 0.2 bar penalty. Its drop changes with mass flow, upstream pressure, downstream pressure, temperature, flow direction, needle position, contamination, and the state of every other restriction in the path.
At slow jog, a 0.05 bar loss may become 0.3 bar during a production stroke because flow demand has increased. Static pressure can return to normal as soon as the piston stops. Capture the full trace. Compare the same time window on repeated cycles.
For loss inside the working chamber and its effect on force, use the separate guide to dynamic pressure within the cylinder barrel. It distinguishes a localized external restriction from changing chamber pressure during motion.
Treat pressure drop as an event, not a nameplate value. A useful record combines two pressure traces with valve command and piston position. Add stroke time. Without common timing, minima taken from different moments can create a pressure difference that never actually existed.
Why Do Port Threads and Fitting Sizes Mislead?
SMC’s AS speed-controller catalog spans sonic-conductance values from 0.06 to 3.9 dm³/(s·bar) across one product family. Its rated flows were measured at 0.5 MPa and 20°C (SMC, AS Series Speed Controller with One-touch Fittings, accessed 2026-07-22). Connection labels alone cannot predict capacity.
Mechanical interface labels include G1/4, NPT 1/4 and M5. Each label controls mating geometry and sealing method, including thread engagement. None discloses the installed fitting’s minimum bore, the end cap’s cross-drill, an elbow restriction, a check element, or excess thread sealant. If the unanswered question is which hose ID or fitting capacity to select, use the dedicated sizing article. During a pressure-drop investigation, external labels serve as evidence metadata rather than a verdict. Record them so the assembled path can be reproduced. Geometry wins. Push-in elbows can contain a smaller throat than the connected tube, yet a cylinder cross-drill may remain the controlling section. Let the synchronized pressure difference decide whether that segment matters.
Keep these fields separate when comparing ports and fittings:
| Field | What it establishes | What it cannot prove |
|---|---|---|
| Port thread | Mechanical connection and sealing interface | Minimum internal passage or flow rate |
| Tube outside diameter | Compatible tube and collet size | Tube inside diameter or fitting throat |
| Minimum physical bore | Smallest inspected section | Losses from bends, entrances, valves, or roughness |
| Sonic conductance and critical ratio | Tested compressible-flow behavior | Complete cylinder stroke time under load |
| Manufacturer flow curve | Model behavior at stated conditions | Performance outside those test conditions |
Some straight adaptors with the same thread pass more air than elbows; others don’t. Count restrictions by tested capacity and measured effect, not by appearance.
Detailed coverage of threads, cross-drills, end-cap passages, wall thickness, burr control, and manufacturing drawings belongs in the cylinder port-geometry guide. Those geometric facts enter this investigation only after the pressure trace localizes the loss to the cylinder connection.
Installation changes the effective passage. Common faults include a tube that isn’t cut square, a liner or seal protruding into the bore, excess PTFE tape, anaerobic sealant inside the port, a partially seated tube, a kink near the fitting, swarf in a cross-hole, and a speed controller installed in the wrong direction.
Don’t assume every elbow is bad. Even a well-sized elbow can outperform a straight component containing a smaller check valve. Model-specific conductance or a pressure-flow curve settles that comparison. Appearance doesn’t.
The Correct Physics for a Compressible Flow Path
ISO 6358-1 defines steady-state testing for gas-flow components with fixed or variable internal passages, while its April 2026 amendment addresses measurement uncertainty (ISO 6358-1; Amendment 2:2026). That is the correct framework when a simple incompressible loss coefficient no longer represents the pneumatic component.
This expression, , can screen a defined local geometry when density variation is small and is valid for the flow regime. It is not a universal compressed-air sizing equation. Large pressure ratios, changing density and choked flow need compressible-flow data.
ISO 6358-3 provides a numerical method for estimating the overall steady-state flow characteristics of systems whose components and piping already have known characteristics. It covers both subsonic and choked flow and was reconfirmed in 2025 (ISO 6358-3, accessed 2026-07-22).
Component comparison should start with model-specific sonic conductance and critical pressure ratio . A manufacturer pressure-flow curve is the next choice when it covers the actual direction and adjustment. Pneumatic Cv or effective-area data can support screening when its test method is stated. Missing catalog data calls for a measured trace at the required flow. Keep boundaries explicit: valve paths and Cv belong in the pneumatic valve pressure-drop calculation guide, while the local trace in this guide begins at the valve outlet. Don’t assign valve loss to a fitting. Likewise, a line-loss calculator cannot certify an uncharacterized valve or end-cap passage.
Standard flow also needs care. NIST notes that volume-flow units containing atm use specified reference conditions, and that even sccm can assume different temperatures in different contexts (NIST, Pressure and Gas Flow Unit Conversions, updated 2025). ISO 8778 supplies a standard reference atmosphere for pneumatic performance data (ISO 8778, confirmed 2022).
For an ideal-gas screening conversion, relate standard and line volume flow as:
In the conversion, is volume flow inside the pressurized line, is flow at the declared normal or standard reference, and are absolute pressures, and and are absolute temperatures. Never use gauge pressure in this ratio.
Once actual volume flow is known, the average velocity in a circular passage is:
is the passage area, is its internal diameter, and is average velocity at the stated line condition. This is a continuity calculation, not proof that the passage will deliver the demanded mass flow. Confirm the pressure ratio and component characteristic next.
How Should You Measure Each Restriction During a Stroke?
CAGI’s 2021 system-design chapter recommends pressure-monitoring ports before and after every flow-restricting component so individual losses can be identified without interrupting production (CAGI, Compressed Air System Design, 2021). Near a cylinder, synchronized sensors turn that principle into a short segment-by-segment test.
Choose pressure sensors fast enough to capture the motion event. Handheld gauges can reveal steady restriction.
A 200 ms pressure sag, however, may disappear in pointer damping or display averaging. Document range, accuracy, response time, adaptor geometry and logger settings with the trace.
Place taps in stages rather than drilling every point at once:
| Pass | Sensor placement | Decision |
|---|---|---|
| 1 | Valve outlet and cylinder port | Decide whether the complete local path is restrictive |
| 2 | Valve outlet and tube end | Separate the upstream connector and tube run |
| 3 | Tube end and cylinder-port entrance | Isolate the final adaptor and thread interface |
| 4 | Cylinder-port entrance and chamber tap, when permitted | Evaluate the internal end-cap passage |
| 5 | Repeat on the opposite stroke | Capture the reversed supply and exhaust routes |
After changing one component, repeat the same pressure, load, controller setting, cycle command, and analysis window.
For local subtraction, gauge pressure works when every sensor shares ambient reference. Density and standard-flow conversion require absolute pressure.
Pressure ratios and compressible-flow calculations also need absolute values. Label every channel; a file named only pressure.csv invites mistakes months later.
Measurement hardware can create its own restriction. Long sensor hoses and clogged snubbers delay the signal; a narrow adaptor does too.
Flush-mounted sensors close to the active path provide better transient data. Installation must still preserve pressure integrity and the manufacturer’s port requirements.
Bracket the entire local path first. Similar valve-outlet and cylinder-port pressures during the fault clear the fittings as the primary cause. Investigate chamber pressure and exhaust control next. Load, alignment, seal friction and cushioning also remain candidates. This negative result prevents unnecessary hardware changes.
Supply and Exhaust Paths Need Separate Tests
SMC gives the cylinder-speed screening relation at constant inlet pressure and identifies meter-out exhaust control as the common industry practice (SMC, Control Air Flow of Cylinders, accessed 2026-07-22). Supply flow and exhaust back pressure must therefore be measured as different paths.
On extension, a double-acting single-rod cylinder fills the cap end while the rod end exhausts. Retraction reverses those roles. One fitting can therefore carry incoming air in one direction and outgoing air in the other. Check elements and speed controllers add direction-dependent conductance. Supply-side loss may prevent chamber pressure from building fast enough, while exhaust restriction creates opposing back pressure. Both slow the actuator. Their fixes differ. Meter-out control is intentional restriction, so the goal is not zero pressure drop across the controller. The correct setting maintains stable motion, enough net force, and an acceptable stroke time. Opening the needle completely can destabilize some loads, as the dedicated meter-out circuit guide explains.
| Motion | Supply path to measure | Exhaust path to measure | Typical symptom |
|---|---|---|---|
| Extension | Valve P-to-A, cap-end tube and port | Rod-end port, controller, B-to-exhaust | Slow extension or weak push |
| Retraction | Valve P-to-B, rod-end tube and port | Cap-end port, controller, A-to-exhaust | Slow return or high back pressure |
| Hold or clamp | Chamber pressure after filling | Leakage and trapped opposite pressure | Force decays or load slips |
Mufflers deserve a separate trace. Oil, water, dust, thread compound, and undersized sintered elements can restrict exhaust more severely over time. Test a suspected muffler only under a safe procedure that controls noise, debris, and unexpected actuator acceleration. Don’t leave a protection or silencing component removed as a permanent diagnosis.
For high pressure ratios, the limiting section may reach choked flow. Once the controlling throat is choked, further reduction of downstream pressure does not create a proportional flow increase. Use the model’s critical pressure ratio or follow the high-speed port choked-flow analysis instead of applying one universal square-root rule.
A Transparent 0.4 Bar Worked Example
NIST’s updated 2025 conversion page uses 101,325 Pa as one stated atmospheric pressure reference and warns that standard gas-flow temperature assumptions can differ (NIST, Pressure and Gas Flow Unit Conversions, updated 2025). Every defensible example must state its pressure reference, temperature basis, and measurement boundary.
Consider a hypothetical 50 mm bore cylinder extending under a repeatable load. Two synchronized gauge sensors record 6.0 bar at the directional-valve outlet and 5.6 bar at the cylinder cap-end port during the high-flow portion of the stroke. A temporary intermediate tap records 5.8 bar after the first elbow fitting.
The measured drops are:
| Segment | Upstream pressure | Downstream pressure | Dynamic drop |
|---|---|---|---|
| First fitting and controller | 6.0 bar(g) | 5.8 bar(g) | 0.2 bar |
| Tube, final fitting, and port | 5.8 bar(g) | 5.6 bar(g) | 0.2 bar |
| Complete local path | 6.0 bar(g) | 5.6 bar(g) | 0.4 bar |
This transparent teaching case is not a promised product result.
Its table proves only that the measured local path consumed 0.4 bar at that point in the stroke. One additional test must split the remaining 0.2 bar segment if further localization is necessary.
Cap-side theoretical force changes with the 0.4 bar pressure difference:
For this force calculation, is piston area, is the 50 mm bore, and is the cap-side theoretical force difference. With and , the difference is approximately 78.5 N.
This result is not the cylinder’s net output. Rod-side back pressure and seal friction still apply, along with guide friction, acceleration, load angle and safety factor. The dual-port cylinder force-loss guide combines both chamber pressures without subtracting the same loss twice.
Now suppose the line carries 350 L/min on a declared normal reference basis at roughly equal normal and line temperatures. At 6.0 bar(g), use about 7.0 bar absolute for a first-pass conversion:
A 1 bar absolute reference gives approximately 50 L/min actual volume flow. Inside a 6 mm passage, average velocity is near 29.5 m/s.
Check the result against temperature, local pressure, pulsation and compressibility. It remains a screening value.
Keep the calculator to tube and equivalent-fitting screening because it cannot replace an ISO 6358 component curve. Supplier Cv can be compared with the Cv flow calculator under the stated convention. Estimate actuator demand separately. Use the cylinder flow requirement calculator for that task.
Which Restriction Should You Change First?
CAGI recommends keeping total compressor-to-point-of-use pressure drop within 10%, but a local repair should target the largest repeatable segment rather than divide that allowance equally among components (CAGI, Technical Brief on Pressure Drop, accessed 2026-07-22). Rank fixes by measured loss, flow demand, reversibility, and operating risk.
Use this decision order:
| Priority | Action | Stop or continue? |
|---|---|---|
| 1 | Confirm direction, load, target time, actual time, setpoint, and simultaneous users | Stop if the symptom cannot be reproduced |
| 2 | Bracket valve outlet to cylinder port | Stop blaming fittings when the pressures stay close |
| 3 | Move one sensor to split the largest segment | Continue until one component or short assembly is isolated |
| 4 | Inspect kinks, insertion, sealant, burrs, contamination, and flow direction | Correct installation faults before resizing |
| 5 | Substitute one reversible, documented component | Repeat the identical cycle and analysis window |
| 6 | Compare direction-specific component data | Reject ratings with incompatible pressure or temperature conditions |
| 7 | Modify the metal passage only after drawing and wall review | Require cleaning, pressure testing, and manufacturer approval |
Measured loss alone doesn’t make a fitting defective. Intentional meter-out restriction may be stabilizing the load. Judge the trace against force and speed requirements. Stability and safety matter too. Remove only unintended restriction.
Symptom changes verify the conclusion:
| Test change | Pressure-trace result | Likely conclusion |
|---|---|---|
| Larger-ID tube shortens stroke and reduces the same segment drop | Repeatable improvement | Tube was materially restrictive |
| New fitting changes nothing | Same trace and time | Another element controls flow |
| Removing a clogged muffler lowers opposite-chamber pressure | Exhaust improves | Muffler was restrictive |
| Higher supply pressure masks the fault but segment drop grows | More energy, same bottleneck | Capacity problem remains |
| Cylinder-port pressure is healthy but motion remains slow | No local supply loss | Check load, guides, seals, cushion, and exhaust |
Do not raise compressor or regulator pressure as the first fix.
Higher pressure changes actuator force, air consumption, impact energy, leakage, and stored energy. It can conceal a restriction while creating a different risk.
What Belongs in a Pressure-Drop Test Report?
SMC states that its AS-series flow ratings were measured at 0.5 MPa and 20°C, two conditions that belong in any comparison report (SMC, AS Series Speed Controller with One-touch Fittings, accessed 2026-07-22). Reproducibility requires the trace, hardware configuration, and test conditions together.
Capture these fields in the test record:
| Report field | Required record | Failure it prevents |
|---|---|---|
| Test identity | Machine, axis, date, operator, article or drawing revision | Mixing results from different assemblies |
| Motion event | Extension or retraction, command time, load, orientation, target and actual time | Comparing different duty points |
| Pressure channels | Sensor model, range, location, gauge or absolute reference | Subtracting incompatible signals |
| Timing | Sample rate, shared clock, selected analysis window | Pairing minima from different moments |
| Cylinder state | Model, bore, rod, stroke, cushion setting, temperature | Mistaking mechanical changes for flow changes |
| Local path | Valve port, tube ID and length, every fitting model, cylinder port | Losing configuration traceability |
| Flow control | Meter-in or meter-out, needle position, check direction, muffler | Treating intentional restriction as a defect |
| Catalog evidence | Sonic conductance, critical ratio, Cv, curve, test conditions | Comparing incompatible ratings |
| Result | Full pressure traces, calculated segment drops, stroke time | Reporting only a favorable percentage |
Direction matters. Record whether supplier data applies to free flow, controlled flow, or both. SMC’s catalog assigns different conductance and critical ratios to those directions, so one headline number may not describe the failed stroke. For a custom end-cap investigation, attach the cross-drill diameter and breakthrough location. Include transition limits; burr and cleaning requirements; wall thickness; sealing land; proof test; traceability. These details connect a repeatable pressure trace to the manufactured passage. When a part lacks a usable curve, define a controlled A/B test. Hold the valve, tube and load constant. Keep the supply, controller and cushion fixed. Match temperature and analysis window too. Publish the complete trace and configuration. One final percentage cannot identify the mechanism.
Pressure Drop FAQs: What Should Engineers Verify?
ISO 6358-3 treats a pneumatic path as a system of components and piping with known flow characteristics. Its method covers subsonic and choked behavior (ISO 6358-3, confirmed 2025). Five answers follow. Each separates thread size from measured pressure and catalog conductance from real cylinder motion.
How much pressure drop across a cylinder fitting is acceptable?
No universal local limit fits every connector. CAGI’s 10% figure applies from compressor discharge to the point of use, not to each fitting. Acceptability depends on complete supply and exhaust paths delivering the required chamber pressure; stability; stroke time; safety margin during the worst cycle.
Can I calculate every fitting with the K-factor equation?
Apply only when its coefficient and geometry are valid for the density assumption and flow regime. ISO 6358-1 better characterizes pneumatic components with compressible-gas flow. Near choked conditions or large pressure ratios, switch to sonic conductance, critical pressure ratio or manufacturer curves.
Is a straight push-in fitting always better than an elbow?
Not necessarily. Geometry alone cannot decide capacity because model-specific internal passages vary. SMC’s AS catalog spans 0.06 to 3.9 dm³/(s·bar) in sonic conductance, showing why tested conductance matters. Compare the exact fitting or controller in the required direction. Even a large straight body can hide a smaller check element.
Where should pressure sensors be installed?
CAGI recommends monitoring before and after flow-restricting components. Start with one sensor at the valve outlet and one at the cylinder port, then move the downstream sensor to split the largest segment. Record both channels during the same stroke with valve command, piston position, sampling rate, load, and controller setting.
Does pressure drop reduce cylinder force or speed?
It can reduce both. Chamber pressure affects theoretical force, while SMC’s relation links speed to airflow at constant inlet pressure. Exhaust restriction also creates opposing back pressure. Measure both chambers before assigning a weak or slow stroke to the supply fitting alone.
Sources and technical references
- ISO, ISO 6358-1:2013, general rules and steady-state test methods for compressible-flow components. Confirmed current; accessed 2026-07-22.
- ISO, ISO 6358-1:2013/Amd 2:2026, evaluation of measurement uncertainty. Published April 2026; accessed 2026-07-22.
- ISO, ISO 6358-3:2014, system flow calculation from known component and piping characteristics. Confirmed 2025; accessed 2026-07-22.
- ISO, ISO 8778:2003, standard reference atmosphere for pneumatic performance data. Confirmed 2022; accessed 2026-07-22.
- CAGI, Technical Brief on Pressure Drop, system pressure-drop target, causes, and monitoring taps. Accessed 2026-07-22.
- CAGI, Compressed Air System Design, segment measurement before and after restricting components. Published 2021; accessed 2026-07-22.
- SMC, Control Air Flow of Cylinders, cylinder speed, airflow, piston area, port size, tubing, and meter-out control. Accessed 2026-07-22.
- SMC, AS Series Speed Controller with One-touch Fittings, model flow, sonic conductance, critical pressure ratio, and test conditions. Accessed 2026-07-22.
- NIST, Pressure and Gas Flow Unit Conversions, pressure conversion and standard gas-flow reference cautions. Updated 2025; accessed 2026-07-22.