

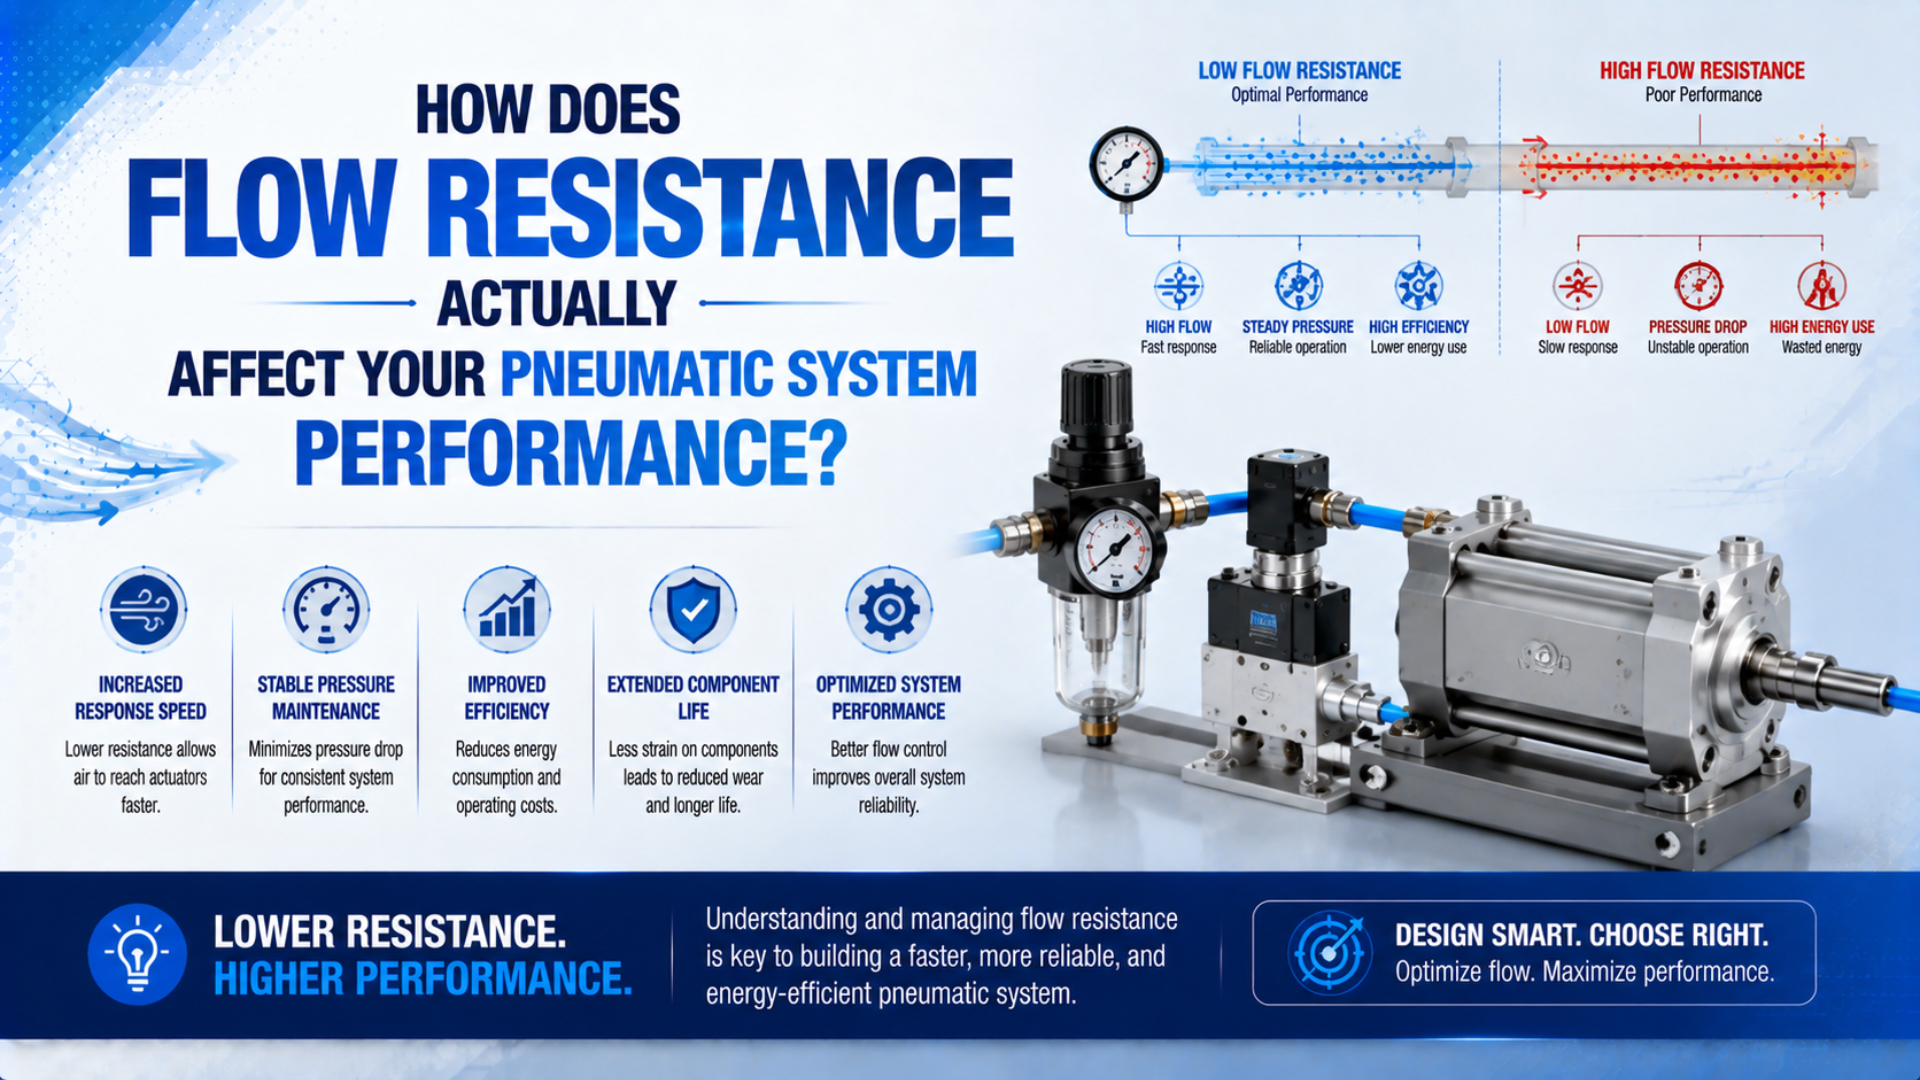
Flow resistance affects a pneumatic system only when air is moving: it consumes pressure along the active flow path, limits the mass flow available to fill or exhaust a cylinder chamber, and can reduce net force, speed, and cycle repeatability. A normal static gauge reading does not rule it out. The useful evidence is the pressure difference across each path segment during the part of the cycle that fails.
This article shows how to build that evidence. It treats flow resistance as a measured system behavior rather than a permanent loss assigned to every elbow or fitting.
In our application reviews, we found that a synchronized pressure test gives a clearer starting point than replacing components by appearance. The method can also clear an innocent fitting or tube, which is just as valuable as locating the actual bottleneck.
Key Takeaways
- Measure pressure while the actuator is moving; static pressure cannot locate a flow restriction.
- Separate the active supply path from the active exhaust path for each direction of motion.
- Compare adjacent, synchronized pressure signals to find the segment consuming the most pressure margin.
- Use ISO 6358 conductance or manufacturer pressure-flow curves for valves and components.
- Use pipe-loss equations only inside their stated assumptions, with standard flow converted to actual line flow.
The broader pneumatic pressure-drop guide covers compressors, dryers, filters, regulators, headers, and plant branches. The tubing and fitting optimization guide covers tube ID and routing. Here, the narrower task is to identify how much of the available dynamic pressure margin each installed segment consumes during a repeatable machine event.
What Flow Resistance Means in an Installed Pneumatic Circuit
CAGI recommends no more than 10% pressure drop between compressor discharge and any point of use in a well-designed compressed-air system (CAGI, Technical Brief on Pressure Drop, accessed 2026-07-27). That is a system-level design target, not a fixed allowance to divide equally among every component.
Flow resistance is the relationship between flow demand and the pressure difference needed to move air through the installed path. The path may include pipe, hose, filters, regulators, directional valves, manifolds, fittings, speed controllers, cylinder ports, chambers, exhaust valves, and silencers. Its pressure loss is not constant. It changes with mass flow, upstream pressure, downstream pressure, temperature, flow direction, valve position, contamination, and concurrent demand.
Dynamic pressure drop is the upstream-to-downstream pressure difference measured while air is flowing through a defined segment. It belongs to a stated direction, time window, and operating condition.
For one measured segment, define the instantaneous pressure difference as:
Here, is the pressure drop across segment at time . The two sensors must use the same pressure reference and the same time base. Gauge readings can be subtracted when both sensors share the same atmospheric reference. Compressible-flow pressure ratios require absolute pressure.
Across adjacent segments in one series path:
This equation sums synchronized measurements. It does not mean that catalog losses or guessed K-values can be added as permanent pressure penalties. A fitting that drops 0.05 bar during a slow jog may drop much more during a fast production stroke because the operating flow has changed.
Pressure drop and pressure loss also need a boundary. A static-pressure decrease through a reducer includes acceleration as well as irreversible loss. NIST distinguishes that measured pressure change from the mechanical-energy loss created by friction, separation, and mixing (NIST, Technical Note 2294, 2024). For troubleshooting, record the pressure difference first. Use the correct physical model only after the restrictive segment has been isolated.
A resistance budget is a timed measurement, not a parts count. Ten fittings with negligible adjacent pressure differences are less important than one loaded filter, undersized valve path, pinched tube, or clogged exhaust silencer that consumes a large share of the available margin during the failed stroke.
The Three Ways Resistance Changes Machine Performance
NASA expresses gas mass flow through a passage as ; density cannot be assumed constant when compressibility becomes important (NASA, Mass Flow Rate Equations, accessed 2026-07-27). This explains why pneumatic performance cannot be predicted from tube area or static pressure alone.
Available Force Falls
For a double-acting cylinder, the pressure contribution to net force is:
and are the simultaneous chamber pressures, and are their effective piston areas, and represents seal, guide, and other mechanical friction. Supply-side resistance can delay the rise of working-chamber pressure. Exhaust-side resistance can keep the opposite chamber pressure high. Either effect reduces the pressure force available to accelerate or hold the load.
For perspective, a 50 mm bore has a piston area of approximately . A 0.1 bar pressure difference across that full area corresponds to about 19.6 N of theoretical pressure force:
That is a transparent geometry example, not a promised cylinder output. Rod-side area, friction, acceleration, mounting, load direction, cushion settings, and safety factor still matter. The force-loss guide covers the complete two-chamber calculation.
Maximum Speed Becomes Flow-Limited
Cylinder speed depends on how quickly mass enters the expanding working chamber and leaves the opposite chamber. Once a valve, fitting, tube, port, controller, or silencer becomes the controlling restriction, lowering downstream pressure may not create a proportional increase in mass flow. The dedicated choked-flow guide explains that pressure-ratio limit.
A larger cylinder or higher regulator setting does not automatically cure the problem. A larger bore needs more air for the same speed. Raising supply pressure can mask weak force while the restrictive path still prevents the required chamber-filling rate.
Cycle Time Loses Repeatability
Resistance becomes an intermittent fault when the upstream pressure changes with other consumers. A cylinder may pass a single-cycle test and slow when another station blows off, clamps, or indexes at the same time. A dirty filter, warming regulator, flexible hose, or accumulating muffler contamination can also move the operating point between shifts.
The symptom is often not a uniformly slow machine. Look for a stroke-time tail, hesitation in one direction, pressure sag during overlapping demand, or increasing exhaust back pressure. Those patterns require synchronized signals rather than a single minimum gauge reading.
Build a Dynamic Resistance Budget Before Replacing Components
The U.S. Department of Energy recommends measuring pressure differentials at treatment equipment and multiple distribution points, and notes that pressure and flow data loggers reveal intermittent loads and system changes over time (DOE, Improving Compressed Air System Performance: A Sourcebook for Industry, accessed 2026-07-27). Apply the same principle to one machine cycle.
Start with a reproducible fault. Record the motion direction, load, regulator setting, valve command, piston-position signal if available, and actual stroke time. Then bracket the complete path before adding more sensors.
Our team measured supply and exhaust paths as separate problems because the active components and pressure directions change when cylinder motion reverses. Combining both directions in one budget can hide a directional valve path, check element, speed controller, or exhaust restriction.
For an extending double-acting cylinder, a practical first pass is:
- P0: machine inlet or local receiver outlet
- P1: downstream of the FRL or point-of-use regulator
- P2: directional-valve outlet feeding the cap end
- P3: cap-end cylinder port
- P4: rod-end cylinder port
- P5: exhaust outlet downstream of the valve or silencer
At one chosen instant or short time window, calculate each adjacent drop. To rank measured segments, a diagnostic share can be useful:
is only the share of the measured path drop at that instant. It is not a flow coefficient, permanent component rating, or prediction for another operating point. If the denominator is small or a segment reverses flow, do not use the ratio. Inspect the synchronized traces directly.
Use a table that preserves the measurement boundary:
| Segment | Signals | What a repeatable dynamic difference indicates |
|---|---|---|
| Branch and FRL | P0 minus P1 | Upstream branch, filter, regulator, or local treatment restriction |
| Directional valve | P1 minus P2 | Valve path, manifold passage, or regulator droop near the valve |
| Tube and cylinder connection | P2 minus P3 | Tube length, kink, fittings, controller, adaptor, or port restriction |
| Opposing chamber | P4 | Back pressure acting against motion |
| Exhaust assembly | P4 minus P5 | Valve exhaust path, controller, tubing, or silencer restriction |
Do not pair the minimum of P2 with the minimum of P3 if they occurred at different times. That creates a pressure difference that the system never experienced. Compare adjacent channels at the same timestamp and over the same motion phase.
Read the Supply and Exhaust Paths as Different Problems
ISO 6358-1 specifies steady-state testing for pneumatic components with compressible fluids, while ISO 6358-3 provides a method for combining known component and piping characteristics in systems and covers both subsonic and choked flow (ISO 6358-1; ISO 6358-3, accessed 2026-07-27). These characteristics are direction- and operating-point dependent.
Sonic conductance is the ISO 6358 parameter that describes a component’s flow capacity at the sonic condition. The accompanying critical pressure ratio marks the transition between subsonic and choked behavior under the stated test method.
During extension, the cap end receives supply air while the rod end exhausts. Retraction reverses those chamber roles. A speed controller with a check valve deliberately has different conductance in its free-flow and metered directions. A directional valve may also have different P-to-A, P-to-B, A-to-exhaust, and B-to-exhaust capacities.
Use this interpretation:
| Trace pattern during the slow phase | More likely issue | Next measurement |
|---|---|---|
| P1 stays healthy but P2 falls | Directional valve or manifold path | Compare the exact active valve path with its flow curve |
| P2 stays healthy but P3 rises slowly | Tube, fitting, controller, or cylinder port | Split P2-to-P3 with one intermediate tap |
| Working pressure builds but P4 remains high | Exhaust back pressure | Move the downstream sensor across controller, valve, and silencer |
| P0 and P1 sag together | Machine branch or upstream demand | Log branch flow and concurrent consumers |
| Adjacent pressures remain close | That segment is not the main restriction | Check load, alignment, seals, cushioning, and chamber pressure |
Meter-out restriction is intentional. The goal is not zero exhaust pressure drop; it is stable motion with sufficient net force and acceptable stroke time. Opening a controller completely can produce an unsafe acceleration or unstable load. Treat the selected setting as part of the test configuration.
Exhaust silencers deserve their own measurement. Oil, water, dust, thread compound, and debris can increase their resistance over time. Any temporary test without a silencer must control noise, contamination, and unexpected actuator speed. Do not leave a safety or noise-control component removed as the repair.
When Calculations Help and When They Mislead
Parker defines its pneumatic free-air flow reference using standard atmospheric conditions of 20°C and 1.013 bar, and recommends absolute pressure for tests and measurements (Parker, Pneumatic Technical Guidelines, accessed 2026-07-27). A value stated in standard L/min cannot be inserted directly into a pressurized-line velocity equation.
For an ideal-gas screening conversion:
is volume flow at the declared reference condition, while is the approximate volume flow inside the pressurized line. Pressures and temperatures must be absolute. Once the actual line flow is known, average velocity in a circular passage is:
This checks a known tube ID. It does not prove that the valve and complete path can deliver the requested mass flow.
Darcy-Weisbach can screen a straight, fully developed segment when its density, velocity, friction factor, length, and diameter are consistent with the selected approximation:
Do not accept the result if the calculated loss is large enough to invalidate the constant-density assumption. Do not apply one roughness value or friction factor to every polyurethane, aluminum, galvanized, or contaminated line without a defensible source.
Equivalent length is also a screening device, not a universal component rating. A K-value depends on geometry and flow conditions. Valves, quick couplers, check valves, filters, regulators, and silencers should be checked against the exact manufacturer’s pressure-flow curve, sonic conductance , critical pressure ratio , or a measured differential at the required operating point.
Do not combine restrictions using a diameter-only “compensation factor.” Series pneumatic components interact through their shared mass flow and intermediate pressures. ISO 6358-3 provides the relevant system framework when the required component characteristics are known.
For early pipe screening, the compressed-air pressure-drop calculator can compare flow, length, internal diameter, working pressure, and equivalent fitting length. Keep it as an estimate. Use the Cv calculator only when the supplier’s coefficient and convention match the gas-flow problem. Neither tool replaces the dynamic resistance budget.
A Fix Order That Preserves the Evidence
CAGI states that every 2 psig of excess operating pressure increases positive-displacement compressor power by approximately 1%, while also warning that raising compressor or regulator pressure should not be the first response to excessive pressure drop (CAGI, Pressure Drop FAQs, accessed 2026-07-27). Fix the measured restriction before increasing the plant-wide setpoint.
Use this order:
- Reproduce the fault under the same load, motion direction, supply setting, valve command, and concurrent demand.
- Bracket the complete supply and exhaust paths with synchronized pressure channels.
- Split only the segment with the largest repeatable dynamic pressure difference.
- Inspect reversible installation faults: kinked tube, incomplete insertion, excess sealant, wrong controller direction, clogged element, debris, or partially closed isolation valve.
- Compare the exact component model and active flow direction with its manufacturer curve or ISO 6358 data.
- Change one item at a time, then repeat the same cycle and analysis window.
- Accept the repair only when the pressure trace and the machine symptom improve together.
From our analysis, the strongest conclusion is an A/B result in which the same segment pressure difference and the original machine symptom improve after one documented change. A lower gauge reading without the same load, flow demand, and timing does not establish the cause.
A lower segment drop is not automatically an improvement. If the changed part also reduced the required flow, slowed the actuator, or removed intentional meter-out control, the smaller pressure difference proves nothing. Validate stroke time, load behavior, stability, and both chamber pressures with the trace.
Your test report should include sensor models and locations, gauge or absolute reference, sample rate, shared timing method, machine state, cylinder and valve models, tube ID and length, controller setting, silencer condition, load, orientation, and before/after files. That record makes the conclusion reproducible.
FAQs About Flow Resistance in Pneumatic Systems
Why can static pressure look normal while the cylinder still moves slowly?
Static pressure usually recovers when flow stops. A restrictive valve, tube, fitting, port, or silencer creates its largest pressure difference while the chamber is filling or exhausting. Log adjacent pressures during the slow part of the stroke and compare them at the same timestamps.
How many pressure sensors do I need to locate a restriction?
Start with two synchronized sensors bracketing the complete suspected path. If they show a meaningful dynamic difference, move one sensor or add a third point to split that segment. Continue inward until one component or short assembly is isolated. More channels help only when their timing and pressure references remain consistent.
Can I add the K-values or pressure drops of components in series?
You may sum adjacent pressure differences measured at the same instant. Do not add fixed catalog pressure drops taken at different flows or combine diameter-only “compensation factors.” For prediction, use compatible component characteristics and a compressible-flow system method such as ISO 6358-3.
When is Darcy-Weisbach appropriate for a pneumatic line?
Use it as a straight-line screening calculation when actual line flow, density, diameter, length, friction factor, and the constant-density approximation are defensible. If the predicted loss is a substantial part of supply pressure, or a valve, orifice, regulator, check element, or choked restriction controls the path, use compressible-flow data or the manufacturer’s tested curve instead.
Sources and technical references
- CAGI, Technical Brief on Pressure Drop, system pressure-drop target, monitoring taps, and corrective priorities. Retrieved 2026-07-27.
- CAGI, Pressure Drop FAQs, compressor-power relationship and pressure-setting warning. Retrieved 2026-07-27.
- U.S. Department of Energy, Improving Compressed Air System Performance: A Sourcebook for Industry, pressure profiling and time-synchronized pressure/flow logging. Retrieved 2026-07-27.
- ISO 6358-1:2013, steady-state flow-rate testing of pneumatic components using compressible fluids. Retrieved 2026-07-27.
- ISO 6358-3:2014, system flow characteristics using known component and piping characteristics. Retrieved 2026-07-27.
- NASA, Mass Flow Rate Equations, gas mass-flow continuity and compressibility. Retrieved 2026-07-27.
- NIST, Technical Note 2294, distinction between measured pressure drop and irreversible pressure loss. Retrieved 2026-07-27.
- Parker, Pneumatic Technical Guidelines, free-air reference conditions and absolute-pressure guidance. Retrieved 2026-07-27.