

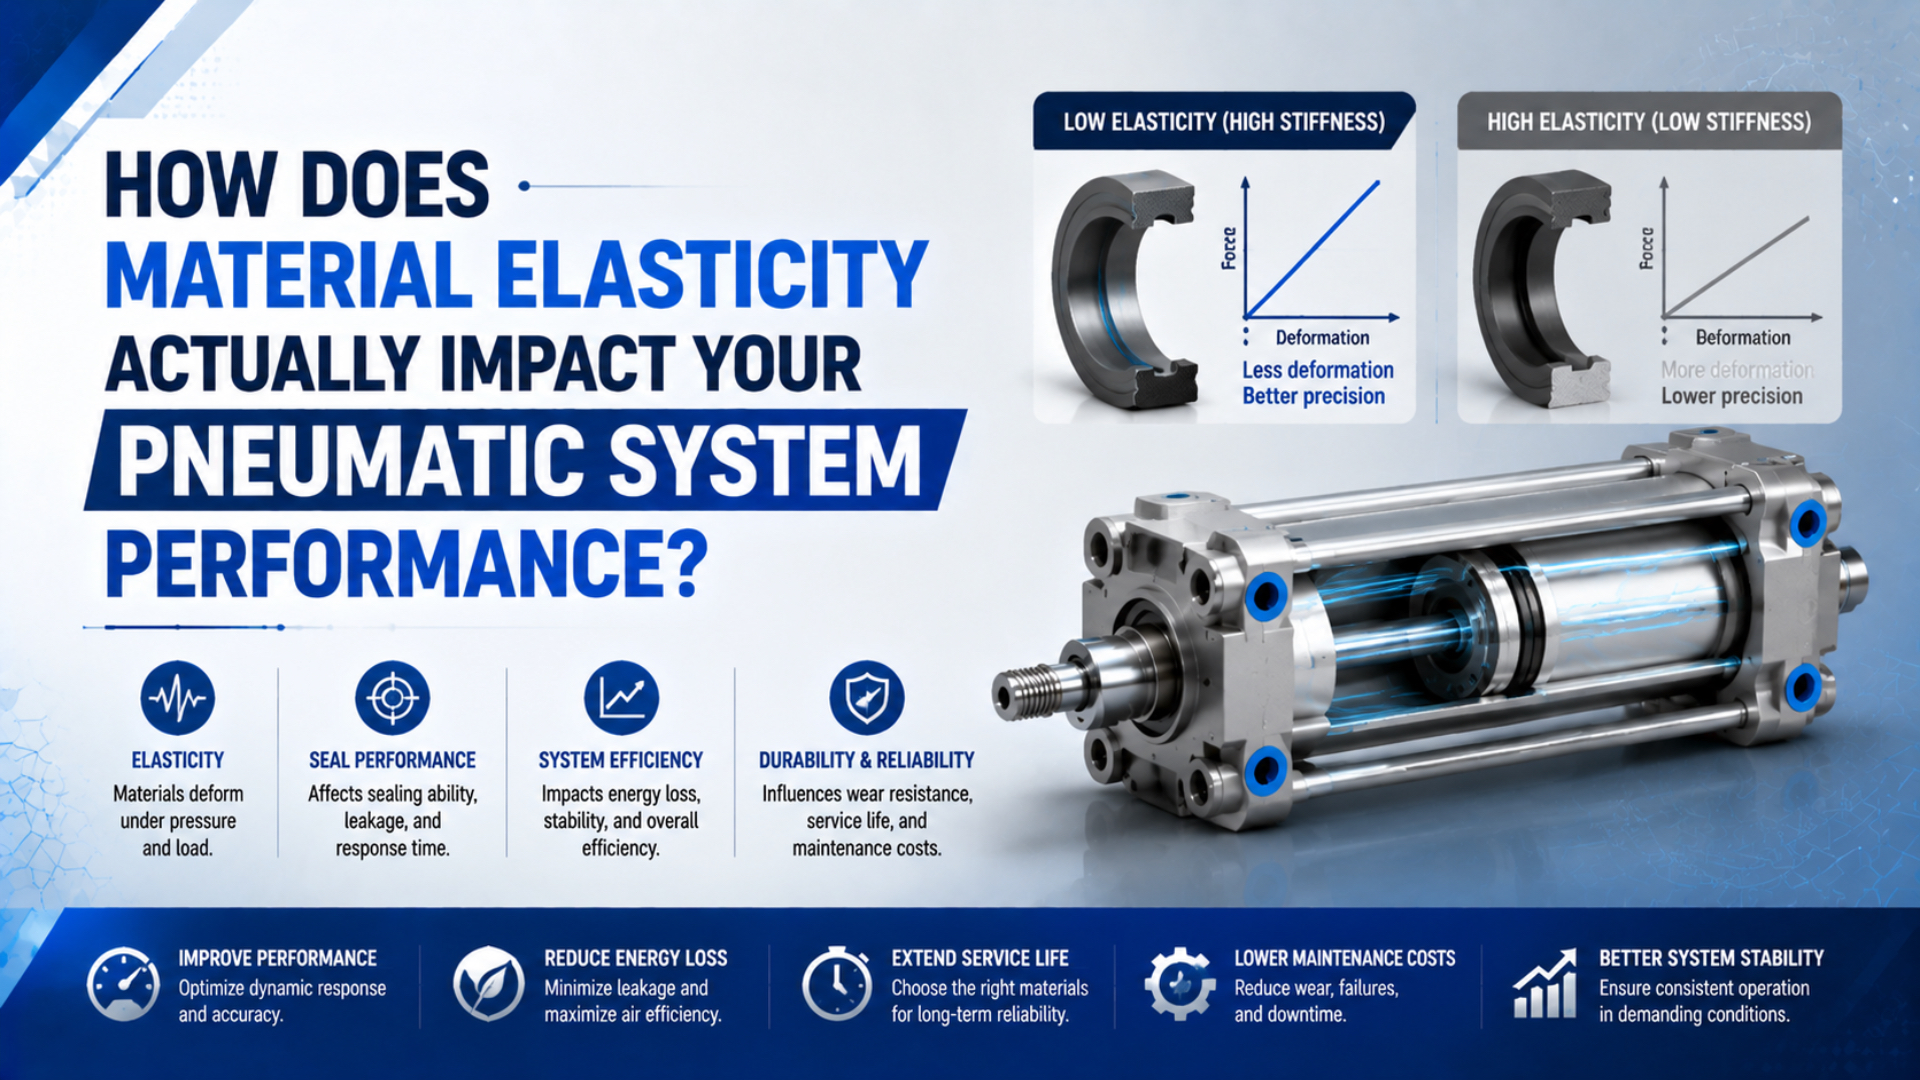
Material elasticity affects pneumatic performance by allowing rods, brackets, mounts, frames, tube walls, and seals to deform under load. Yet elastic modulus alone rarely predicts the machine’s position error or vibration. Geometry, unsupported length, joint contact, compressed-air volume, friction, clearance, valve state, and controller behavior can contribute more movement than the selected metal or polymer.
The practical method is to build a stiffness budget around the real load path. Calculate each structural contribution with the correct boundary condition, model chamber air separately, and measure the assembled machine at a defined operating point. This keeps stiffness, strength, fatigue, creep, seal recovery, repeatability, and positioning accuracy from being collapsed into one vague “elasticity” claim.
Key Takeaways
- A 16 mm steel rod example elongates about 0.012 mm under 1 kN.
- Geometry and load path can outweigh material modulus.
- Add structural compliances in series; model chamber air separately.
- Seal recovery needs compound-specific tests.
- Fatigue requires stress-cycle data, not a percentage of yield strength.
What Does Material Elasticity Actually Change?
ISO 6892-1:2019, confirmed in 2025, defines room-temperature tensile testing for metals, while ISO 37:2024 uses a separate method for vulcanized and thermoplastic rubber. The split matters: one modulus value cannot describe every component or every loading mode in a pneumatic assembly (ISO 6892-1; ISO 37).
Elasticity is the recoverable relationship between stress and strain over a stated range and test condition. Stiffness is the force-to-displacement relationship of a particular component or assembly. A material property such as Young’s modulus contributes to stiffness, but the part’s length, cross-section, shape, constraint, temperature, and load direction determine how that property appears at the machine.
That distinction separates several symptoms that are often mixed together:
| Machine observation | Main quantity to investigate | Why modulus alone is insufficient |
|---|---|---|
| Tool point moves when load changes | Assembly stiffness and clearance | Mounts, guides, joints, rod, and frame move together |
| Cylinder feels soft while holding position | Gas stiffness, valve state, leakage, friction | Connected chamber and tube volume changes pressure response |
| Seal leaks after hot operation | Compound compatibility, compression set, wear | Elastomers are time-, temperature-, and medium-dependent |
| Bracket stays bent after unloading | Proof/yield limit or local damage | Recoverable modulus does not define permanent deformation |
| Mount cracks after many cycles | Fatigue load spectrum and local stress | Fatigue can occur below monotonic yield strength |
| Position varies by motion direction | Friction, hysteresis, clearance, control | Elastic displacement may be only one part of the reversal error |
Material elasticity therefore changes how load is stored and released, but it does not identify the whole error. For precision work, document force, position, valve state, chamber pressures, temperature, approach direction, dwell time, and measurement location. Otherwise two stiffness measurements may describe different operating points.
A Pneumatic System Stiffness Budget
NASA’s SPAR structural reference gives the axial spring constant of a uniform member as . This equation shows that stiffness rises with cross-sectional area and modulus, and falls with length. Real pneumatic load paths contain several such elastic contributors plus joints that must be measured rather than inferred (NASA SPAR Reference Manual).
For a uniform axial member in its linear range:
Here, is component stiffness in N/mm, is load-carrying area in mm², is Young’s modulus in N/mm², and is loaded length in mm. The relationship assumes small deformation, uniform axial stress, a constant cross-section, and a material response that is locally linear.
When components carry the same force in series, their compliances add:
The structural displacement caused by an incremental load is then:
This model can include a mounting plate, bracket, rod, rod-end joint, guide, fixture, and machine frame. It should not silently include air compression, bearing clearance, backlash, or controller error. Keep those as separate terms until their behavior has been measured or modelled.
The weakest stiffness term usually controls a series chain. Suppose a simplified axis has measured or calculated stiffness values of 50, 20, 100, and 80 kN/mm. Their reciprocal sum gives an equivalent stiffness of 10.8 kN/mm. A 1 kN load change then produces about 0.0925 mm of structural movement, even though no individual component moves that far.
Geometry Versus Material Modulus
A NASA cantilever example uses an aluminum elastic modulus of 69 GPa and the relationship . Unsupported length enters with the third power, while section geometry enters through the second moment of area. Changing shape or support can therefore outweigh a modest material substitution (NASA/TM-2018-219863).
For a free-end point load on an ideal uniform cantilever:
In this equation, is transverse tip deflection, is the transverse load, is unsupported length, is Young’s modulus, and is the section’s second moment of area. The formula is valid only when the real component behaves like the assumed fixed beam and deflection remains small.
The power terms make design priorities clear. Halving the ideal unsupported length reduces the calculated deflection to one-eighth. For a solid round section, , so increasing diameter changes bending stiffness by the fourth power. The same material can feel either flexible or stiff depending on geometry and constraint.
This is why a higher-modulus rod doesn’t automatically correct a soft axis. The mounting plate, clevis rotation, guide rail, bearing clearance, or frame may still dominate. Our cantilevered cylinder-deflection guide defines the fixed-beam assumptions, while the horizontal piston-rod guide separates point load from rod self-weight.
Do not make a cylinder rod carry transverse payload reaction when an external guide should carry it. Side load changes bearing and seal forces, creates bending, and can invalidate a simple axial model. Geometry correction should begin with the load path, not a material upgrade.
How Much Does a 16 mm Piston Rod Actually Stretch?
NASA educational material gives axial deflection as and distinguishes stiffness from strength. Using a 16 mm solid rod, 500 mm loaded length, 1,000 N axial force, and an illustrative steel modulus of 200,000 N/mm² gives 0.0124 mm elongation, not tenths of a millimetre (NASA CP-3259).
The rod area is:
Axial elongation is:
This is an ideal linear-elastic calculation. It excludes thread deformation, rod-end geometry, bearing rotation, mount flexibility, temperature gradients, surface contact, and load eccentricity. It also assumes 200 GPa rather than a certified modulus for the actual rod grade and heat treatment.
The calculation is valuable because it sets an order of magnitude. If the measured tool-point shift is 0.25 mm under the same incremental load, the ideal rod elongation accounts for only about 5% of the observation. Reinforcing or shortening the dominant mount may produce more improvement than changing rod material.
The force input must also be the force actually transmitted through the member, not simply nominal cylinder thrust. Chamber pressure, back pressure, friction, acceleration, gravity, and external reactions change the load. Use the Cylinder Force Calculator only as an upstream force estimate, then replace assumptions with measured chamber pressures and a free-body diagram.
Where Does Compressed-Air Stiffness Enter?
A published pneumatic-isolator model gives chamber stiffness as for an adiabatic small-displacement condition. Absolute pressure, piston area, connected volume, and thermal process all matter. This pneumatic spring is separate from metal or frame elasticity and changes with piston position and valve state (Journal of Sound and Vibration).
A useful local model is:
Here, is pneumatic stiffness near the operating point, is the chosen polytropic exponent, is absolute chamber pressure, is effective piston area, and is the connected chamber, port, fitting, manifold, and tube volume. Use consistent SI units.
For a double-acting cylinder, calculate both chamber contributions with their own areas, pressures, and volumes. Rod-side annular area differs from cap-side piston area. The connected volume also varies with piston position, so stiffness near one end of stroke can differ from stiffness near mid-stroke.
Valve state changes the boundary. A closed chamber acts differently from one connected through a valve to a regulator, exhaust restriction, accumulator, or leak path. Slow and rapid disturbances also exchange heat differently, so one value of is not valid for every frequency and dwell time.
Tube material belongs in this model only through its measured or published wall-volume response. Tube inside diameter and length first create a calculable gas volume. The separate guide to tubing compliance and cylinder positioning stiffness shows how to add that volume without inventing a universal polyurethane or nylon correction factor.
Why Can’t Poisson’s Ratio Predict Seal Life?
ISO 815-1:2019 normally measures compression set after 25% constant strain for rubbers below 80 IRHD, with lower strain for harder compounds. The standard states that time, temperature, recovery conditions, and chemical changes affect permanent set. Poisson’s ratio alone does not capture those variables (ISO 815-1).
Poisson’s ratio describes transverse strain relative to axial strain within a stated material model. It helps linear elasticity calculations for small-strain isotropic solids, but a working pneumatic seal experiences contact, large deformation, friction, pressure energization, viscoelastic relaxation, wear, temperature, lubricant, and chemical exposure.
Parker’s O-Ring Handbook adds compound composition, manufacturing conditions, specimen thickness, test medium, deformation, temperature, and time to the compression-set dependency list. It also cautions that test results can be compared only when the relevant conditions are identical (Parker O-Ring Handbook).
Do not infer these properties from Poisson’s ratio:
- compression-set resistance;
- seal contact pressure after thermal ageing;
- extrusion resistance at a stated clearance and pressure;
- dynamic friction or stick-slip;
- chemical swelling or shrinkage;
- wear rate or service life;
- leakage under pressure cycling.
ISO 37:2024 measures tensile stress-strain properties for rubber and notes that yield measurements apply only to some thermoplastic rubbers and certain compounds. ISO 7743:2017 uses separate compression procedures. A seal specification should therefore identify the compound, hardness method, compression-set test, medium, temperature, duration, gland geometry, extrusion gap, surface, and dynamic duty.
For material-specific selection, see the piston-seal material science guide. It treats NBR, FKM, polyurethane, and PTFE-related designs as distinct compound and construction choices rather than one “rubber modulus” category.
Elasticity, Yield, Creep, and Fatigue
ISO 1099:2017 generates fatigue information as applied stress versus cycles to failure for a given metallic material condition and stress ratio. That is different from the monotonic properties obtained under ISO 6892-1. A component can remain nominally elastic during each cycle and still accumulate fatigue damage (ISO 1099; ISO 6892-1).
Keep four behaviors separate:
| Behavior | What happens after load is removed? | Evidence to use |
|---|---|---|
| Elastic deformation | Part substantially returns within the stated range | Modulus or load-deflection curve at temperature |
| Yield/plastic deformation | A permanent dimensional change remains | Applicable proof/yield test and component stress analysis |
| Creep/relaxation | Deformation or force changes with time under sustained condition | Time-temperature-load data for the exact material |
| Fatigue | Crack initiation and growth occur under repeated loading | Stress-cycle or strain-cycle data, stress ratio, surface and environment |
The 0.2% proof value is not a universal physical boundary for every metal, polymer, or rubber. It is one defined way of reporting a non-proportional extension when a distinct yield point is unavailable. Likewise, “operate at 60% of yield” is not a fatigue design method.
Fatigue review needs the cyclic force range, mean load, stress ratio, cycles, transients, emergency stops, geometry, local concentration, residual stress, surface condition, corrosion, temperature, and manufacturing history. ISO 1099 explicitly ties the stress-cycle result to material condition and stress ratio, and excludes deliberately notched specimens from its base scope.
Our tie-rod and mount fatigue guide covers load histories and fracture evidence in more detail. Do not label every permanent offset as fatigue. A bent bracket, loose joint, worn bearing, compression-set seal, and cracked mount require different corrective actions.
How Should You Measure Stiffness on the Machine?
SMC’s cylinder guidance tells users not to apply excessive lateral load and to align the load’s center of gravity with the cylinder center. Those instructions show why a stiffness test must preserve the real alignment and load path. A displaced indicator alone cannot identify which element moved (SMC MWB operation manual).
Use a controlled incremental test:
- Isolate hazardous energy and secure the mechanism before installing instruments.
- Define the operating point: piston position, chamber pressures, valve state, temperature, payload, and controller mode.
- Place a calibrated force sensor or known test load along the real working direction.
- Put displacement indicators across suspected interfaces: machine base to mount, mount to cylinder, cylinder to carriage, carriage to tool.
- Apply increasing and decreasing load steps without exceeding approved component limits.
- Record force, displacement, pressure, temperature, direction, dwell, and recovery after unloading.
- Repeat from both approach directions to expose clearance, friction, and hysteresis.
Local incremental stiffness comes from the slope:
Use only the locally linear portion around the documented operating point. If the loading and unloading paths differ, report both curves rather than one averaged stiffness. If displacement continues during a hold, add time to the result. If it remains after unloading, investigate permanent set, joint slip, or damage.
A set of indicators placed across interfaces converts one unexplained tool-point error into a displacement balance. The sum of the measured local movements should approximately close against tool-point movement. A large residual points to an unmeasured interface, sensor mounting error, thermal drift, or control motion.
Positioning accuracy is broader than stiffness. Resolution, repeatability, friction, dead band, valve flow, air volume, feedback, controller tuning, and external disturbance still matter. The pneumatic servo positioning limits guide explains why a stiff mechanism can still miss a target.
What Belongs in a Design Review or RFQ?
ISO 1099 links fatigue results to material condition and stress ratio, while ISO 815-1 ties compression set to time, temperature, deformation, recovery, and medium. A useful RFQ must therefore request service conditions and test evidence, not just aluminum, steel, polyurethane, or NBR by name (ISO 1099; ISO 815-1).
Include these inputs:
- load direction, magnitude, mean load, peak load, and cycle spectrum;
- emergency-stop, impact, pressure-spike, and jam conditions;
- component geometry, unsupported length, mounting arrangement, offsets, and guide reactions;
- permitted tool-point displacement under a stated incremental load;
- operating position, valve state, chamber pressures, tube volumes, and temperature;
- material grade, heat treatment, condition, modulus source, and applicable temperature;
- seal compound, hardness method, medium, pressure, speed, surface, gland, and extrusion gap;
- required proof, leakage, stiffness, recovery, fatigue, or endurance tests;
- sample size, acceptance limits, measurement uncertainty, and traceability;
- change-notification requirements for material, process, geometry, and supplier.
For a replacement cylinder, do not accept equivalent bore and stroke as proof of equal machine stiffness. Compare mounts, rod size, bearing arrangement, carriage or guide data, port and tube volumes, permissible loads, sensor architecture, and installation tolerances. Then measure the assembled candidate under the same operating condition.
The design review should finish with one displacement budget and several separate safety checks. Structural stiffness addresses recoverable movement. Pressure rating addresses containment. Buckling addresses axial stability. Fatigue addresses repeated loading. Seal compatibility addresses medium and temperature. Treating those as distinct checks makes the final approval easier to audit.
Material Elasticity FAQs: What Should Engineers Check?
NASA’s axial and cantilever relations show that area, length, and section geometry appear alongside modulus, while ISO maintains separate test methods for metals and rubber. These answers therefore use component-specific equations and evidence rather than universal deformation limits or material rankings (NASA CP-3259; ISO 37).
Is a higher Young’s modulus always better for pneumatic accuracy?
No. A higher modulus can reduce deformation for unchanged geometry and boundary conditions, but the mount, frame, guide, joint, compressed air, clearance, friction, and control loop may dominate. Find the largest displacement contribution before changing material, and confirm that the substitute still meets corrosion, wear, mass, manufacturing, and fatigue requirements.
How much elastic deformation is acceptable in a pneumatic cylinder?
There is no universal millimetre limit. The acceptable value comes from the machine’s tool-point tolerance after allocating sensor, control, clearance, thermal, gas, and structural errors. State the force change, piston position, pressures, temperature, direction, valve state, dwell, and measurement points with every acceptance value.
Does Poisson’s ratio determine whether a pneumatic seal will leak?
No. Poisson’s ratio describes one strain relationship within a material model. Leakage depends on compound behavior, gland geometry, contact pressure, extrusion gap, surface condition, pressure cycling, speed, lubricant, medium, temperature, wear, and compression set. Use compound-specific tests and application evidence rather than a generic Poisson-ratio comparison.
Can a component fail from fatigue below its yield strength?
Yes. ISO 1099 characterizes fatigue through stress versus cycles for a stated material condition and stress ratio. Repeated elastic-range loading can initiate and grow cracks. Review the load spectrum, mean stress, local geometry, surface, residual stress, corrosion, temperature, and manufacturing condition instead of applying one percentage of yield strength.
How can I separate structural elasticity from compressed-air compliance?
Measure displacement across structural interfaces while recording both chamber pressures. Repeat with a defined valve state and operating position. A structural model uses member and joint stiffness; a pneumatic model uses absolute pressure, effective area, connected volume, and thermal assumption. Compare both with measured tool-point displacement and investigate the remaining residual.
Sources and Technical References
- NASA SPAR Reference Manual, accessed 2026-07-27. Used for the axial spring constant and structural stiffness framing.
- NASA CP-3259, National Educators’ Workshop, accessed 2026-07-27. Used for axial deflection and the distinction between strength, stiffness, and stability.
- NASA/TM-2018-219863, accessed 2026-07-27. Used for the cantilever relationship and the cited 69 GPa aluminum example.
- ISO 6892-1:2019, Metallic materials, tensile testing at room temperature, accessed 2026-07-27. Used for metallic tensile-property and proof/yield test boundaries.
- ISO 1099:2017, Metallic materials, axial force-controlled fatigue testing, accessed 2026-07-27. Used for stress-cycle, material-condition, and stress-ratio requirements.
- ISO 37:2024, Rubber tensile stress-strain properties, accessed 2026-07-27. Used for rubber-specific tensile properties and yield applicability.
- ISO 7743:2017, Rubber compression stress-strain properties, accessed 2026-07-27. Used to distinguish compression response from a generic tensile modulus.
- ISO 815-1:2019, Rubber compression set, accessed 2026-07-27. Used for compression strain, time, temperature, recovery, and permanent-set conditions.
- Parker O-Ring Handbook, accessed 2026-07-27. Used for compound-, geometry-, medium-, temperature-, and time-dependent compression set.
- Static and dynamic stability of pneumatic vibration isolators and systems of isolators, accessed 2026-07-27. Used for the local pneumatic chamber stiffness relationship.
- SMC MWB operation manual, accessed 2026-07-27. Used for lateral-load and alignment constraints.