

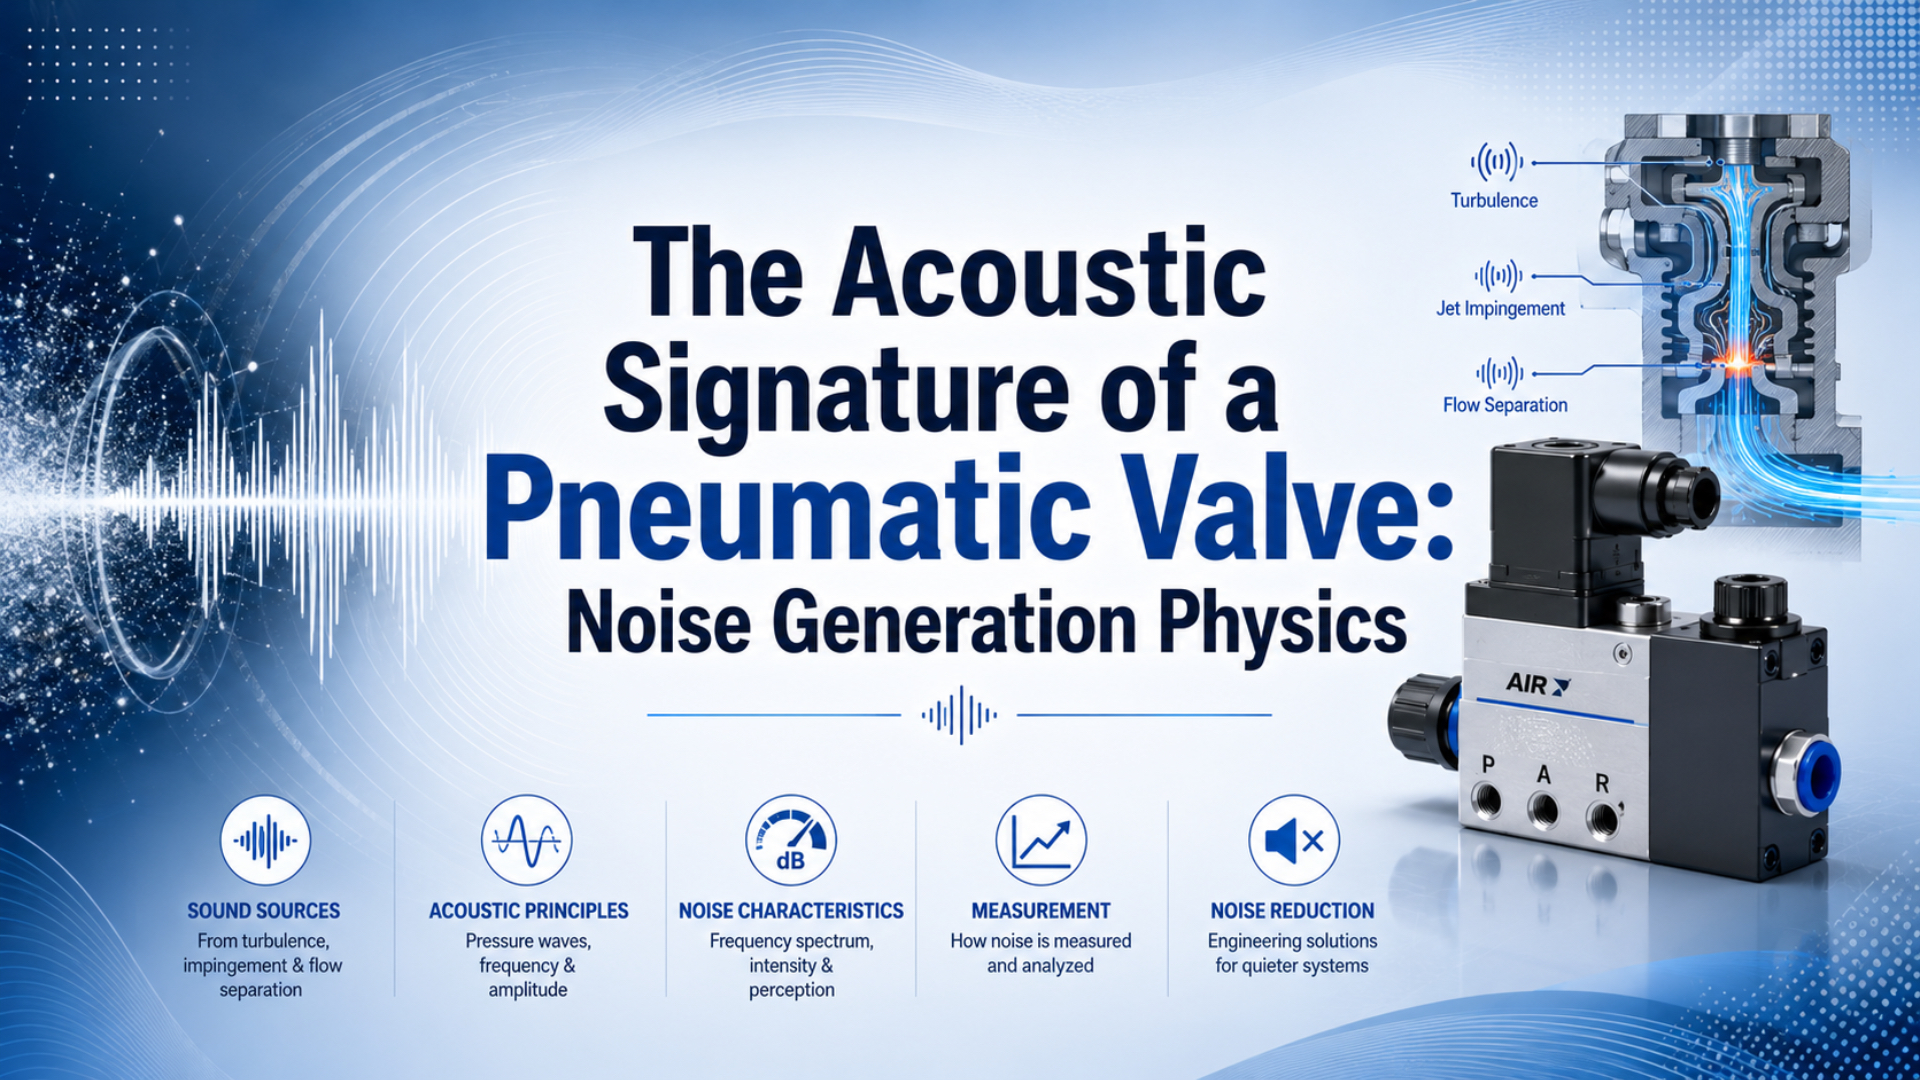
A pneumatic valve does not have one fixed sound. Its acoustic signature is the time pattern and frequency content produced by air expansion, internal throttling, moving parts, exhaust hardware, and the surrounding machine during a defined operating event.
That definition changes the diagnostic question. A louder cycle is evidence of a change, not proof of a failed valve. The microphone may be hearing a discharge jet, a spool or armature impact, a pipe resonance, a leaking fitting, or the cylinder striking its stop. Identify the source and measurement boundary before selecting a remedy.
Key Takeaways
- Sound pressure is logarithmic and referenced to 20 µPa in air; a bare dB value needs weighting, time response, position, and operating conditions.
- Separate exhaust, internal flow, mechanical impact, and structure-borne paths before blaming the valve.
- A repeatable baseline is more useful for diagnosis than a universal “normal valve” level.
- Verify noise controls against exhaust back pressure, actuator speed, safe motion, and worker exposure.
What Is a Pneumatic Valve Acoustic Signature?
A pneumatic valve acoustic signature is a repeatable set of sound features tied to a defined valve event and operating condition. NIST uses 20 µPa as the reference sound pressure in air, which means the measurement is a logarithmic level rather than a direct pressure reading (NIST Guide to the SI, retrieved 2026-07-22).
A useful signature can contain several views of the same event:
- the time waveform around energization, spool movement, and exhaust;
- A-weighted or unweighted level over a specified interval;
- peak or maximum level with the instrument response stated;
- one-third-octave bands or a narrowband spectrum;
- a spectrogram showing how frequency content changes during the cycle;
- repetition statistics across comparable cycles.
The sound pressure level is defined by:
Here, is sound pressure level in decibels, is the root-mean-square sound pressure over the stated averaging interval, and is the reference sound pressure of 20 µPa in air. The logarithm is why dB values cannot be averaged arithmetically. The interval, frequency weighting, and microphone position remain part of the result.
A single phone reading beside a valve may help locate a loud event, but it is not automatically a product emission value or an employee exposure assessment. ISO 11201 defines measurement at workstations and specified positions. ISO 3744:2025 uses sound-pressure measurements over an enveloping surface to determine sound power. Those quantities answer different questions.
Where Does Pneumatic Valve Noise Come From?
Four source families usually need to be separated: exhaust-jet noise, internal flow noise, mechanical actuation, and vibration radiated by attached structures. IEC 60534-8-3 requires at least 2 m of straight downstream pipe for its specified control-valve noise method, showing how strongly the test arrangement affects a reported result (IEC 60534-8-3, 2010).
Exhaust and internal flow sources
Air venting from a valve or pilot stage forms a compressible jet. Mixing, expansion, shocks under some pressure ratios, and interaction with the exhaust geometry can create broadband and tonal components. Inside the valve, local jets can form across a seat, spool land, pilot restriction, or partially open metering edge.
The loudest point may be outside the valve body. A muffler, fitting, tube end, manifold gallery, or remote exhaust line can radiate the dominant airborne sound. Move the microphone systematically and compare exhaust ports before concluding that the body is the source.
Mechanical and structure-borne sources
Solenoid armatures, spools, springs, pilot elements, and manual overrides can produce short impacts. The valve base then transfers vibration into the manifold, panel, guard, or machine frame. A large panel can radiate more efficiently than the small component exciting it.
The machine can add unrelated events at nearly the same time: a cylinder reaches its stop, a gripper jaw hits a part, tubing snaps against a guard, or a loose bracket rings. Electrical command timing alone does not prove which component made the sound.
How Do Pressure Ratio and Flow Change Valve Noise?
Pressure ratio and mass flow change jet structure and available acoustic energy, but no universal dB-per-psi rule applies. ISO 6358-1 defines steady-state pneumatic flow characteristics, while the SMC AN silencer catalog states its recommended flow at a specific 0.5 MPa inlet condition (ISO 6358-1; SMC AN Series, retrieved 2026-07-22).
Use upstream and downstream absolute pressure when assessing compressible flow. A differential pressure alone does not identify the pressure ratio. The ideal-gas critical ratio is a useful concept, but a pneumatic component’s measured critical pressure ratio and sonic conductance belong to its tested flow characteristic.
Choked flow means the restriction has reached its mass-flow limit for the current upstream state. It does not mean the entire valve, pipe, or exhaust plume is uniformly at the speed of sound. It also does not assign a sound level. Geometry, flow rate, pressure, temperature, downstream hardware, directivity, and distance still influence the measured noise.
The choked-flow physics guide explains the flow limit in more detail. For acoustic work, record the same pressure and flow conditions during every comparison. If the operating point changes, the signature may change even when the valve remains healthy.
Do not transfer IEC 60534-8-3 predictions blindly to every compact pneumatic valve. The standard covers specified single-stage industrial process-control valve types and dry single-phase gases under defined piping assumptions. A small direct-acting directional valve, open exhaust, pilot vent, or manifold may fall outside that prediction boundary.
Reading dB, dBA, Peak, and Frequency Data
A reported noise number is incomplete until its weighting, detector response, averaging interval, position, and operating event are identified. NIOSH explains that a 3 dB increase represents twice the sound energy, while 10 dB represents ten times the energy (NIOSH HHE Report, 2024).
| Reported quantity | What it tells you | What it does not tell you alone |
|---|---|---|
| dB or dBZ | Broad unweighted or Z-weighted level | Human hearing risk without exposure context |
| dBA | Level shaped approximately for hearing-risk assessment | Which frequency or component changed |
| dBC | Wider low-frequency contribution and some high-level checks | Full peak waveform or source location |
| Fast or Slow maximum | Instrument response over a stated period | True instantaneous peak without suitable instrumentation |
| Peak sound pressure | Highest captured waveform pressure | Daily exposure dose |
| Spectrum | Level versus frequency | When each feature occurred during the valve cycle |
| Spectrogram | Frequency content versus time | Cause without command, pressure, and mechanical context |
A-weighted data are useful for worker exposure and product emission comparisons made under the same method. Unweighted waveforms and spectra are often more useful for engineering diagnosis because weighting can suppress frequency regions that still identify an impact, resonance, or electrical drive pattern.
Decibels must be combined logarithmically. Two identical independent sources at the same receiving point add about 3 dB, not twice the dB value. Room reflections, phase relationships, and time overlap complicate real machines, so source isolation is still preferable to subtraction by assumption.
How Should Pneumatic Valve Noise Be Measured?
A repeatable valve-noise test fixes the microphone position, mounting, background, command event, pressure, flow, load, and instrument settings. ISO 11201 can produce grade 1 or grade 2 emission sound-pressure results at workstations or specified positions when its environmental and operating requirements are met (ISO 11201, 2010).
Start with the question being answered:
- Product comparison: compare valves under the same test code, mounting, ports, pressure, flow, command, exhaust hardware, and microphone geometry.
- Fault diagnosis: compare the suspect cycle with a matched healthy baseline and synchronized process data.
- Worker exposure: measure the worker’s changing exposure across tasks and locations, not only beside one valve.
- Source location: use controlled microphone movement, shielding, temporary isolation, or multiple channels without changing the operating condition.
Minimum test record
Record the valve part number, manifold, voltage, command duration, supply and downstream pressure, medium temperature, flow or actuator duty, exhaust fittings, mufflers, tube dimensions, mounting surface, and nearby machine state. For switching events, save pre-trigger and post-trigger data around the electrical command.
The acoustic fields must also be reproducible:
- Mark microphone distance, angle, and height from a defined valve datum.
- State dBA, dBC, or Z weighting and Fast, Slow, equivalent, or peak processing.
- Record sampling rate and frequency bandwidth for waveform or spectrum work.
- Measure background with the target event absent but the surrounding plant in a comparable state.
- Calibrate the measurement chain according to the instrument and test procedure.
- Repeat enough matched cycles to distinguish a persistent change from cycle variation.
ISO 3744:2025 is appropriate when the goal is engineering-grade sound power from an enveloping measurement surface, except for short impulsive events within its stated scope. A valve-switching pulse may require a different time-domain method or test code. State the limitation instead of presenting one meter maximum as sound power.
Building a Healthy Acoustic Baseline
A healthy acoustic baseline begins with a defined machine state and repeatable data collection, not a universal alarm level. ISO 17359:2018 provides general procedures for machine condition-monitoring programs, while ISO 13373-1 emphasizes measurement method, transducer location, operating condition, data collection, and signal processing (ISO 17359; ISO 13373-1).
In our experience, the fastest useful baseline is a small matrix, not one “normal dB” number. Record several healthy cycles at low, normal, and high demand, then separate cold start from thermally stable operation. The comparison becomes much stronger when each acoustic trace shares a timestamp with valve command and dynamic pressure.
Keep these baseline fields together:
- valve and manifold order codes;
- coil voltage, driver type, and command waveform;
- inlet and relevant port pressures during the event;
- load, actuator speed, dwell, and cycle rate;
- exhaust hardware and contamination state;
- microphone and accelerometer position;
- weighting, sampling, bandwidth, and processing;
- temperature and surrounding-machine state;
- accepted waveform, spectrum, and feature limits.
Baseline limits can be statistical, but they must match the application. A slow-moving average may detect gradual drift yet hide a short impact. A narrow frequency alarm may find a new resonance but miss a broadband exhaust change. Use features tied to plausible failure modes and retain the raw data needed to review false alarms.
What Can a Changed Valve Sound Diagnose?
A changed sound can localize a fault region and prioritize tests, but it cannot identify every root cause by itself. ISO 13373-1 explicitly notes that complete diagnosis may require process variables, temperatures, pressures, and other parameters in addition to vibration measurements (ISO 13373-1, confirmed 2024).
| Acoustic observation | Plausible causes | Confirmation measurement |
|---|---|---|
| Stronger exhaust burst with similar timing | higher pressure ratio, higher flow, removed or damaged muffler | dynamic pressure, flow condition, exhaust inspection |
| Longer exhaust decay | restricted muffler, long exhaust line, larger volume, leakage | port pressure decay, actuator time, muffler differential pressure |
| New sharp impact at command edge | armature, spool, relay, tubing, bracket, or nearby mechanism | accelerometer location, isolated command test, high-speed waveform |
| Repeating chatter | unstable pilot supply, coil drive, control logic, spool movement, or contact bounce | coil voltage/current, pilot pressure, valve state, PLC trace |
| Narrow tone that shifts with mounting | panel, manifold, tube, guard, or cavity resonance | temporary bracing, accelerometer, controlled microphone scan |
| Hiss while the valve should be static | external leak, internal leakage to exhaust, regulator flow, or another branch | ultrasonic localization, isolation, pressure-decay or leakage test |
| Acoustic change with unchanged valve trace | downstream impact, load, tube movement, or surrounding machine | actuator position, structure vibration, event sequencing |
In our experience, the quickest diagnostic split is to mute one energy path at a time without creating a new hazard. Compare exhaust ports, brace a suspected panel temporarily, separate the cylinder impact in the control sequence, or trigger the valve without production contact when the approved procedure allows it. Then confirm the hypothesis with pressure, vibration, leakage, or electrical evidence.
Avoid training a classifier on filenames alone. A condition-monitoring model needs labeled operating states, controlled sensor placement, enough healthy variation, known faults, and an independent validation set. Otherwise it may learn production speed, background machinery, or microphone position instead of valve condition.
Reducing Noise Without Creating Another Problem
Noise controls must be verified against flow, back pressure, cycle time, and safe motion. SMC lists 30 dB(A) noise reduction for a specific AN silencer series, while Festo reports 60 to 68 dB(A) at 6 bar and 1 m for specified UC variants. Those are model-level conditions, not universal silencer results (SMC; Festo UC).
Apply controls in this order:
- Reduce the source: remove unnecessary pressure, avoid abrupt overdriving, repair leakage, correct chatter, and prevent hard mechanical impact.
- Control the exhaust: select a silencer or remote exhaust arrangement from flow data and the permitted back pressure.
- Interrupt structure paths: correct loose mounting, prevent tube strike, add stiffness or isolation only after identifying the radiating surface.
- Control the propagation path: use barriers or enclosures while preserving ventilation, access, visibility, and safe maintenance.
- Protect the receiver: manage worker location, exposure time, and hearing protection under the site’s noise program after engineering controls are reviewed.
The pneumatic muffler guide covers exhaust-device construction, sizing, back pressure, and maintenance. A quieter exhaust is not an acceptable result if the cylinder slows, cushioning changes, residual pressure rises, or a safety function no longer reaches its validated state.
If the event is a pressure wave rather than steady exhaust noise, use the pneumatic air-hammer guide. A muffler does not replace transient-pressure measurement, and a slower valve command can create a different process hazard.
How Does Valve Noise Relate to Workplace Exposure?
Worker exposure depends on sound level, duration, repetition, other sources, and employee movement, not the rating of one valve. OSHA uses an 85 dBA eight-hour TWA action level for hearing conservation, while NIOSH recommends 85 dBA over eight hours with a 3 dB exchange rate (OSHA 1910.95; NIOSH).
Do not interpret those values as valve fault thresholds. An event above 85 dBA can be brief, while many repeated events and other equipment can dominate a shift dose. Conversely, a reading below 85 dBA beside one valve cannot prove that the worker’s full exposure is acceptable.
Use an exposure measurement strategy that represents real work locations and tasks. OSHA requires monitoring when information indicates exposure may reach the action level. NIOSH notes that each 3 dBA increase halves the recommended allowable exposure time. The pneumatic gripper noise guide explains this exposure boundary for a complete workstation.
Source diagnosis and exposure assessment should inform each other. The exposure survey tells you which tasks and locations matter most. The valve-level test then identifies which engineering control can reduce the dominant event without impairing machine performance.
Proportional-Valve Noise Test and RFQ Data
A defensible valve-noise comparison needs one declared measurement method and one matched operating point. ISO 11201:2010 specifies A-weighted emission levels at defined workstations or other positions, while ISO 3744:2025 determines sound power from an enveloping surface. Select the quantity before requesting a dB guarantee.
Include the following in a test request or RFQ:
- exact valve, manifold, coil, driver, and exhaust-hardware order codes;
- valve function, port size, flow characteristic, medium, and air quality;
- upstream and downstream absolute pressure plus temperature;
- steady flow or actuator bore, stroke, load, and commanded cycle;
- switching frequency, energization time, dwell, and duty cycle;
- mounting plate, enclosure, tubing, fittings, and nearby reflecting surfaces;
- requested sound quantity, weighting, detector response, and frequency data;
- microphone distance, angle, height, and background-noise method;
- number of cycles, averaging rule, uncertainty, and acceptance limit;
- permitted back pressure and performance checks after mitigation;
- fault-state and safe-state behavior during the test.
In our application reviews, the most common comparison error is accepting two dB values measured at different distances or with different exhaust hardware. Ask both suppliers for the full test condition. If either condition is missing, treat the apparent ranking as unverified.
For valve capacity work, the flow-coefficient guide explains why Cv or sonic conductance belongs to a stated pressure and flow method. Capacity data can define the operating point, but it does not predict the installed acoustic result by itself.
Pneumatic Valve Noise FAQs
There is no universal “normal” pneumatic-valve sound level. NIOSH’s 85 dBA value is an eight-hour occupational exposure recommendation with a 3 dB exchange rate, not a pass-fail number for one valve. Product comparison requires the same sound quantity, distance, operating point, mounting, exhaust hardware, and environment (NIOSH).
What is a normal noise level for a pneumatic valve?
No single range applies to every valve. Size, function, pressure ratio, flow, switching event, manifold, exhaust device, mounting, room, and microphone position all matter. Use the exact manufacturer’s stated test condition when available, then establish an installed healthy baseline under the machine’s normal operating states.
Does a louder valve mean it is failing?
Not necessarily. A louder event can result from higher pressure, changed flow, a missing muffler, different load, nearby impact, or altered sensor position. Compare synchronized command, pressure, sound, and optional vibration data with a matched healthy baseline before assigning the change to internal wear or contamination.
Can a silencer reduce noise without slowing the actuator?
It can when its exhaust-flow capacity and back-pressure behavior match the circuit. Verify both directions of actuator time, end cushioning, residual pressure, repeatability, and safe-state performance after installation. A silencer that becomes contaminated can create more restriction later, so the maintenance condition belongs in the acceptance record.
Is 85 dBA the maximum permitted valve noise?
No. OSHA’s 85 dBA value is an eight-hour TWA action level for a hearing-conservation program, and NIOSH uses 85 dBA as its eight-hour recommended exposure limit. Neither is a universal component limit. Worker dose depends on duration, repetition, other sources, and movement through the shift.
Where should the microphone be placed?
Place it according to the selected test method and mark the position from a repeatable valve or workstation datum. Record distance, angle, height, weighting, detector response, and background. For troubleshooting, use additional controlled positions to locate sources, but keep one reference channel fixed for baseline comparison.
The acoustic signature of a pneumatic valve becomes useful when it is tied to a known event, operating state, and measurement geometry. Treat sound as one diagnostic channel. Separate the source and path, compare matched baselines, confirm the suspected fault with another physical measurement, and verify every noise control against machine performance and worker exposure.
External technical references and retrieval dates
NIST, Guide to the SI, Chapter 8: Logarithmic field and power quantities, decibel notation, and the 20 µPa sound-pressure reference. Retrieved 2026-07-22.
ISO 11201:2010: Emission sound-pressure measurement at workstations and other specified positions. Retrieved 2026-07-22.
ISO 3744:2025: Engineering method for sound-power determination using an enveloping sound-pressure measurement surface. Retrieved 2026-07-22.
IEC 60534-8-3:2010: Aerodynamic noise prediction scope and boundary conditions for specified industrial process-control valves. Retrieved 2026-07-22.
ISO 6358-1: Steady-state compressible-flow characteristics and test methods for pneumatic components. Retrieved 2026-07-22.
ISO 17359:2018: General procedures for machine condition-monitoring programs. Retrieved 2026-07-22.
ISO 13373-1:2002: Measurement, transducer, operating-condition, and data-collection procedures for condition monitoring. Retrieved 2026-07-22.
OSHA, 29 CFR 1910.95: General-industry occupational noise exposure and hearing-conservation requirements. Retrieved 2026-07-22.
NIOSH, Noise and Hearing Loss: 85 dBA recommended exposure limit and 3 dB exchange rate. Retrieved 2026-07-22.
SMC, AN Series Silencer: Model-level noise-reduction and recommended-flow data under stated conditions. Retrieved 2026-07-22.
Festo, Silencer UC: Model-level sound-pressure and flow data with 6 bar and 1 m test conditions. Retrieved 2026-07-22.