

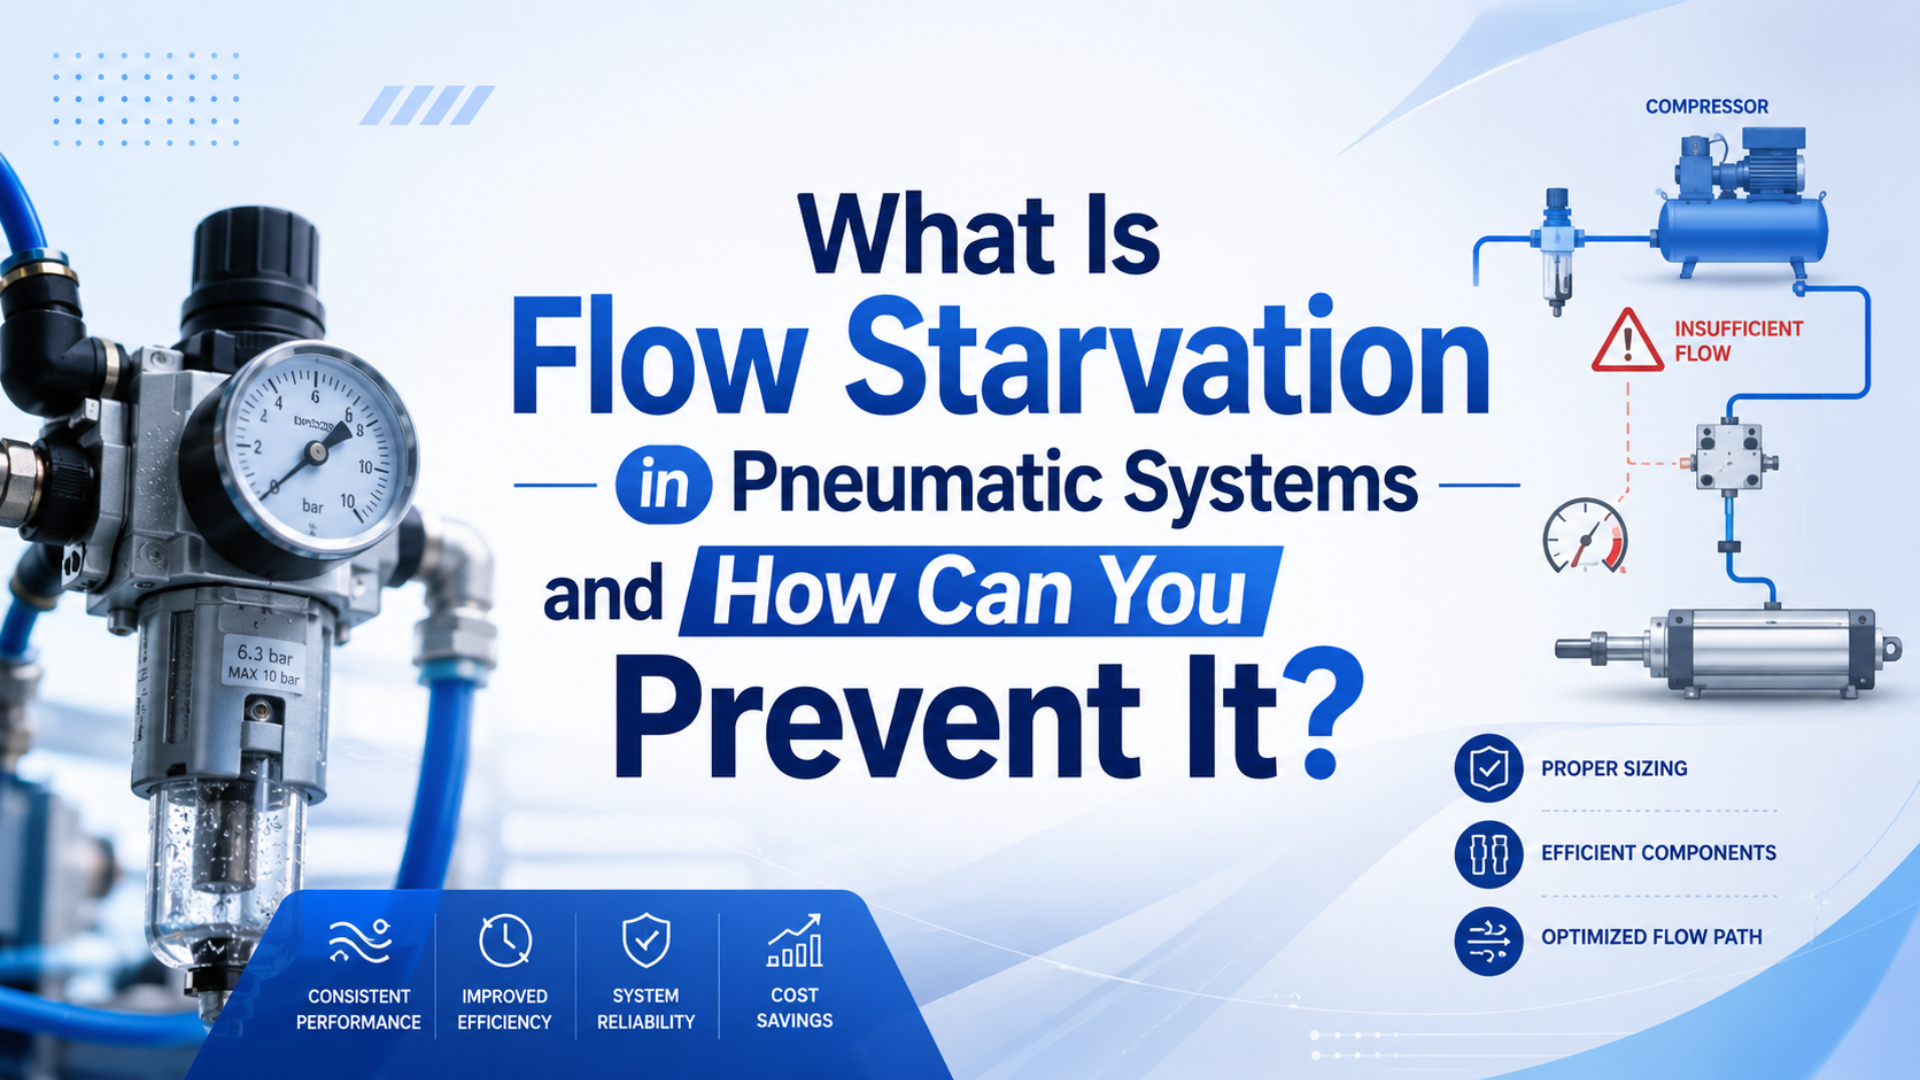
Flow starvation is the condition in which a pneumatic air path cannot deliver the required flow at a usable pressure during the actual machine cycle. A gauge may show the correct pressure while the machine is idle, then collapse when several cylinders move, a large chamber fills, or a restricted valve must pass peak flow.
The result is usually slow acceleration, inconsistent stroke time, hesitation, weak clamping during motion, or a fault that appears only during simultaneous demand. The cylinder may be healthy. The real problem can sit anywhere from compressor capacity and receiver storage to a loaded filter, undersized regulator, valve, coupling, tube, or exhaust muffler.
Key Takeaways
- CAGI says a well-designed system usually limits compressor-to-use-point pressure drop to 10 percent.
- Diagnose starvation with dynamic readings taken during the failed motion, not idle pressure.
- Compare demand, storage, distribution, local restrictions, and exhaust capacity before raising compressor pressure.
The most useful diagnostic question is not “Do we have 7 bar at the regulator?” It is “How much pressure and flow reach the actuator while the problem is happening?”
What Is Flow Starvation in a Pneumatic System?
Flow starvation is a demand-capacity mismatch: instantaneous air demand exceeds what the supply path can deliver at the required pressure. CAGI says compressed-air equipment must be sized around three defined parameters, demand in cfm, pressure in psig, and air quality, because each system has a different operating profile (CAGI, 2022).
“Flow starvation” is a practical troubleshooting description, not a single component rating. It can describe a plant header that cannot support peak production, a machine branch that loses pressure when several valves shift, or one actuator whose tube and fittings cannot fill its chamber fast enough.
The defining feature is timing. Available flow is adequate at low demand but inadequate during a specific event. That event might last several seconds, as with a large transfer cylinder, or only a fraction of a second, as when a manifold shifts multiple valves together.
SMC summarizes the actuator relationship clearly: cylinder force depends on pressure, while cylinder speed depends on airflow. For a cylinder with constant inlet pressure, SMC gives the following imperial-unit relationship (SMC, accessed 2026):
Here, is piston speed in inches per second, is airflow in SCFM, and is piston area in square inches. This is a sensitivity relationship, not a complete sizing model. Valve paths, tube dimensions, exhaust back pressure, seal friction, load, and pressure variation still affect the measured stroke.
Flow Starvation vs. Low Pressure, Pressure Drop, and Choked Flow
ISO 6358-1 defines steady-state tests for the flow characteristics of pneumatic components with fixed or variable internal passages, while ISO 6358-3 covers system calculations for subsonic and choked flow. Those standards show why “low flow” should be separated into measurable component and system behaviors (ISO 6358-1, 2013; ISO 6358-3, 2014).
These terms overlap, but they aren’t interchangeable:
| Condition | What it means | Typical field evidence |
|---|---|---|
| Low static pressure | Supply pressure is already below the requirement before motion | Idle gauge is low |
| Pressure drop | Flow through resistance produces a pressure difference | Dynamic upstream pressure stays higher than downstream pressure |
| Flow starvation | Available flow at usable pressure is below demand during an event | Pressure or cycle time deteriorates only under load or simultaneous demand |
| Choked flow | A restriction reaches its sonic mass-flow ceiling | Absolute pressure ratio and component flow data indicate a limiting throat |
| Exhaust restriction | Air cannot leave the opposite chamber fast enough | Back pressure rises and one direction may be slower |
A starved machine may contain several pressure drops, but a pressure drop alone doesn’t prove the entire supply is undersized. Likewise, a local restriction can starve one actuator even when the compressor has reserve capacity. Read the broader pressure-drop troubleshooting guide separately from the choked-flow guide.
A clean diagnosis identifies the boundary of the problem. If the plant header remains stable while pressure falls across the machine FRL, the compressor isn’t the first suspect. If every branch falls together, a local cylinder fitting isn’t the first suspect.
Why Can Static Pressure Look Normal While the Cylinder Is Slow?
CAGI recommends no more than 10% total pressure drop between compressor discharge and any point of use in a well-designed system. That benchmark applies while air is flowing; an idle gauge can show full pressure because almost no flow exists to create losses across filters, valves, fittings, or tubing (CAGI, 2022).
Imagine a regulator set to 6 bar gauge. With the machine stopped, both sides may settle near 6 bar. During a fast extension, the downstream side can fall sharply if the regulator, valve, coupling, or tube can’t pass the required flow. When motion ends, the pressure recovers and hides the event.
Dynamic pressure is the pressure recorded while air is flowing during the operating event under investigation. It should be time-aligned with cylinder motion, valve commands, and other large air users. Static pressure is useful for setup, but dynamic pressure reveals whether the installed path holds the required condition under demand.
That recovery pattern is a strong clue. So are these operating symptoms:
- One cylinder slows only when another station cycles.
- Extension is slow but retraction is normal, or the reverse.
- The first cycle after a long pause is acceptable, then later cycles slow down.
- Pressure recovers during dwell but falls during chamber filling.
- A filter, regulator, valve, coupling, or muffler shows a large dynamic differential.
- Increasing a flow-control opening produces little additional speed.
Don’t diagnose from noise alone. A leak can add continuous demand, while a restricted exhaust can sound loud and still limit motion. A valve that doesn’t shift fully can also imitate a flow restriction. Confirm the air path with measurements before replacing the actuator.
A Dynamic Test Sequence for Locating the Starved Section
CAGI recommends adding pressure-monitoring taps and keeping main piping velocity at 20 ft/s or lower to reduce turbulence and pressure loss. The practical extension is a segmented test: record synchronized pressure on both sides of one suspected section while the machine repeats the exact failed cycle (CAGI, 2022).
Start with a stable baseline. Record the product, load, cylinder direction, regulator setting, flow-control setting, cycle time, actuators moving simultaneously, and the compressor operating state. Without this context, two pressure readings from different cycles aren’t comparable.
Then work downstream:
- Measure receiver or main-header pressure during the failed event.
- Measure the machine inlet at the same moment.
- Compare pressure before and after the FRL assembly.
- Compare the valve supply port with its working port during motion.
- Measure as close as practical to the actuator port.
- Check exhaust back pressure on the opposite chamber and muffler path.
- Repeat the test with other major air users isolated only when the process allows it safely.
For any component or pipe section, use the dynamic differential:
is the measured pressure loss across the suspect section during the same time window. and must use the same pressure basis and synchronized instruments. Compare the result with manufacturer flow curves or validated line-loss calculations, not a universal pass/fail number.
Where Do Pneumatic Flow Bottlenecks Usually Occur?
ISO 6358-3 models the combined steady-state flow characteristics of components and piping, including subsonic and choked regimes. The engineering lesson is direct: the installed air route behaves as a system, so a large valve cannot compensate for a small coupling, loaded filter, narrow fitting bore, or restricted muffler elsewhere (ISO, 2014).
Inspect bottlenecks in the order indicated by the dynamic test, not by component price or appearance:
| Location | Why it can starve flow | Evidence to collect | Better corrective action |
|---|---|---|---|
| Compressor and controls | Available capacity doesn’t follow peak demand | header pressure, compressor status, demand profile | review sequencing, capacity, and control strategy |
| Receiver and distribution | Storage or pipe network cannot support a short event | synchronized header and branch pressure | calculate storage, resize or loop piping, reduce unnecessary length |
| Filter and dryer | Contamination loading increases differential pressure | differential indicator or two-gauge test | service by measured differential and supplier instructions |
| Regulator | Outlet pressure droops as flow rises | inlet/outlet pressure and manufacturer flow curve | select the correct operating range, not just port thread |
| Valve and manifold | Internal paths or shared galleries limit simultaneous flow | supply and working-port pressure by direction | compare Cv, Kv, ISO 6358 data, and manifold capacity |
| Couplings and fittings | Internal bore is smaller than tube ID | actual bore and pressure on both sides | use full-flow components with verified data |
| Tube or hose | Small ID and long runs increase dynamic loss | ID, length, fittings, flow, inlet pressure | shorten the run or resize from a pressure-drop calculation |
| Exhaust path | Meter-out control or muffler creates back pressure | cylinder-port back pressure by direction | clean, resize, or correctly adjust the exhaust path |
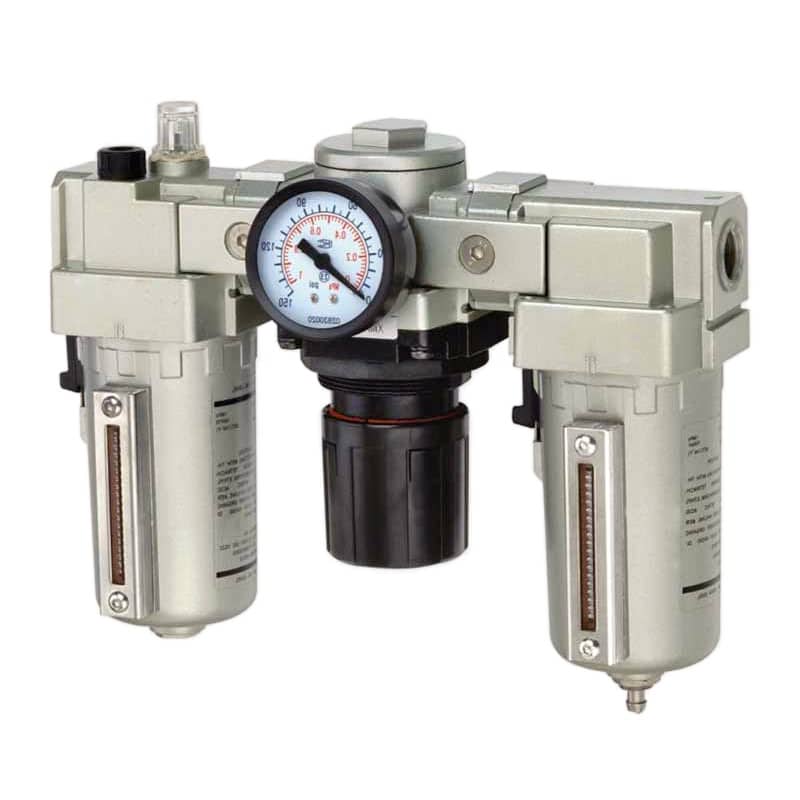
An FRL should be selected for air quality and flow performance together. CAGI recommends changing filter elements when differential pressure exceeds 5 to 7 psig or at least every six months in its pressure-drop brief. Always reconcile that guidance with the element manufacturer’s differential limit, contamination load, safety requirements, and maintenance instructions.
Port thread is only a connection size. For valves, compare the required cylinder flow with the manufacturer’s Cv, Kv, or ISO 6358 data. The companion guide on flow coefficient Cv and pneumatic valve sizing explains why two valves with the same thread can have different flow capacity.
How Do You Size the System to Prevent Peak-Demand Starvation?
CAGI’s sizing brief says the existing demand profile should identify maximum, average, and minimum demand before capacity is added. A fixed 25% reserve is not a universal engineering rule; the required margin depends on measured peaks, simultaneity, expansion plans, compressor controls, storage, and the minimum acceptable point-of-use pressure (CAGI, 2022).
Build the sizing review from the load outward:
- Define the actuator bore or effective area, stroke, target time, working pressure, and cycles per minute.
- Establish which actuators can demand air simultaneously rather than summing every nameplate load without context.
- Check both chamber filling and exhaust paths for the required direction.
- Compare valves and regulators at the expected inlet pressure and allowable outlet droop.
- Size tubing from actual inside diameter, length, fittings, target flow, and acceptable pressure loss.
- Confirm the machine branch, header, treatment equipment, receiver, and compressor controls support the same peak event.
For actuator-side demand, the Cylinder Flow Requirement Calculator can estimate the required flow from bore, stroke, pressure, and target stroke time. Use that result as an input to valve and tube checks, not as proof that the upstream plant system can deliver it.
Air receivers help when the demand peak is short and recovery time is available. The DOE sourcebook says receivers provide storage for peak demand and control the rate of system pressure change; intermittent peaks may allow a smaller compressor when storage and controls are correctly designed (U.S. Department of Energy, 2003).
Storage isn’t a cure for a permanent bottleneck. A receiver placed upstream of an undersized coupling may hold more air while the coupling still limits delivery. Likewise, local storage without suitable check valves, pressure control, relief protection, drainage, and recovery analysis can create new operating problems.
Treat every proposed fix as a hypothesis. If a larger receiver is the answer, the recorded pressure trace should show a short demand event followed by enough recovery time. If a larger tube is the answer, the largest dynamic differential should occur across that tube and its fittings.
Prevention and Commissioning Checklist
CAGI recommends limiting distribution-pipe air velocity to 20 ft/s or lower and evaluating receiver storage at intermittent high-demand points. These are screening practices, not substitutes for commissioning data. A reliable system records pressure, flow, and cycle behavior before production changes make the original design assumptions obsolete (CAGI, 2022).
Use this checklist during design changes, commissioning, and recurring condition reviews:
- Document minimum point-of-use pressure and target cycle time for each critical motion.
- Record normal and worst-case simultaneous air users.
- Measure tube ID and fitting bore instead of relying on tube OD or thread size.
- Check regulator flow curves at the required set pressure and demand.
- Compare valve supply and exhaust capacities for both motion directions.
- Install pressure taps before and after components that may require differential checks.
- Trend cycle time and dynamic pressure under a repeatable machine state.
- Service filters from differential pressure and manufacturer limits.
- Repair leaks because they consume base capacity and reduce peak-demand margin.
- Recheck the demand profile after new machines, faster cycles, larger cylinders, or extra blow-off devices are added.
What if the pressure trace looks healthy but the cylinder remains slow? Move to the non-supply causes: incorrect meter-in or meter-out flow control, excessive mechanical side load, seal friction, poor alignment, insufficient force margin, cushioning set too aggressively, or a directional valve that isn’t shifting fully.
The finish line is repeatability. A correction is verified only when the machine meets its required cycle across the intended operating range without hiding the restriction behind excessive compressor pressure.
FAQs About Flow Starvation: What Should Engineers Check?
CAGI uses three core sizing inputs, cfm, psig, and air quality, and recommends no more than 10 percent compressor-to-use-point pressure drop in a well-designed system. The answers below apply those system-level principles to the most common flow-starvation questions without treating one percentage or maintenance interval as universal (CAGI, 2026).
What is the first measurement to take when flow starvation is suspected?
Record dynamic pressure at the machine inlet and near the affected actuator during the failed motion. If possible, synchronize both readings with cycle time and other valve events. An idle gauge isn’t enough because pressure can recover as soon as flow stops, hiding the restriction that occurred during chamber filling.
Can the compressor be large enough while one cylinder is still starved?
Yes. A stable plant header does not guarantee adequate flow through the machine branch. A loaded filter, drooping regulator, small valve path, restrictive coupling, undersized tube, or clogged muffler can isolate the problem to one actuator. Measure across successive sections until the largest abnormal dynamic differential appears.
Does a pressure drop above 15 percent prove flow starvation?
No universal 15 percent threshold proves flow starvation. CAGI’s 10 percent figure is a system-level design benchmark from compressor discharge to point of use. Component acceptance should instead use the machine’s minimum pressure, required flow, supplier performance data, synchronized measurements, and the operating event that produces the symptom.
When will a local air receiver help?
A local receiver can help with short, intermittent demand when stored air supports the event and the supply has enough time to recover. It won’t correct a continuously undersized compressor or a downstream bottleneck. Size storage from demand, event duration, allowable pressure decay, recovery time, and required protective hardware.
Can dirty air create flow starvation symptoms?
Yes. Contaminants can load filter elements, obstruct small valve orifices, damage sealing surfaces, and increase pressure loss. Confirm the problem with differential pressure or component inspection. Then correct both the restriction and its contamination source, using the required air-quality class and the component manufacturer’s maintenance limits.
Sources and technical references
- CAGI Technical Brief on Pressure Drop, 2022.
- CAGI Technical Brief on Sizing Compressed Air Equipment, 2022.
- U.S. Department of Energy, Improving Compressed Air System Performance, sourcebook.
- ISO 6358-1, steady-state component flow-rate characteristics, confirmed current with 2026 amendment information.
- ISO 6358-3, system flow-rate characteristics, confirmed current.
- SMC, Control Air Flow of Cylinders, accessed 2026.