

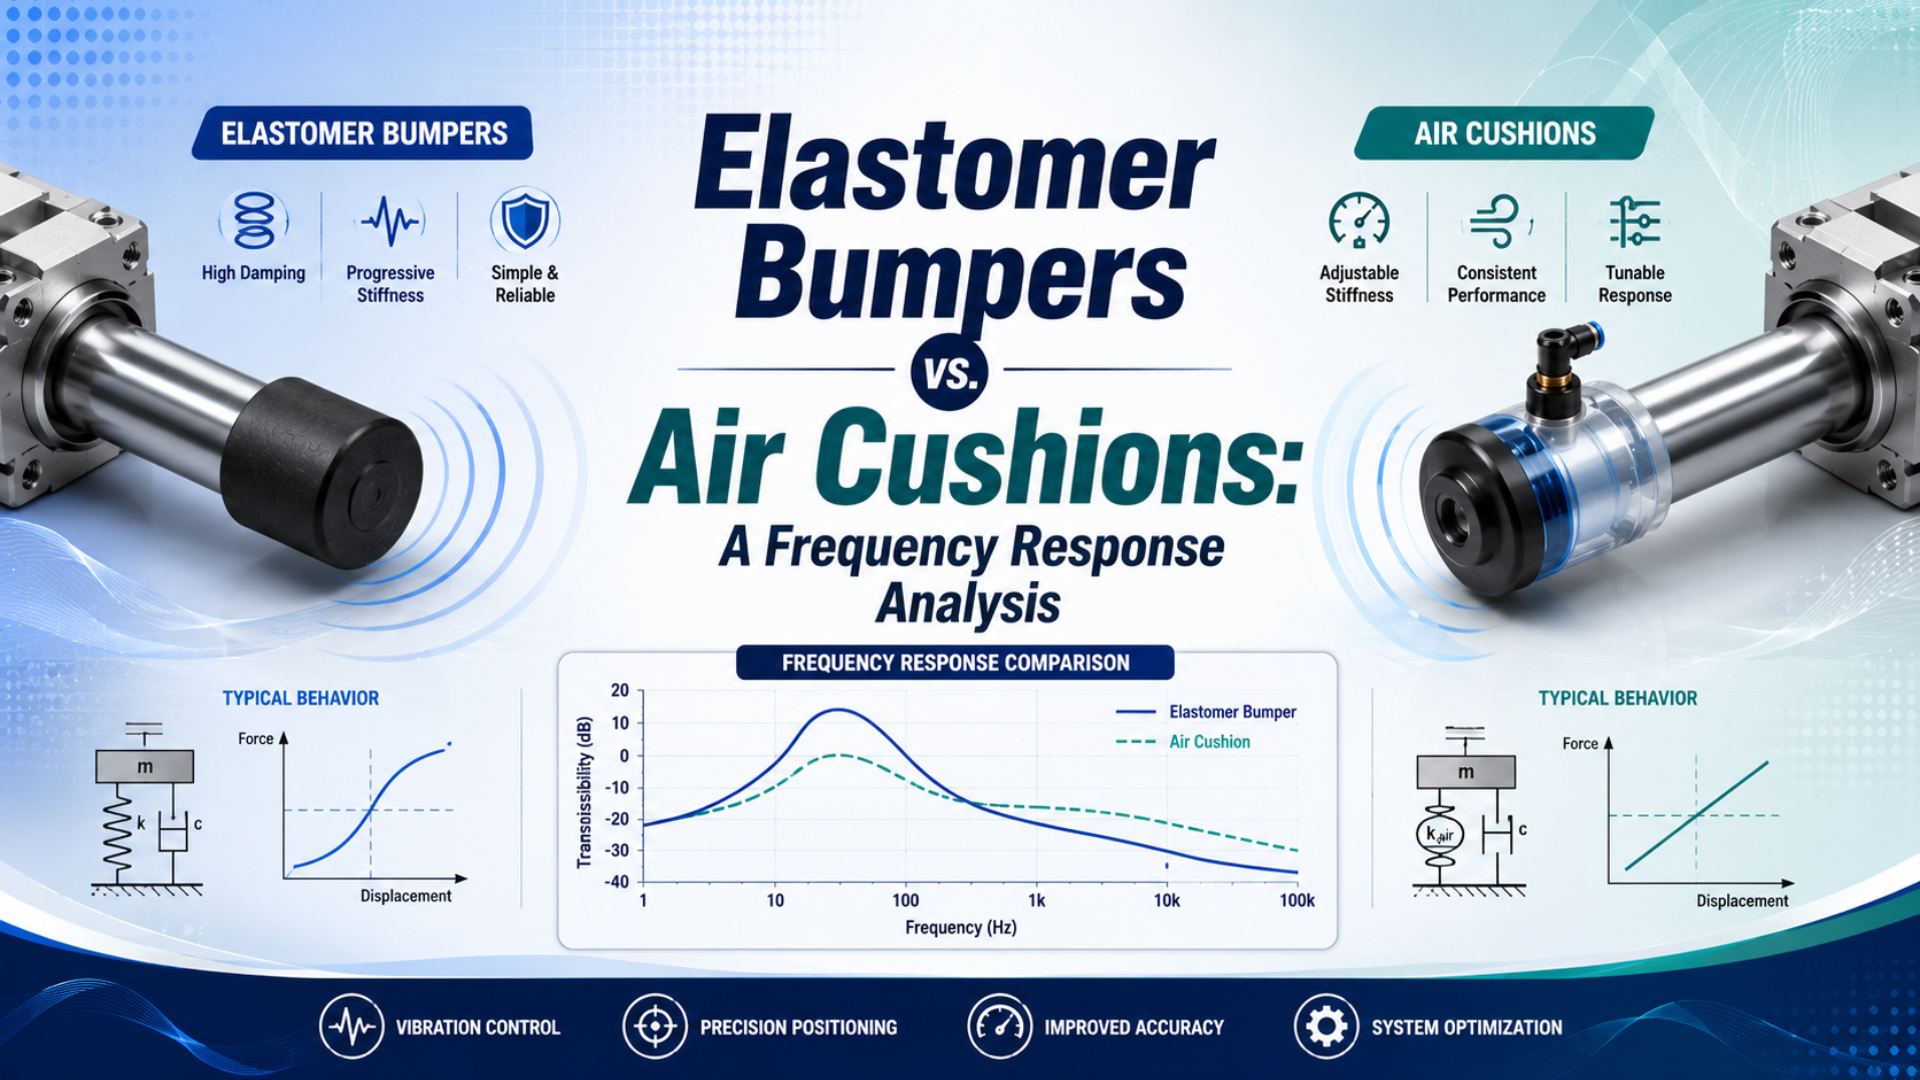
Elastomer bumpers vs. air cushions cannot be selected from cycles per minute alone. Compare them with the same moving mass and cushion-entry speed, then measure peak force, rebound, settling time, and temperature over the real duty cycle. Finally, check the exact cylinder or bumper against its manufacturer limits.
An elastomer bumper is compact and passive. It suits impacts that remain inside its allowable energy, compression, temperature, and repetition limits. An adjustable air cushion gives the engineer another control variable, exhaust restriction, and normally handles more end-of-stroke energy in a compatible cylinder. Neither option has a universal frequency crossover.
Key Takeaways
- Cycle rate converts energy per impact into sustained thermal load, but it does not define peak stopping force.
- Record force or acceleration, velocity, rebound, settling time, and temperature under the same production conditions.
- Select from model-specific energy and speed limits, then verify the installed machine at its worst credible operating point.
What Does Frequency Response Mean in This Comparison?
ASTM D5992 describes elastomer dynamic testing over approximately 0.01 to 100 Hz and treats free-resonant, forced-resonant, and forced nonresonant methods separately. That range shows why a true frequency-response test needs a defined waveform, strain, temperature, specimen geometry, and measurement method, not only a machine’s cycles-per-minute value (ASTM D5992, 2024).
In vibration engineering, frequency response describes how a system’s output amplitude and phase change with excitation frequency. A pneumatic cylinder hitting its end cap is usually a transient event. The useful first record is therefore a time-domain trace of force, acceleration, pressure, displacement, or velocity during one stop.
Cushion-entry speed is the load velocity when the cylinder’s cushioning process begins. It can differ from average stroke speed because acceleration, flow restriction, and load force change velocity throughout the stroke.
Machine cycle rate answers a different question: how often is that transient repeated? If one end of a cylinder receives 60 impacts per minute, that end sees one impact per second. This repetition rate affects heat accumulation and recovery time, but two machines at 60 cycles per minute can impose very different loads if their moving masses or entry speeds differ.
Keep these three quantities separate:
| Quantity | What it describes | Suitable evidence |
|---|---|---|
| Cushion-entry event | One end-of-stroke stop | Force, acceleration, pressure, velocity, and displacement versus time |
| Event repetition rate | How often that stop repeats | Impacts per minute or per hour, dwell time, and duty schedule |
| Dynamic material response | Stiffness and damping under controlled excitation | Defined temperature, frequency, strain, preload, and specimen geometry |
ISO 4664-1:2022 covers both free- and forced-vibration methods for elastomer materials and products. It does not treat every repeated impact as an interchangeable frequency-response test (ISO 4664-1, 2022). That distinction prevents a clean-looking CPM chart from becoming false precision.
The practical comparison uses two linked views: a time-domain stop trace for peak and rebound behavior, plus a thermal trend across many repeated stops. A frequency spectrum can help diagnose structural ringing after impact, but it does not replace the event-energy calculation or the manufacturer’s cushion envelope.
How Do Elastomer Bumpers and Air Cushions Stop the Same Load?
SMC’s cylinder-selection guide lists separate allowable kinetic-energy values for rubber bumpers and air cushions by cylinder series and bore. In one listed 16 mm example, the values are 0.090 J and 0.18 J respectively, a model-specific comparison rather than a universal performance ratio (SMC, retrieved 2026).
An elastomer bumper compresses when the piston or carriage reaches it. Part of the input energy is returned as the material recovers, while another part is dissipated through viscoelastic loss and internal heating. The force curve depends on material formulation, hardness, bumper shape, compression ratio, strain rate, preload, temperature, and aging.
An adjustable air cushion traps air near the end of stroke and meters its exhaust through a restricted passage. SMC describes the cushion valve as the element that regulates exhaust from the trapped air volume (SMC FAQ, retrieved 2026). The resulting back pressure decelerates the piston before mechanical contact.
The air cushion is not simply a soft spring. Cylinder thrust may continue driving the load while trapped pressure rises, and the exhaust path controls how quickly pressure can decay. A needle that is too open can leave a hard final impact. A needle that is too closed can cause an early pressure spike, rebound, or a slow crawl through the last part of the stroke.
| Comparison point | Elastomer bumper | Adjustable air cushion |
|---|---|---|
| Primary mechanism | Viscoelastic compression | Trapped-air pressure and restricted exhaust |
| Adjustment | Normally fixed by material and geometry | Needle or model-specific self-adjusting mechanism |
| Main application inputs | Impact energy, compression, temperature, repetition, environment | Moving mass, entry speed, pressure, cushion length, exhaust setting |
| Typical failure evidence | Permanent set, cracking, softening, hardening, heat buildup | Hard impact, rebound, pressure spike, slow final travel, unstable setting |
| Selection authority | Exact bumper data and test condition | Exact cylinder cushion chart and instructions |
Festo divides cylinder end cushioning into three broad methods: elastic, pneumatic or servo-pneumatic, and hydraulic. Its guidance positions elastic cushioning for relatively low load and speed, while adjustable pneumatic cushioning depends on moving mass, speed, deceleration, working pressure, and cylinder resistance (Festo, 2022).
Which Measurements Reveal the Better End-of-Stroke Response?
Parker recommends cushioning for applications above 0.1 m/s when the piston completes a full stroke, but it still directs engineers to calculate each cylinder-and-load combination. The threshold is application guidance, not proof that one cushion is acceptable at every mass, pressure, or stroke (Parker 2A Catalogue, retrieved 2026).
The better response is the one that keeps the installed machine inside its allowable force, energy, temperature, position, and cycle-time limits. A quiet stop can still overload a bracket. A fast stop can still rebound away from a sensor. Record more than sound.
Settling time is the interval from cushion entry until the load remains inside its accepted end-position band. Define that band before testing so two cushion arrangements can be compared against the same production requirement.
Use five primary response signals:
- Peak force or acceleration: shows the most severe part of the stop and exposes a short, hard impact.
- Deceleration duration: shows whether the energy is spread over usable travel or concentrated near one endpoint.
- Rebound velocity or displacement: reveals stored energy returning to the moving assembly.
- Settling time: measures how long the load takes to remain inside its accepted end-position band.
- Temperature trend: shows whether repeated loss energy is accumulating faster than the assembly can reject heat.
Pressure at the cylinder port is a valuable sixth channel for an air cushion. Record it close to the cylinder because a long tube, restricted fitting, valve exhaust path, or clogged silencer can change the pressure trace. The broader high-speed air-cushion guide explains how exhaust restriction and needle adjustment affect the final part of the stroke.
Do not declare a winner from the lowest peak alone. A lower peak with excessive settling time can miss cycle-time requirements, while a fast response with acceptable peak load may be the better machine result. The acceptance window must combine structural load, sensor stability, noise, cycle time, and component limits.
Cycle Rate and Thermal Accumulation
ISO 4666-1:2010 covers temperature-rise and fatigue testing of dynamically flexed rubber, yet explicitly says no simple correlation should be assumed between accelerated tests and service performance. That warning rules out converting one laboratory temperature or cycle count into a universal bumper-life claim (ISO 4666-1, confirmed 2024).
Elastomer hysteresis converts part of each deformation event into heat. At a low repetition rate, the bumper may cool substantially between impacts. As the interval shortens, its average temperature may rise until heat generation and heat rejection approach equilibrium. The equilibrium depends on bumper volume, surface area, mounting conduction, airflow, nearby heat sources, and material properties.
For a first screening model, average heat input is:
Here, is average loss power in watts, is energy converted to heat per impact in joules, and is impacts per second at the bumper being evaluated. Use a measured or manufacturer-supported loss value. Do not assign a generic percentage to every polyurethane or rubber compound.
A lumped thermal model can organize a test without pretending to predict the exact temperature:
In this model, is effective thermal capacitance, is effective thermal resistance, is bumper temperature, and is local ambient temperature. Both thermal parameters include the installed geometry and normally must be measured or fitted. The equation is a test-planning model, not a catalogue rating.
Air cushioning moves much of the dissipation into throttled exhaust and repeated compression of the trapped gas, but that does not make it thermally unlimited. Cylinder seals, lubricant, barrel, end cap, compressed air, and exhaust hardware still operate within temperature and duty limits. A restricted silencer can also change cushion pressure and settling behavior as the machine runs.
What should trigger concern? Watch for a temperature trend that has not stabilized, increasing rebound, permanent bumper set, cracks, surface softening, hardening, cushion-setting drift, slower final travel, or a rising pressure spike. Compare cold-start and thermally stabilized traces under the same load and pressure.
How Should You Calculate Impact and Repeated-Event Load?
Parker warns that cushion-entry speed can be about 50% higher than average stroke speed, and that higher value determines cylinder choice. Because kinetic energy varies with velocity squared, substituting average speed can materially understate the stopping requirement (Parker-Origa, retrieved 2026).
Start with moving kinetic energy at the point where cushioning begins:
Here, is kinetic energy in joules, is total moving mass in kilograms, and is measured or defensibly estimated cushion-entry speed in metres per second. Include the piston, rod or carriage, tooling, brackets, gripper, product, and other translating parts.
If cylinder thrust, gravity, a spring, or a process force continues pushing during the stopping distance, include that work:
Here, is the net propelling force that remains active, is usable stopping distance, and is signed gravity work where orientation makes it relevant. Use effective pressure at the cylinder during motion, not merely regulator set pressure, when estimating pneumatic drive force.
Then calculate repeated-event throughput:
Repeated-event energy throughput means the calculated event energy multiplied by the number of impacts reaching the evaluated end during a stated interval. It is a screening quantity for sustained duty, not a substitute for a published component rating.
is the number of impacts that reach the evaluated end in one hour. A full extend-retract cycle normally produces one event at each end, not two events at the same bumper. Confirm the real sequence, including setup strokes, retries, and fault recovery.
Consider an illustrative horizontal axis with 12 kg of moving mass, an entry speed of 0.60 m/s, 180 N of continuing drive force, and 20 mm of usable stopping distance. The kinetic component is 2.16 J, the drive work is 3.60 J, and the preliminary event total is 5.76 J before applying model-specific allowances.
If that end receives 40 impacts per minute during continuous production, it sees 2,400 impacts per hour. The energy throughput is then 13.8 kJ/h. That result is not a bumper or cushion approval. It is the application value to compare with the exact product’s energy, velocity, compression, temperature, duty, and installation limits.
For an external absorber, effective mass, return time, impact angle, positive-stop requirements, and energy per hour also matter. Use the separate external shock absorber sizing guide when the built-in cushion envelope is exceeded.
When Should You Use a Bumper, Air Cushion, or Hybrid Layout?
Festo identifies three end-cushioning families, elastic, pneumatic or servo-pneumatic, and hydraulic, because no single mechanism covers every load and speed. Its elastic option is intended for lower-energy service, while pneumatic cushioning adds adjustable or self-adjusting deceleration within the actuator’s stated range (Festo, 2022).
Choose an elastomer bumper when the exact part is rated for the calculated energy and compression, its rebound is acceptable, the temperature stabilizes inside its published range, and passive maintenance-free operation is valuable. It can be a sound solution for modest, consistent impacts. “Simple” does not mean “unrated.”
Choose an adjustable air cushion when the cylinder provides a suitable cushion envelope, the load and entry speed fit its chart, and commissioning access is available. Air cushioning is especially useful when the deceleration profile must be tuned without changing a mechanical bumper. The pneumatic cylinder cushioning guide covers the internal sequence in more detail.
A hybrid arrangement can use the air cushion for routine deceleration and an elastomer element for residual contact, noise control, or secondary protection. Some commercial cylinders deliberately combine both. The bumper must still have a defined compression and energy role, and the air cushion must still be adjusted within its instructions. One device must not hide an undersized or damaged other device.
| Application evidence | Preferred next check |
|---|---|
| Low calculated energy, stable payload, acceptable rebound | Screen an exact elastomer bumper or rubber-cushioned cylinder |
| Need to tune end-of-stroke deceleration | Screen an adjustable or self-adjusting air cushion |
| Built-in cushion chart is exceeded | Reduce speed or add a correctly sized external shock absorber |
| Payload changes produce inconsistent stopping | Review self-adjusting cushioning or controlled motion, then validate extremes |
| Hard impact remains after needle adjustment | Recheck entry speed, mass, exhaust restriction, pressure, and cushion capacity |
| Long overhung load or high moment | Fix load guidance and stop location before changing the cushion |
Treat the bumper and air cushion as parts of the load path, not accessories selected after the cylinder. If the external structure flexes, the same energy may appear as bracket strain, guide moment, or sensor movement even when the end cap sounds quiet. Cushion selection and mounting review belong in the same calculation package.
Machine Validation Under Production Conditions
SMC’s RLQ air-cushion instructions plot allowable operation against load mass and maximum speed from 100 to 500 mm/s, then require the cushion needle to be readjusted for the installed load and speed. Validation therefore begins with the exact product envelope and ends with controlled machine testing (SMC RLQ, retrieved 2026).
Use the worst credible operating case, not only the normal recipe. That means maximum payload, highest permitted speed and pressure, lowest and highest ambient temperature, realistic air-line restrictions, and the longest sustained production interval. If different products create different masses, validate both light and heavy extremes because rebound and peak pressure may move in opposite directions.
In our experience, the most reusable commissioning record is a one-page sheet containing model number, moving mass, cushion-entry speed, working pressure, cycle rate, cushion setting, stabilized temperature, and the accepted peak and settling limits. It lets maintenance teams distinguish adjustment drift from a changed load or air path.
Run the test in controlled steps:
- Verify guarding, stop integrity, fastener torque, load guidance, sensor clearance, and emergency controls.
- Begin below production speed with the real payload installed.
- Record cushion-entry speed rather than relying only on full-stroke average speed.
- Increase speed or adjust the cushion in small increments using the exact manufacturer’s procedure.
- Compare peak response, rebound, settling time, noise, and end-position stability.
- Continue long enough to observe a stable temperature trend or reach the approved test limit.
- Inspect the bumper, seals, end cap, mount, guide, fasteners, and exhaust hardware.
- Save the model number, load, pressure, speed, cycle rate, setting, temperature, and acceptance limits.
Revalidate whenever tooling mass, speed, pressure, valve, tubing, silencer, mounting, bumper material, or cylinder model changes. For motion problems before cushion entry, check the cylinder speed calculation method and the effect of back pressure in pneumatic systems.
Elastomer Bumper and Air Cushion FAQs
Festo identifies 5 application variables for adjustable air cushioning: mass, speed, required deceleration, working pressure, and cylinder resistance. Those variables explain why the following answers avoid universal CPM limits and instead connect each decision to a measured impact case and an exact component envelope (Festo, 2022).
Is there a universal cycle-rate limit for an elastomer bumper?
No. Cycle rate changes the average thermal load, but acceptable operation also depends on impact energy, material, geometry, compression, mounting conduction, airflow, ambient temperature, and recovery time. Use the exact bumper’s published limits, then confirm that temperature and response stabilize during the worst sustained production run.
How can I tell whether an elastomer bumper is overheating?
Record surface or embedded temperature at a repeatable location while also tracking rebound, settling time, compression set, cracks, softening, and hardening. A temperature number without the material limit is incomplete. Stop the test if the component or surrounding hardware approaches its published limit or its response continues to drift.
Does an air cushion replace a mechanical end stop?
Not automatically. An air cushion decelerates the piston within its rated envelope, but the machine may still require a positive structural stop or a defined residual-contact element. Follow the exact cylinder drawing and safety design. Do not assume the cushion needle, cushion seal, or end cap can carry an unspecified external stop load.
Can an elastomer bumper and air cushion be used together?
Yes, when the cylinder design or machine layout assigns each element a defined role. The air cushion can handle routine deceleration while the elastomer manages residual contact or secondary protection. Validate combined behavior because early bumper contact can shorten pneumatic cushioning distance, increase force, and invalidate the original cushion calculation.
What data should be included in a cushioning RFQ?
Provide cylinder model and bore, stroke, orientation, moving mass, tooling centre of gravity, measured cushion-entry speed, working pressure during motion, valve and tube details, events per minute and hour, ambient range, required stopping distance, allowable rebound, cycle-time limit, environment, mounting drawing, and the acceptance measurements the machine must pass.
Sources and technical references
- ASTM D5992-96(2024), Standard Guide for Dynamic Testing of Vulcanized Rubber and Rubber-Like Materials, accessed July 23, 2026.
- ISO 4664-1:2022, Determination of Dynamic Properties of Rubber, accessed July 23, 2026.
- ISO 4666-1:2010, Temperature Rise and Fatigue in Flexometer Testing, confirmed 2024 and accessed July 23, 2026.
- Festo, Cylinder Cushioning: The Three Most Common Methods, July 7, 2022.
- SMC, Air Cylinder Selection Technical Data, accessed July 23, 2026.
- SMC, Function of the Cushion Valve on Air Cylinders, accessed July 23, 2026.
- SMC, RLQ Series Compact Cylinder with Air Cushion and Lock, accessed July 23, 2026.
- Parker, Basic Cylinder Application Engineering Data, accessed July 23, 2026.
- Parker, 2A Pneumatic Cylinder Catalogue, accessed July 23, 2026.