

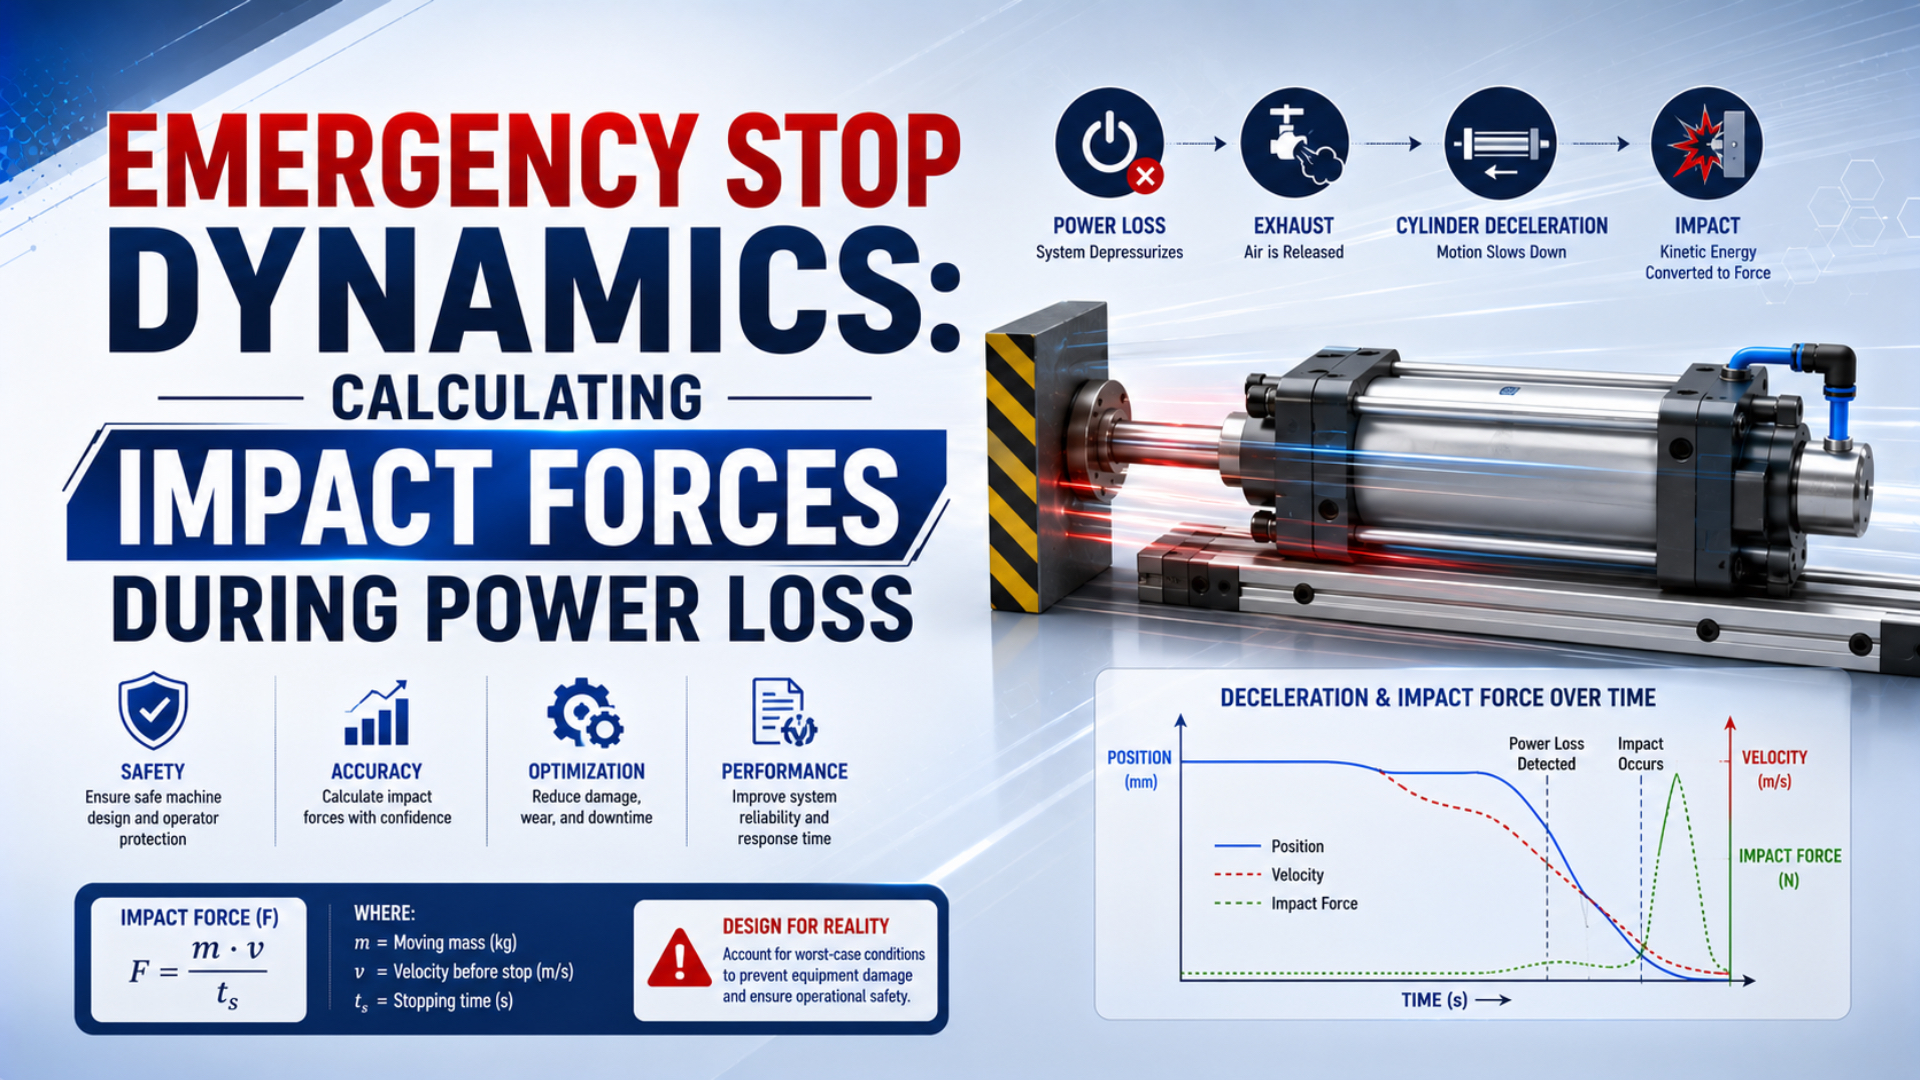
A pneumatic cylinder does not enter one predictable state when power disappears. ISO 13850:2015 defines the emergency-stop function independently of energy type, while ISO 13849-1:2023 applies to complete safety-related control functions. Calculate the energy that remains in the moving axis, then verify the installed stop instead of treating valve de-energization as proof of safety (ISO 13850, 2015; ISO 13849-1, 2023).
That distinction matters because electrical power loss, compressed-air loss, and an emergency-stop demand are different events. Several outcomes are possible. Depending on the circuit, the cylinder may coast, continue under trapped pressure, exhaust, reverse, or move under gravity. Its response depends on the exact valve symbol, spring position, pilot supply, load orientation, exhaust path, and mechanical holding devices.
Emergency stop impact force during power loss is the transient reaction created while the remaining kinetic, pneumatic, gravitational, or spring energy is removed. Preliminary calculations can screen the energy and average force. Only the installed force-time response determines the peak.
That is the calculation boundary.
Key Takeaways
- ISO 13850:2015 treats emergency stop as a defined machine function, not a synonym for power loss.
- Energy divided by stopping distance gives an average force, not the peak transmitted through the machine.
- Validate the worst credible mass, speed, pressure, valve state, gravity load, stopping distance, and restart behavior.
What Does Power Loss Actually Mean for a Pneumatic Axis?
Festo distinguishes at least 6 relevant pneumatic responses, including safe stop 1, safe stop 2, safe stopping and closing, safe stopping and blocking, safe torque off, and safe operating stop. Their differences show why “remove power” is not a complete cylinder-state specification (Festo Safe Pneumatics, retrieved 2026-07-23).
Start by naming the initiating event. Electrical control loss may de-energize solenoids while plant air remains available. Supply-line failure removes upstream pressure but leaves compressed air in downstream volumes. By contrast, an emergency-stop demand is a deliberate safety input whose required machine response must already be defined. Component faults create another case again.
| Initiating event | What may change immediately | Energy that may remain | Question to verify |
|---|---|---|---|
| Electrical control power loss | Solenoids return, detent, or remain in their last mechanical state | Supply pressure, trapped chamber air, moving-load energy, gravity | Which ports connect in the de-energized position? |
| Compressed-air supply loss | Inlet pressure decays according to system volume and leakage | Chamber pressure, accumulator energy, moving-load energy, gravity | Does the pilot stage still shift, and where can trapped air escape? |
| Emergency-stop demand | Safety logic commands a defined response | Depends on the designed safety function | Must the axis exhaust, hold, decelerate, or combine those actions? |
| Valve, hose, or sensor fault | One channel or flow path may behave differently from the command | Pressure can persist on one side of the actuator | Which single faults can defeat the required response? |
Event naming comes first.
Five-port, two-position valves have 5 ports and 2 defined positions. There is no center. Adding a third position creates a 5/3 arrangement, but “closed center” still describes only the schematic connections. It does not prove that a vertical load will hold, that leakage is acceptable, or that a dangerous restart is prevented. Use the exact model drawing and safety data, not the family name. See the 3/2 versus 5/2 valve comparison for the basic symbol context.
Valve position is evidence, not the verdict.
Consider what can happen around one nominally closed center position. The spool may reach center only while pilot pressure is available, an upstream check may preserve that pilot supply, and a downstream check may trap different pressures in the two cylinder chambers. External load then compresses one chamber while the other leaks or expands. Position can drift even though the symbol shows no open path. On another machine, blocking motion could preserve a hazardous clamping force that must be released before access. Neither outcome can be classified from the center symbol alone. The analysis needs the complete circuit, the manufacturer’s leakage and switching data, the load direction, the permitted movement, the required pressure state, and an installed test that covers the relevant fault.
The most useful boundary is not “power on” versus “power off.” It is energy controlled versus energy capable of hazardous motion. Electrical death is not energy isolation. Compressed air and gravity can still move the axis, while pressure can remain safely only when a validated holding function prevents hazardous displacement.
Power-Loss Stop Energy Calculation
ACE lists 5 basic application inputs for most industrial shock-absorber calculations: mass, impact velocity, additional drive force, events per hour, and the number of parallel absorbers. It then checks single-event energy separately from hourly energy and effective mass (ACE Controls, retrieved 2026-07-23).
Energy is the sizing currency.
Begin with the translational kinetic energy of every component moving with the axis:
Here, is kinetic energy in joules, is total moving mass in kilograms, and is velocity immediately before the stopping action in metres per second. Include the piston or carriage, tooling, brackets, carried product, and any mechanism whose motion is reflected into the cylinder axis.
If pneumatic thrust, a spring, a process force, or another drive continues acting through the stopping distance, include its work. For a force that varies with position:
is propelling work, is the net force that continues driving the load at position , and is effective stopping distance. When a defensible constant-force approximation is appropriate, use . Do not automatically substitute theoretical bore force; chamber pressure and exhaust back pressure can change throughout the event.
For a linear axis inclined at angle from horizontal, gravity contributes:
is positive when gravity drives the load into the stop and negative when it resists that motion. Use and document the sign for each travel direction.
The screening energy for one event is:
Trapped compressed air can add or remove work nonlinearly as chamber volumes and pressures change. This effect can matter. When it does, use a validated pneumatic model or measured pressure-position data instead of a guessed “residual pressure percentage.”
For repeated production stops, also check heat load:
is energy per hour and is the number of stopping events per hour. An emergency-only device and a continuously cycled absorber can have different duty limits even when the energy of one impact is identical.
For a narrower explanation of moving-load energy, see the kinetic-energy calculation guide. For effective mass, return time, temperature, mounting, and model selection, use the external shock absorber sizing guide.
Average Force, Peak Force, and Stopping Distance
ACE uses a model-specific reaction-force approximation of for its correctly adjusted industrial absorbers, not the universal relationship . That manufacturer coefficient demonstrates why mass and stopping distance alone cannot reveal the peak force of an arbitrary cylinder, bumper, bracket, or hard stop (ACE Controls, retrieved 2026-07-23).
Distance changes the average, not the curve.
Average energy-equivalent force is the event energy divided by effective stopping distance:
is the average force over the assumed effective distance . This result is useful for comparing stop concepts. It does not include the shape of the deceleration curve, clearance take-up, contact stiffness, seal friction, bracket vibration, rebound, or the location where force is measured.
If the real acceleration history is available, the moving mass contributes an inertial force:
Loads at a particular bolt, guide, rod, or frame member can still differ because pneumatic thrust, gravity, linkage geometry, and local dynamic response act in the same path. Use a suitable load cell, accelerometer, pressure transducer, or validated dynamic model when a peak structural limit matters.
Average force cannot certify a bracket.
Keep two boundaries on the calculation sheet. Treat them separately. Use the energy boundary to determine what the stopping device must absorb. Track the structural boundary to identify where the reaction travels and which component needs a peak-load check. Passing the first boundary does not automatically pass the second.
Worked Example: What Can a 30 kg Moving Load Tell You?
Work-energy analysis needs only measured mass and impact velocity to establish the initial kinetic energy, but it still needs a defined stop to estimate average force. ACE therefore treats impact velocity, drive force, stroke, and cycle rate as separate application inputs rather than hiding them inside one impact multiplier (ACE Controls, retrieved 2026-07-23).
This example is intentionally bounded.
Consider a horizontal carriage with these measured or specified inputs:
| Input | Value | Boundary |
|---|---|---|
| Total moving mass, | 30 kg | Includes carriage, tooling, and product |
| Velocity before the stop, | 1.5 m/s | Measured near the stop |
| Gravity work | 0 J | Horizontal axis |
| Continuing drive work | 0 J for this screening case | Assumes the drive no longer propels the load |
Calculate the kinetic energy:
Now compare three assumed stopping distances. These are concept comparisons, not product ratings:
| Assumed effective stopping distance | Average energy-equivalent force | What the result means |
|---|---|---|
| Preliminary average for a controlled stop using the full distance | ||
| Shorter distance raises the average even though energy is unchanged | ||
| Screening average for a very short stop, not a peak-force prediction |
With 5 mm of stopping distance, the average is 8 times the 40 mm case because force varies inversely with distance under these assumptions. It does not establish that the machine will experience a 6,750 N peak. Rigid contact can produce a higher short-duration peak, while a tuned absorber has its own reaction curve and catalog limits.
If the cylinder continues pushing with 600 N through a 25 mm stop, it adds:
Adding both terms gives 48.75 J, and the corresponding average over 25 mm becomes 1,950 N. This is why a power-loss test must establish whether thrust truly disappears, decays, reverses, or remains trapped during the stopping interval.
For the broader distinction between average and peak end-of-stroke load, use the end-of-stroke force guide.
Which Stop Strategy Matches the Hazard?
ISO 12100:2010 supplies the machinery risk-assessment and risk-reduction method, while ISO 13849-1:2023 supplies a method for designing safety-related control functions across electrical, hydraulic, pneumatic, mechanical, and software technologies. Neither standard assigns one universal valve arrangement to every cylinder (ISO 12100, 2010; ISO 13849-1, 2023).
Define the hazardous event and required state before choosing components. “Stop the cylinder safely” is too vague. Instead, state the trigger, motion direction, maximum permitted travel, stopping time, final pressure or holding state, response to a relevant fault, and reset behavior.
| Hazard condition | Possible response concept | What must be verified |
|---|---|---|
| Horizontal carriage can strike a person | Controlled deceleration followed by exhaust or blocking | Stop time, travel, force or speed at the hazard, and restart inhibition |
| Vertical load can fall when pressure is removed | Controlled stop plus a validated brake, rod lock, or mechanical support | Holding capacity, engagement position, diagnostic behavior, leakage, and load drift |
| Trapped pressure is itself hazardous | Stop motion first, then exhaust the defined zone and monitor pressure | Residual pressure, exhaust time, silencer restrictions, and access conditions |
| Product must remain clamped after a stop | Maintain pressure only where the risk assessment permits it | Pressure decay, check-valve leakage, independent restraint, and fault response |
| Stored motion energy exceeds the cylinder cushion rating | Add a correctly sized external absorber or another controlled stop | Event energy, hourly energy, effective mass, velocity, stroke, reaction force, and mounting |
Hazard decides the function.
Functions differ. Festo’s definitions illustrate the available logic. SS1 slows the actuator and then reduces chamber pressure. SS2 slows it and maintains pressure to hold the stopped state. SSC closes an energy path and uses stored energy to reach the stop, while SSB combines stopping with blocking. These descriptions do not prove that one ordinary valve achieves the required Performance Level.
For vertical axes, read the rod-lock safety guide. For a complete safety-related control chain, use the ISO 13849 pneumatic safety circuit guide.
How Should the Installed Emergency Stop Be Verified?
ISO 13849-1:2023 applies to the integration of the complete safety-related control function and explicitly does not prescribe the required safety function or PLr for a particular machine. Verification must therefore cover the installed input, logic, pneumatic output, actuator, load, and mechanical reaction, not just a valve certificate (ISO 13849-1, 2023).
Acceptance limits belong in the test plan.
Create a test matrix before changing hardware. Include the heaviest and lightest payloads, fastest credible approach speed, both travel directions, maximum and minimum pressure, normal and adverse temperature, relevant valve or sensor faults, and every energy-loss mode identified in the risk assessment.
Measure quantities that answer the safety requirement:
- Velocity before demand: Record speed at the location where stopping begins, not only average stroke speed. Sample fast enough to avoid smoothing the final approach.
- Stopping time and distance: Measure from the safety demand and, separately, from the pneumatic output change.
- Pressure at both cylinder ports: Capture whether thrust remains, reverses, or decays during the stop. Synchronize both pressure channels with position so the pneumatic work can be related to motion.
- Acceleration or reaction force: Use sufficient sampling bandwidth to capture the transient when peak load matters.
- Final position and drift: Observe rebound, settling, leakage-driven movement, gravity-driven movement, and the state after the machine has remained stopped for the specified hold time.
- Residual pressure: Confirm the pressure state before access or service, including any isolated branch that the main gauge does not monitor.
- Reset and restart: Verify that restoring power or air does not initiate hazardous motion.
In our experience reviewing applications, the fastest way to expose a weak stop concept is to place the circuit drawing beside synchronized traces for position, both chamber pressures, and the safety command. Circuit drawings predict the intended state. Synchronized traces show whether the real valve timing, restrictions, leakage, and mechanics produce it.
Test the failure, not just the command.
During verification, align every trace to a common time base and retain the raw sample rate. Mark the safety input transition, logic output transition, valve-state indication, start of deceleration, standstill, and any later drift. Compare those timestamps with the stated response limit. Then examine pressure against position, because a falling port pressure does not prove that force vanished if the opposite chamber or gravity still drives the load. Repeat the test until normal variation is understood, but do not turn a small sample into a universal statistical promise. The acceptance record should identify the payload, recipe, regulator setting, temperature, component revisions, sensor ranges, sampling settings, and test restraints so another engineer can reproduce the result after maintenance.
Do not induce faults on an unprotected production machine. Plan it. Failure tests need guarded access, restrained loads, appropriate instrumentation, and a responsible machinery-safety engineer. Record exact component models and settings so maintenance teams can repeat the acceptance test after a change.
Which Emergency-Stop Shortcuts Produce Bad Designs?
ISO 4414:2010 addresses significant hazards across pneumatic system design, construction, modification, installation, adjustment, operation, and maintenance. That life-cycle scope is wider than selecting a valve or multiplying a calculated force by a generic margin (ISO 4414, 2010).
Shortcuts fail at interfaces.
Interfaces are where plausible component assumptions become unsafe machine behavior. Check every handoff. A valve may switch within its catalogue time while long tubing delays the chamber response. A rod lock may hold its rated axial load while a flexible mounting introduces side load. A pressure switch may report that the manifold exhausted while an isolated actuator volume remains charged. A shock absorber may pass its joule-per-event limit but overheat at the actual event rate or transmit reaction into an undersized bracket. Review electrical logic, pneumatic flow, actuator mechanics, external stopping hardware, structure, sensing, and operator access as one chain. Acceptance evidence must follow the complete energy path, not stop at the boundary of the component being purchased.
Avoid these shortcuts:
| Shortcut | Why it fails | Better engineering action |
|---|---|---|
| “All ports closed means safe” | Air compressibility, leakage, gravity, and external forces can still move the axis | Define permitted movement and verify pressure, drift, and holding behavior |
| “Exhausting both chambers is always safest” | A vertical or assisting load can fall or accelerate when support pressure disappears | Provide a validated holding or blocking measure based on the hazard |
| “A 40% margin converts average force into peak force” | An arbitrary multiplier cannot reconstruct the force-time curve | Measure peak response or use manufacturer reaction data and a validated model |
| “Flexible mounting reduces impact” | Uncontrolled frame flex changes alignment and transfers uncertain loads elsewhere | Use a rated energy absorber on a structurally verified load path |
| “A UPS guarantees a controlled stop” | Backup power is useful only when the safety function, diagnostics, failure modes, and capacity are validated | Treat the power source as one subsystem in the complete safety function |
| “The cylinder cushion handles every outage” | Cushion performance depends on entry speed, pressure, exhaust path, adjustment, and the exact cylinder rating | Compare the worst stop energy with model-specific cushion data and test it |
| “A safety-rated valve makes the machine compliant” | The achieved safety performance belongs to the complete function | Validate input, logic, output, actuator response, diagnostics, and faults together |
Internal pneumatic cushions remain useful for routine end-of-stroke deceleration. Their presence does not prove the abnormal stop. See the high-speed air-cushion guide for why cushion-entry speed and the real exhaust path must be checked.
Emergency Stop Validation Checklist
ISO 13850:2015 defines functional requirements for the emergency-stop function, but it does not provide the braking, shielding, disconnecting, or motion-limiting design by itself. Combine its function-level requirements with the machine risk assessment, pneumatic safety rules, and control-system validation appropriate to the application (ISO 13850, 2015).
Configuration control closes the loop.
Before releasing the machine, confirm that the file contains:
| Required record | Acceptance evidence |
|---|---|
| Initiating events | Separate definitions for electrical power loss, air-supply loss, emergency-stop demand, and relevant component faults |
| Safe state | Required pressure, motion, holding, and access state for every hazardous axis or zone |
| Circuit identity | Exact valve symbols, de-energized positions, pilot sources, checks, restrictions, and exhaust paths |
| Motion inputs | Total moving mass and velocity measured immediately before stopping |
| Energy worksheet | Kinetic, propelling, and gravity terms with units, directions, sources, and assumptions |
| Device limits | Exact cushion, bumper, brake, lock, or absorber model data for the installed duty |
| Structural boundary | Load path and measured or validated peak-load evidence where required |
| Stop test | Time, distance, chamber pressures, rebound, final position, drift, and repeatability |
| Fault response | Relevant single-fault behavior, diagnostic timing, and achieved safety performance evidence |
| Restart control | Deliberate reset, prevention of unexpected restart, and defined retest triggers after changes |
Recalculate and retest when payload, speed, pressure, tubing, valve, cylinder, absorber, mounting, controller timing, or machine geometry changes. Without configuration control, the calculation sheet becomes unreliable as soon as the installed stop differs from the recorded one.
Power-Loss Emergency Stop FAQs: What Should Engineers Verify?
ACE uses at least 5 application inputs before selecting an industrial shock absorber, and ISO 13849-1:2023 evaluates a complete safety-related control function rather than one component. These questions keep preliminary energy calculations separate from valve-state analysis, structural verification, and installed-machine testing (ACE Controls, retrieved 2026-07-23; ISO 13849-1, 2023).
Does a pneumatic cylinder lose all force immediately when electrical power fails?
No. Electrical power loss can change a solenoid valve’s position while supply and trapped chamber pressure remain. Resulting motion depends on the valve’s 2 or 3 positions, spring arrangement, pilot source, port connections, check valves, leakage, and load. Measure both chamber pressures and motion during the defined failure test.
Does energy divided by stopping distance give the peak impact force?
No. Energy divided by effective stopping distance gives an average energy-equivalent force under stated assumptions. Peak force depends on the force-time curve and load path. In the 30 kg example, 5 mm gives a 6,750 N average, not a verified peak.
Should a power-loss stop exhaust the cylinder or trap pressure?
Neither response is universally correct. It depends on the hazard. Festo distinguishes SS1, which depressurizes after stopping, from SS2, which maintains pressure after stopping. Vertical loads may need blocking, while trapped pressure may be the hazard in another machine. Select the response from the risk assessment and verify the installed circuit.
When is an external shock absorber required?
Use an external absorber when the chosen cylinder cushion or other stop cannot accept the credible event energy, velocity, effective mass, or duty. Selection needs more than joules. ACE checks single-event energy, energy per hour, effective mass, stroke, and impact velocity, followed by mounting and installed-machine verification.
What measurements belong in an emergency-stop acceptance test?
Record at least 7 result groups: pre-demand velocity, stop time, stop distance, both chamber pressures, acceleration or reaction force when needed, final position or drift, and restart behavior. Test the worst credible configurations and relevant faults. Compare each result with a written safety-function limit, not a subjective “smooth stop” judgment.
Sources and technical references
ISO 13850:2015, Emergency stop function and energy-independent design principles
ISO 12100:2010, Machinery risk assessment and risk-reduction methodology
ISO 4414:2010, General pneumatic system rules and life-cycle safety requirements
Festo, Pneumatic safety sub-functions including SS1, SS2, SSC, SSB, STO, and SOS