

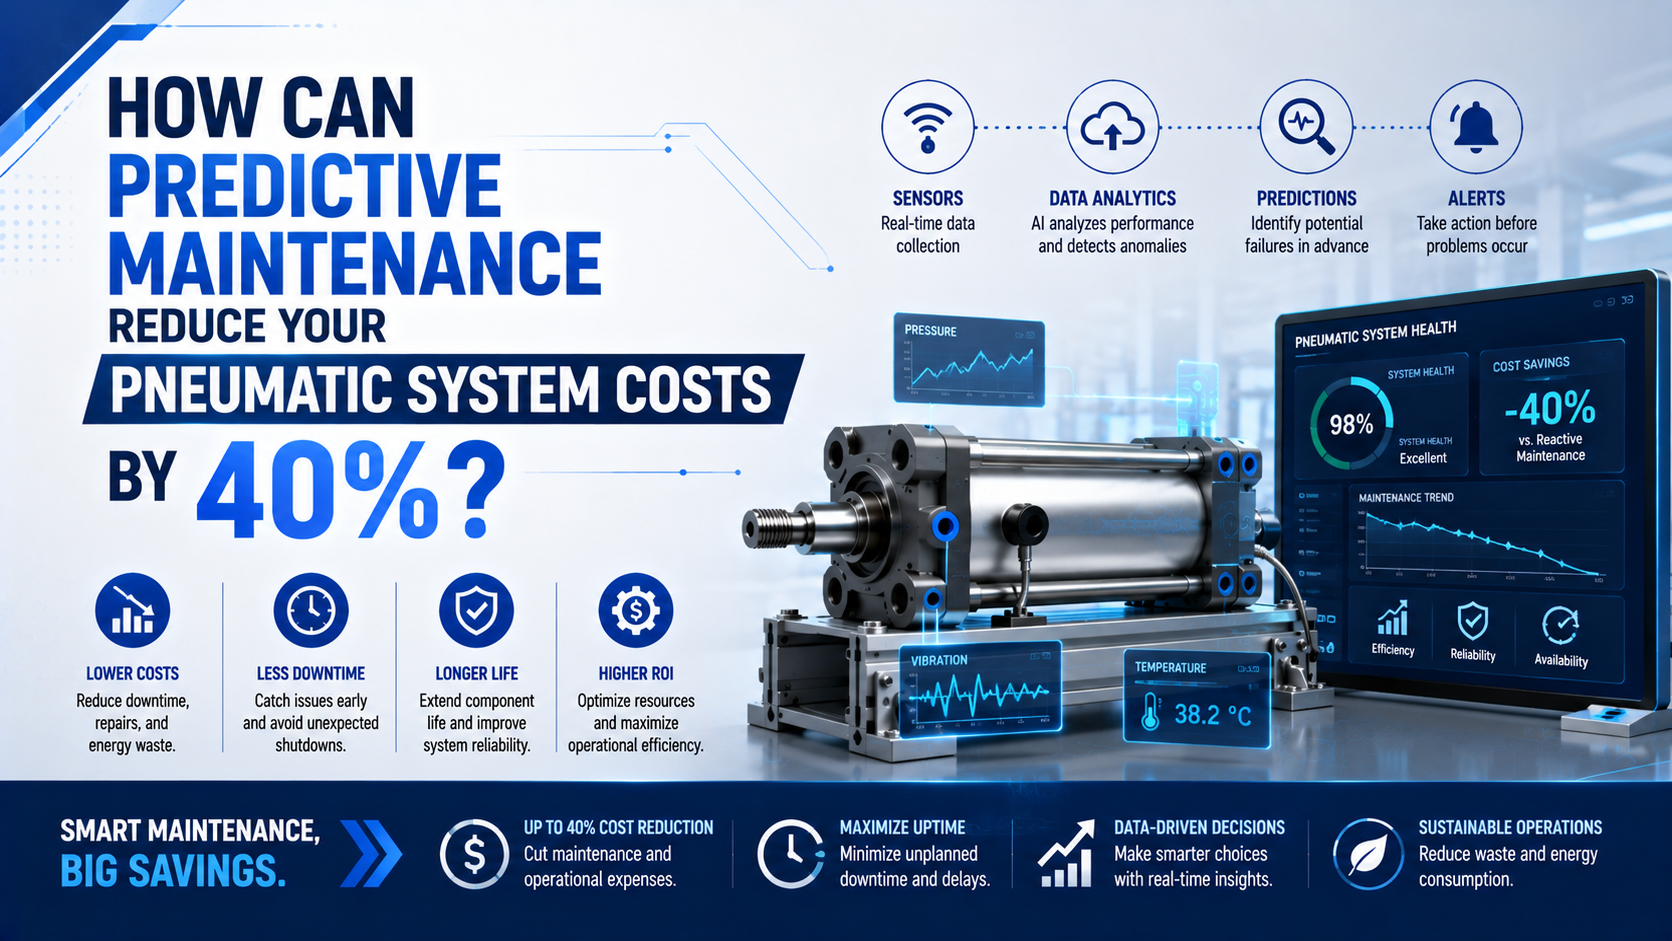
Predictive maintenance can approach a 40% pneumatic cost reduction when a plant starts with expensive reactive failures, measures the full cost of those failures, fixes verified causes, and confirms the result after repair. It is not a universal saving. A site with few failures, low downtime cost, or poor baseline data may save far less.
The useful question is therefore not, “Which sensor will save 40%?” It is, “Which avoidable costs can this maintenance decision remove, and how will we prove that they stayed removed?” That shift turns predictive maintenance from a technology purchase into a controlled financial experiment.
Key Takeaways
- DOE guidance describes savings above 30-40% as an opportunity for some facilities, not a guarantee.
- Count downtime, energy, emergency labor, quality loss, and program cost before claiming savings.
- Begin with one costly failure mode, verify every alert, and scale only after the pilot produces repeatable net savings.
Pneumatic predictive maintenance is the use of condition data to trigger investigation and planned action before a functional failure. Pressure, flow, cycle time, air consumption, position, temperature, sound, and maintenance records can all contribute. None of them identifies a failed part by itself.
Can Predictive Maintenance Really Cut Pneumatic Costs by 40%?
It can in a high-opportunity plant, but 40% is a conditional ceiling rather than a standard outcome. The U.S. Department of Energy reports estimated savings of 8-12% over preventive maintenance alone and notes that facilities dominated by reactive work may find opportunities above 30-40% (DOE O&M Best Practices Guide, 2010).
That distinction protects the business case. If a pneumatic line already has low leakage, few emergency stops, good spare-part control, and disciplined preventive work, there may not be 40% left to recover. A troubled line with recurring seal failures, long troubleshooting delays, pressure instability, and expensive lost production has a different starting point.
DOE’s figures also describe broad industrial maintenance programs, not a guaranteed result for pneumatic equipment. NIST cautions that reported maintenance-cost reductions use different definitions and range widely across countries and industries (NIST, updated 2025).
Treat 40% as a testable hypothesis:
- define the cost boundary;
- record the baseline for a fixed production period;
- choose a failure mode that data can reveal and maintenance can correct;
- include the monitoring and implementation cost;
- compare normalized results after the repair;
- reject the claim if production, product mix, or accounting boundaries changed.
The percentage belongs at the end of the analysis. It should never be typed into the project charter as a promised result.
What Costs Belong in the Baseline?
The baseline must extend beyond replacement parts. NIST estimated USD 119.1 billion in preventable manufacturing losses for its 2016 reference year, including USD 18.1 billion from downtime and USD 100.2 billion from delayed or defective sales (NIST, updated 2025).
For one pneumatic asset group, use a consistent annual or production-normalized boundary:
| Cost group | Include | Evidence to retain |
|---|---|---|
| Planned maintenance | Inspection, scheduled labor, planned parts, permits, and restart checks | Work orders, labor hours, part issues |
| Emergency maintenance | Callout labor, overtime, expedited freight, and temporary repairs | Breakdown work orders and purchase records |
| Downtime | Lost contribution margin, idle labor, restart loss, and missed throughput | PLC events, production records, finance-approved rate |
| Compressed-air waste | Verified leakage, excess pressure, and avoidable air demand | Flow, pressure, operating hours, compressor performance |
| Quality loss | Scrap, rework, inspection, and customer impact caused by the fault | Quality records linked to the asset event |
| Program cost | Sensors, meters, software, installation, training, analysis, and calibration | Project ledger and recurring support cost |
Do not mix avoidable cost with all plant overhead. Rent, normal operator wages, and compressor depreciation may continue whether the pilot succeeds or not. Finance should approve the cost boundary before maintenance begins collecting “savings.”
Normalize results when output changes. Useful denominators include operating hour, machine cycle, accepted part, batch, or standard production unit. Comparing a high-volume baseline month with a low-volume trial month can make energy and failure costs look better without any maintenance improvement.
The cost of pneumatic downtime deserves its own approved rate. Use contribution margin or another finance-approved method, not the machine’s gross sales value.
Building an Actionable Pneumatic Signal Set
Start with signals tied to a costly and correctable failure mode. DOE states that compressed-air leaks can waste 20-30% of compressor output, which makes verified leakage a strong early target when the compressor control system can reduce power after demand falls (DOE compressed-air leak guidance, 2004).
The best signal is not necessarily the most advanced sensor. It is the signal that changes a maintenance decision.
In our experience, a modest measurement with a named owner and a defined response usually creates more value than a dense dashboard that nobody is authorized to act on.
| Signal | Possible economic loss | Competing causes to check | Actionable result |
|---|---|---|---|
| Air consumption per comparable cycle | Energy waste, longer compressor runtime | Product mix, sequence change, another branch load | Locate and quantify the added demand |
| Dynamic supply and port pressure | Slow motion, lost throughput, unstable force | Filter, regulator, valve, tubing, fittings, exhaust restriction | Isolate the restriction or leakage point |
| Extend and retract time | Cycle loss, collision risk, missed sequence | Payload, flow setting, valve delay, alignment, cushioning | Compare each direction under the same load |
| End-position timing | Stops, reject events, unsafe sequence assumptions | Sensor movement, control logic, hard stop, mechanical bind | Confirm motion completion and repeatability |
| Sound or ultrasound | External leakage and wasted air | Valve exhaust, nearby equipment, measurement angle | Tag the exact leak and verify the repair |
| Temperature trend | Friction, overloaded guide, blocked exhaust | Ambient heat, process heat, emissivity, duty change | Corroborate with motion, load, and inspection |
A rising cycle time is not a seal diagnosis. Low dynamic pressure, a restricted silencer, a changed load, misalignment, or an altered flow control can produce the same symptom. The pneumatic actuator maintenance checklist provides the routine inspection layer; the predictive spare-parts guide covers the deeper evidence needed before ordering parts.
For leakage work, quantify the opportunity before ranking repairs:
Use a pressure-decay leak-rate calculation only when the test volume can be isolated safely and the starting pressure, ending pressure, volume, temperature assumptions, and elapsed time are known. For plant-wide demand, the Compressed Air Energy Cost Calculator is the better secondary check.
If the project is primarily an energy program, use the separate guide to pneumatic energy-cost measurement and verification. This article keeps the wider maintenance boundary, including emergency labor, downtime, quality loss, and program cost.
How Should an Anomaly Become a Verified Maintenance Action?
An alert should open an investigation, not automatically order a part. ISO 17359:2018 is a 29-page general framework for building condition-monitoring programs and applies across machine types; it does not prescribe universal alarm limits for pneumatic cylinders, valves, or air systems (ISO 17359, confirmed 2023).
Use the same decision path for a simple spreadsheet trend and an advanced analytics platform:
- Control the operating state. Confirm product, load, recipe, pressure setting, flow setting, temperature state, and machine sequence.
- Validate the measurement. Check instrument range, location, calibration status, timestamp, sample rate, and data gaps.
- Repeat the symptom. A single spike may be switching noise, a transient production event, or bad data.
- Divide the circuit. Check air preparation, valve, fittings, tubing, flow controls, actuator, load, guide, and controls.
- Confirm the failure mode. Use safe isolation, inspection, leakage testing, pressure traces, or part examination as appropriate.
- Plan the action. Define the repair, part number, work window, safety controls, and expected post-repair result.
- Verify after repair. Repeat the controlled test and confirm that the cost-driving signal improved without creating a new problem.
Safety remains a separate gate. ISO 4414 establishes general rules and safety requirements for pneumatic systems, so monitoring never replaces the machine risk assessment, energy isolation, pressure release, load support, or authorized restart procedure (ISO 4414, confirmed 2023).
How Do You Calculate Net Savings and Payback?
Use net savings, not avoided downtime alone. NIST found that manufacturers relying mainly on preventive and predictive approaches associated predictive maintenance with 15% less downtime, but it also warned that the survey had limited respondents and did not establish a pneumatic-specific return (NIST AMS 100-34, 2020).
Start with the baseline:
Each term represents the annual or normalized cost for the same asset group and production basis. Keep program cost outside the baseline unless the same monitoring program already existed during that period.
Calculate net savings:
uses the same cost categories after implementation. includes equipment, integration, software, training, calibration, analysis, and recurring support for the comparison period.
The verified savings rate is:
For payback:
is measured in months when program cost and average monthly net saving use consistent accounting treatment.
Worked example: a hypothetical pneumatic cell
Assume a cell has an approved annual baseline of USD 170,000:
- planned maintenance: USD 18,000;
- emergency maintenance: USD 22,000;
- downtime: USD 90,000;
- avoidable compressed-air cost: USD 28,000;
- quality loss linked to pneumatic faults: USD 12,000.
After a pilot, the same normalized categories total USD 102,000. The first-year monitoring and implementation cost is USD 16,000. Net saving is therefore USD 52,000, and the verified saving rate is 30.6%.
This example does not reach 40%. To claim 40% from the same baseline, the program would need at least USD 68,000 in verified net annual savings after program cost. That is exactly why the calculation should challenge the headline rather than bend the data to match it.
Also separate recurring savings from one-time avoidance. Preventing one major failure is valuable, but a single avoided event does not prove the same saving will repeat every year. Report one-time, annualized, and recurring values separately.
What Should a Low-Risk Pilot Measure?
Choose one cell where reactive loss is visible and action ownership is clear. In the NIST survey, manufacturers in the highest quartile of reactive-maintenance reliance were associated with 3.3 times more downtime than other respondents, making repeat breakdowns a stronger pilot signal than a fashionable sensor opportunity (NIST, updated 2025).
A practical pilot needs six controls:
- One named asset group. Avoid a plant-wide rollout before the data model and work process are proven.
- One costly failure mode. Examples include recurring external leakage, direction-specific slow stroke, pressure loss during motion, or repeated end-position timeout.
- A controlled healthy baseline. Record operating state, measurement method, ordinary variation, and maintenance condition.
- Two alert levels. A warning prompts review; an action level prompts a defined diagnostic procedure. Neither automatically proves a failed part.
- A work-order link. Each alert needs an owner, evidence, diagnosis, action, parts, labor, and post-repair result.
- A financial closeout. Finance or operations confirms the downtime rate, production normalization, program cost, and accepted saving.
Useful pilot KPIs include verified alerts per total alerts, false-alert investigation time, mean time from anomaly to diagnosis, emergency work hours, planned-work ratio, repeat failure count, leak cost removed, and post-repair persistence.
Don’t optimize an algorithm while the maintenance response is undefined. A precise alert that sits unassigned for three days produces no saving.
When Does Predictive Maintenance Fail to Pay?
Predictive maintenance isn’t automatically more economical than preventive work. NIST found published maintenance-cost reductions ranging from 15% to 98% and concluded that effects were not well documented at national level, a spread too wide to serve as a plant budget assumption (NIST, updated 2025).
The project may not pay when:
- failure consequence is low and a standard part can be replaced quickly;
- the asset lacks a repeatable operating state;
- product mix changes more than the fault signal;
- the sensor cannot distinguish the target fault from upstream causes;
- maintenance has no approved diagnostic response;
- data ownership, time synchronization, or calibration is weak;
- the model produces too many false alerts;
- the equipment will be retired before payback;
- compressor controls cannot reduce power after air demand falls;
- program support cost grows faster than verified savings.
Sometimes the best predictive-maintenance decision is to stop predicting. A low-cost seal replaced during a fixed shutdown may not justify permanent sensing. Conversely, a hard-to-access rodless cylinder on a bottleneck line may justify pressure, cycle-time, and leak trending even when the cylinder itself is inexpensive.
The decision depends on failure consequence, diagnostic lead time, repair lead time, and whether intervention can occur before the loss. Component price alone is a poor screening variable.
Scaling the Program Beyond the Pilot
Scale only after the pilot closes both technical and financial loops. NIST reported that 45.7% of maintenance activity in its manufacturing sample was reactive, but the right expansion order still depends on each site’s failure history, data quality, and ability to act on an alert (NIST AMS 100-34, 2020).
Use four expansion gates:
- Repeatability: the signal changed under comparable operating conditions and remained improved after repair.
- Diagnostic precision: maintenance isolated the physical cause without replacing unrelated parts.
- Economic proof: normalized net savings remained positive after program and support cost.
- Operational ownership: named roles maintain sensors, review alerts, create work orders, approve repairs, and audit results.
Then rank the next assets by avoidable annual loss, failure frequency, detection lead time, repair lead time, and deployment reuse. Reusing a proven measurement and response pattern across ten similar machines is usually safer than building ten unrelated models.
Keep preventive maintenance where it still works. Time-based filter inspection, authorized lubrication, safety checks, drain service, and replacement intervals may remain necessary. Predictive data should adjust a task only when the evidence and risk controls justify the change. For rodless axes, pair the program with a facility-level preventive checklist.
Conclusion: Make 40% a Result, Not a Promise
NIST associated predictive maintenance with 15% less downtime among mainly preventive and predictive manufacturers, while DOE describes opportunities above 30-40% only for some facilities with substantial reactive-maintenance exposure. Together, those findings support a measured business case, not a universal pneumatic savings guarantee (NIST; DOE).
Define the cost boundary first. Choose a failure mode that can be detected and corrected. Validate the alert, verify the repair, normalize production, and subtract every program cost. If the result is 12%, report 12%. If the same method proves 40%, the number will withstand engineering, maintenance, operations, and finance review.
Pneumatic Predictive Maintenance FAQs
Use these four questions as the final project gate. ISO 17359 provides a 29-page program framework, while NIST found that only 17.3% of maintenance activity in its manufacturing sample was predictive. Neither figure replaces a site-specific baseline, fault-isolation method, safety procedure, or approved financial model (ISO 17359; NIST).
Does predictive maintenance always reduce pneumatic costs by 40%?
No. DOE describes savings above 30-40% as an opportunity for facilities with enough reactive-maintenance exposure, not a guaranteed pneumatic result. Calculate net savings from one consistent baseline, subtract monitoring and support cost, normalize production, and retain the evidence. A well-maintained plant may have a much smaller recoverable opportunity.
Which pneumatic signal should a plant monitor first?
Start with the signal tied to the largest verified avoidable loss. DOE reports that leaks can waste 20-30% of compressor output, so leakage is often useful, but only when the leak can be located, repaired, and followed by lower compressor power. Other plants may gain more from cycle-time or pressure monitoring.
Can an alert prove that a pneumatic cylinder seal has failed?
No. ISO 17359 supplies general condition-monitoring procedures, not universal cylinder alarm limits. A pressure, flow, temperature, or cycle-time change can originate in the air supply, regulator, valve, tubing, fittings, load, alignment, sensor, or controls. Reproduce the symptom and isolate the circuit before ordering a seal kit.
How long should a predictive maintenance pilot run?
There is no universal duration. NIST’s maintenance research compares outcomes across manufacturing establishments but does not prescribe a pneumatic pilot length. Run long enough to cover representative production states, observe the target failure or degradation pattern, complete at least one verified intervention, and confirm that the technical and financial improvement persists.
Sources and technical references
- U.S. Department of Energy, Operations & Maintenance Best Practices Guide. Used for predictive-maintenance savings ranges and implementation boundaries.
- NIST, Research Suggests Significant Benefits to Investing in Advanced Machinery Maintenance. Used for maintenance-strategy prevalence, downtime, defects, inventory, and preventable-loss context.
- NIST, Economics of Manufacturing Machinery Maintenance. Used for the U.S. manufacturing survey scope and evidence limitations.
- NIST, Potential Cost Savings as U.S. Manufacturers Spend Billions on Machinery Maintenance. Used to explain the wide range and limited comparability of published savings estimates.
- ISO 17359:2018, Condition monitoring and diagnostics of machines. Used for the general condition-monitoring program framework.
- ISO 4414:2010, Pneumatic fluid power, General rules and safety requirements. Used for pneumatic-system safety and maintenance context.
- U.S. Department of Energy, Minimize Compressed Air Leaks. Used for compressed-air leakage magnitude and repair-program guidance.
- NIST, Five Simple Digital Applications That Are Changing Manufacturing. Used for the data, problem-framing, and evaluation requirements of predictive maintenance.