

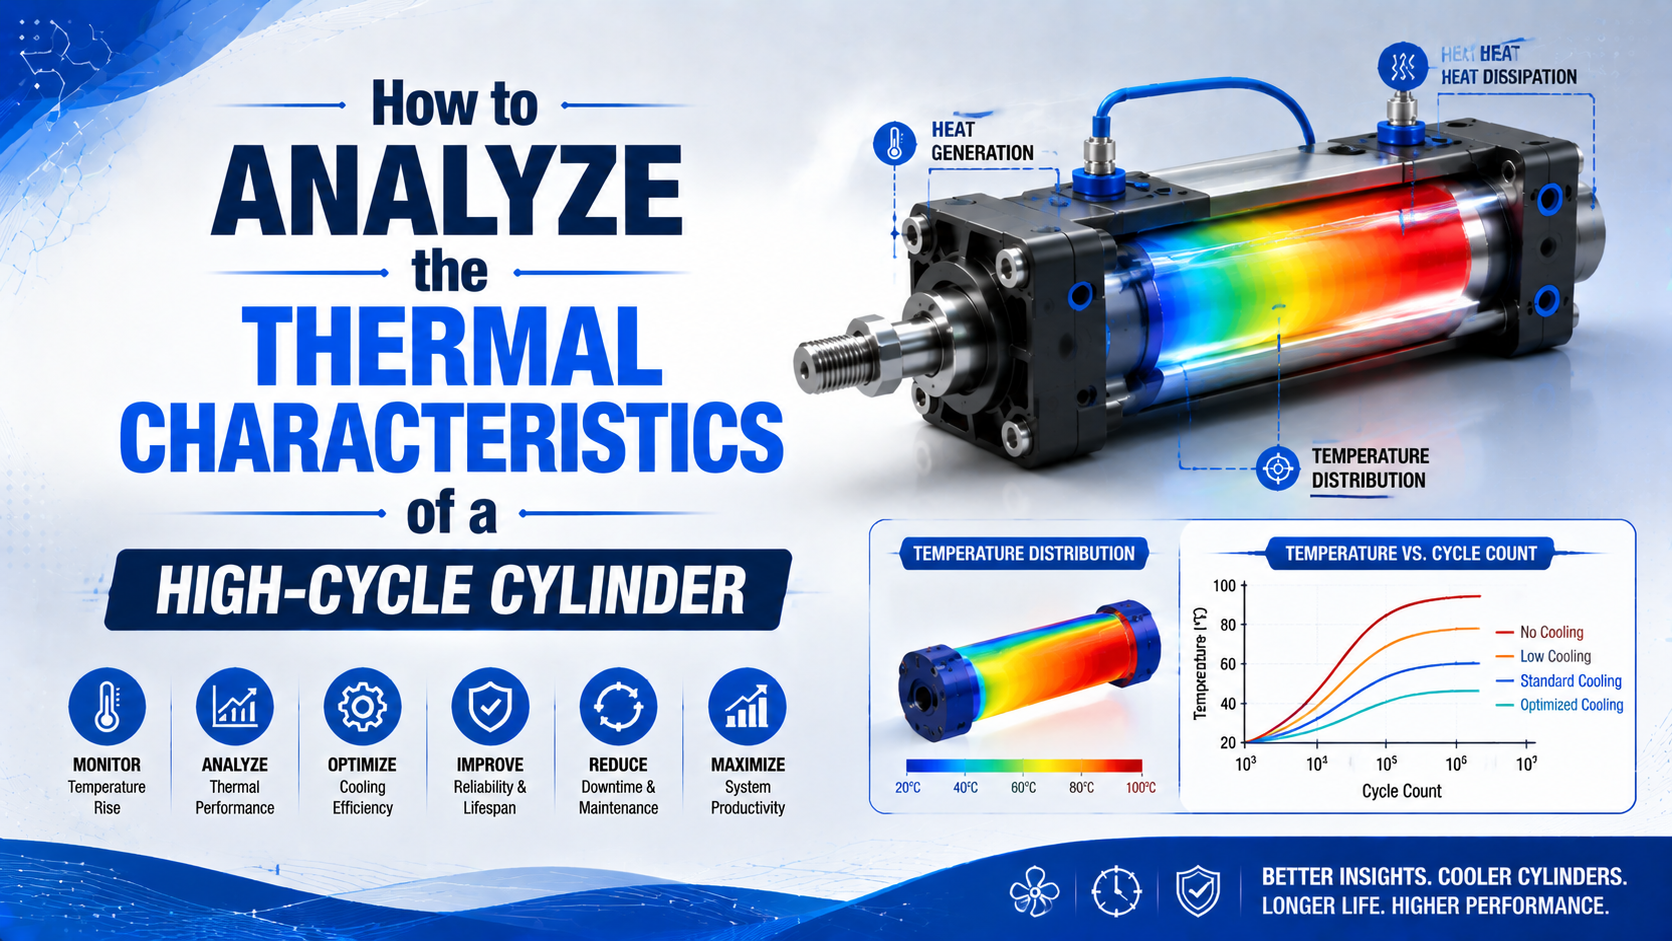
High-cycle cylinder thermal analysis is the measurement of how chamber gas, cylinder surfaces, seals, guides, and nearby hardware change temperature during repeated operation. The useful result is not one peak reading. It is a synchronized record of ambient temperature, surface temperature rise, cycle rate, pressure, load, speed, and cooldown behaviour.
A 2017 experiment on a 50 mm-bore pneumatic cylinder measured a 23 K chamber-temperature rise during compression and a 17 K drop during expansion. Those values belonged to that apparatus and test cycle, not to every industrial cylinder (Al-Nahrain Journal for Engineering Sciences, 2017). A field test should follow the same principle: measure the installed machine instead of applying a universal temperature allowance.
Key Takeaways
- Measure surface temperature rise above ambient, not temperature alone.
- A 2017 test recorded both a 23 K rise and a 17 K drop inside one cylinder.
- Use thermal time constant and cooldown data to separate normal accumulation from a developing fault.
- Compare results with the exact cylinder and accessory ratings.
What Should a High-Cycle Cylinder Thermal Analysis Measure?
A 2017 cylinder experiment measured a 23 K chamber-temperature rise during compression and a 17 K drop during expansion in one 50 mm-bore actuator. Those setup-specific results show why thermal analysis must track gas, surface, ambient, pressure, and motion as separate signals rather than assume one shared temperature (Hassan et al., 2017).
Start by defining the thermal boundary. For most production machines, the boundary includes the cylinder body, end caps, rod gland or rodless sealing slot, mounting interface, nearby valve, tubing, and surrounding air. An oven wall, hot product, washdown spray, or machine bracket can add heat from outside the actuator.
Use ambient-corrected temperature rise for comparisons:
Here, is the measured surface temperature at a named location and is the local ambient-air temperature recorded at the same time. Use degrees Celsius or kelvin consistently. A 45°C gland in a 40°C enclosure is a different thermal condition from a 45°C gland in a 20°C room.
Record these operating variables with every temperature trace:
- Cylinder model, bore, stroke, seal option, switch type, and lubricant policy
- Cycle rate
- Supply pressure plus both cylinder-port pressures during motion
- Load, orientation, mounting arrangement, guide condition, and side-load risk
- Tube ID and length, valve model, fitting arrangement, flow-control direction and setting, cushion position, silencer condition, and any quick-exhaust valve
- Ambient temperature, nearby radiant or conducted heat, airflow, and washdown events
Synchronize every channel before the test.
ISO 19973-3 expresses pneumatic-cylinder life in cycles or kilometres and defines controlled reliability-test reporting. A plant thermal trend is not an ISO 19973 reliability test, but cycle count remains the correct exposure variable for repeated motion (ISO 19973-3, 2015). Pair thermal records with the high-speed pneumatic cylinder specification checklist so the test conditions can be reproduced.
Two cylinders at the same cycles per minute can have different heat histories. Stroke length, piston speed, seal preload, dwell, pressure, exhaust restriction, and cooling area change the energy generated per cycle and the time available to reject it. Cycle rate is an exposure descriptor, not a heat-source equation.
Where Should Temperature Sensors Be Installed?
NIST reports 0.5°C expanded calibration uncertainty for K- and N-type thermocouples from 0 to 500°C in its industrial calibration service, but that value excludes installation and readout effects. On a cylinder, repeatable contact, location, insulation, and timestamps matter as much as the probe specification (NIST, updated 2025).
Use one sensor for ambient air and at least three repeatable surface locations. A practical starting set is the rod gland, barrel near mid-stroke, and each end cap. Add the mounting bracket when heat may conduct from the machine frame. For a rodless cylinder, include the carriage or sealing-slot region and the hottest guide location.
Bonded thermocouples or thin contact probes are usually better for repeatable trend testing than hand-held spot readings. Use the same attachment pressure and insulation method each time. Avoid placing a large probe where it becomes a heat sink or where its cable rubs the moving rod.
An infrared camera is useful for finding a hot region, but polished aluminium, chrome-plated rods, and stainless surfaces can return misleading apparent temperatures. NIST reported a 54.3°C expanded uncertainty in one demanding metal-cutting thermography example, with emissivity and point-spread function as the largest contributors. That magnitude is not a cylinder-camera specification; it demonstrates why surface condition and spot size belong in the uncertainty budget (NIST, 2013).
Use thermal imaging to map the actuator, then validate important locations with a calibrated contact sensor. Record surface finish, emissivity setting, viewing distance, angle, and measurement spot size when infrared data will be compared across shifts.
How Do You Separate Gas Transients From Cylinder Surface Heating?
SMC documents an example at 0.5 MPa gauge and 27°C where adiabatic expansion predicted -93°C and piping reached about -80°C after exhaust. That does not mean the cylinder wall reached -80°C; gas, tube, seal, and metal respond on different time scales (SMC, retrieved 2026).
Gas temperature can change quickly during chamber filling and exhaust. The barrel, end caps, seals, and mounting structure have thermal mass, so their temperatures respond more slowly. Repeated compression, sliding friction, incoming air, exhaust cooling, convection, conduction, and radiation all contribute to the surface trace.
This distinction prevents three common diagnostic errors:
- A cold exhaust silencer does not prove the barrel is cold.
- A warm barrel does not prove compression heating is the dominant source.
- One surface peak does not reveal the gas temperature inside both chambers.
For the gas-process equations and pressure-ratio limits, use the dedicated guide to adiabatic expansion and cooling in pneumatic cylinders. In this article, gas transients are treated as inputs to a measured cylinder-level energy balance.
Condensation adds another layer. SMC warns that temperature drops can create internal condensation and wash grease from pneumatic components. When frost, mist, or repeated cold exhaust appears, record pressure dew point, valve location, tube volume, and the first cold point instead of assuming the cylinder itself generates excessive heat (SMC technical information, retrieved 2026).
Which Equations Describe High-Cycle Cylinder Heating?
Carneiro and de Almeida evaluated heat transfer in three industrial pneumatic actuators and used a thermal time constant to represent cylinder-to-environment heat exchange. Their work supports a measured lumped thermal model; it does not support universal friction or compression percentages (Proceedings of the IMechE, 2007).
A useful first-order surface model is:
is the effective thermal capacitance in J/K, is the effective thermal resistance to ambient in K/W, is average internally generated heat in W, and is surface temperature rise above the local ambient reference. This model assumes the chosen surface region behaves approximately as one thermal node.
At steady conditions, the derivative approaches zero:
The measured steady temperature rise therefore depends on both heat generation and the installed heat-rejection path. A cylinder can run hotter after a guard is added even when seal friction and cycle rate remain unchanged because airflow and effective thermal resistance changed.
The thermal time constant is:
During an approximate first-order cooldown with no continuing internal heat generation:
Here, is the temperature rise at the start of cooldown, is elapsed time, and is the time required for the ideal first-order temperature difference to fall to about 36.8% of its starting value. Fit the relation only when the ambient condition and heat-transfer path remain reasonably stable.
Seal and guide friction can be represented without inventing an area multiplier:
is friction work per complete cycle in joules, is measured or defensibly estimated resisting force, is travel distance, and is complete cycles per second. Not all friction work must appear at one measured surface, so use this as an energy estimate and validate it against the temperature map.
The heating curve and cooldown curve answer different questions. Heating combines generation and rejection. Cooldown isolates the installed rejection path more closely. If cooldown stays similar but operating temperature rises after maintenance, investigate new friction, pressure, speed, or cushion energy. If both curves change, inspect guards, airflow, brackets, insulation, and external heat transfer.
A Six-Stage Thermal Test for Production Cylinders
ISO 19973-3 evaluates first failure with a three-point moving average and expresses cylinder life in cycles or kilometres. A production thermal test does not reproduce that reliability standard, but it should copy the same discipline: fixed conditions, declared thresholds, repeatable logging, and traceable results (ISO 19973-3, 2015).
Use six stages:
- Document the machine state. Record the cylinder, load, pressure, valve, tubing, controls, ambient condition, and recent maintenance.
- Measure the idle baseline. Let the stopped machine approach a stable local ambient condition, then record every sensor.
- Run the actual production recipe. Keep cycle rate, load, dwell, pressure, cushion, and flow controls unchanged.
- Log synchronized signals. Record temperatures, ambient, cycle count, commands, motion time, and port pressures on one time base.
- Continue through the trend. Identify whether temperature approaches a plateau, keeps climbing, or changes after a specific operating event.
- Record cooldown and repeat. Stop motion without moving sensors, capture the cooling curve, then repeat after one controlled design change.
Do not choose a fixed sampling rate such as 1 Hz or 1,000 Hz without considering the signal. Surface temperature usually changes much more slowly than chamber pressure. Sample each channel fast enough to resolve its expected change, synchronize the clocks, and document any averaging. A pressure channel may need a higher rate than a bonded surface probe.
Set stop criteria before the test. Stop if a measured value reaches the lowest applicable component limit, the trend continues upward without an acceptable margin, motion becomes unstable, leakage increases, a guard becomes unsafe to touch, or the cylinder maker’s instructions require shutdown. A model-specific limit is better than an invented percentage above ambient.
How Do You Interpret Temperature Patterns and Find the Cause?
Parker lists -10°C to +80°C as the standard ambient range for its OSP-P rodless cylinders, with other ranges on request. This model-specific limit is not a universal threshold. Compare each measured temperature with the exact cylinder, seal, grease, switch, fitting, and tubing ratings (Parker OSP-P catalog, retrieved 2026).
Use the spatial pattern, timing, and pressure trace together:
| Observed pattern | Plausible mechanisms | Next check |
|---|---|---|
| Rod gland hotter than barrel | Seal friction, side load, tight bearing, poor lubrication | Alignment, guide load, breakaway force, rod condition |
| One end cap heats near stroke completion | Cushion compression, impact, exhaust restriction | Cushion, moving mass, speed, port pressure, silencer |
| Barrel reaches a repeatable plateau | Distributed loss with stable heat rejection | Compare plateau and cycle conditions with ratings |
| Temperature keeps rising | Excess generation, weak rejection, or a developing fault | Stop criteria, friction, pressure, duty, airflow, external heat |
| Mounting bracket is hotter | Conducted or radiant process heat | Frame temperature, shield, standoff, nearby equipment |
| Valve or silencer is cold or frosted | Expansion cooling plus moisture | Dew point, first cold point, exhaust restriction |
| Trace changes after maintenance | Seal preload, alignment, lubricant, cushion, or flow changed | Compare the work record and repeat the baseline |
Treat each row as a hypothesis, not a verdict. A hot gland can result from friction, but conducted heat from a nearby bracket can produce a similar surface reading. Port-pressure data, cooldown behaviour, and a controlled alignment check separate the causes.
For rod-end heating, compare the trace with the guide to rod-bearing and rod-seal failure prevention. For an end-cap peak, inspect pressure and cushion behaviour before changing seals. A blocked silencer or narrow exhaust path can also raise back pressure; the pneumatic pressure-drop troubleshooting guide covers that circuit-level check.
Which Changes Reduce Thermal Risk Without Masking the Fault?
ISO 8573-1 classifies compressed-air purity by particles, water, and oil, three contaminant groups that influence seals, corrosion, and lubricant condition. Thermal mitigation should therefore start with alignment, pressure, speed, exhaust restriction, air quality, and environment before adding fans or special seals (ISO 8573-1, 2010).
Apply changes in this order:
- Correct mechanical loading. Remove side load, binding, guide misalignment, rigid thermal growth constraints, and damaged bearings.
- Restore the intended pneumatic circuit. Confirm regulator behaviour, port pressure, valve capacity, tube ID, flow-control direction, cushion setting, and exhaust condition.
- Review cycle energy. Reduce speed, pressure, or cycle rate only when force, timing, stability, and safety remain acceptable.
- Control air quality. Verify particle, water, and oil requirements at the machine. Dry air and compatible lubrication must match the cylinder instructions.
- Reduce external heat gain. Add distance, shielding, standoffs, ventilation, or a cooler mounting path where process heat dominates.
- Select rated components. Only then consider a high-temperature cylinder option, seal compound, grease, sensor, fitting, tube, or cable rated for the measured condition.
In our experience with replacement reviews, a temperature trace becomes useful when it is paired with one observable failure mode. “The gland rises 12°C above the barrel and retraction pressure increases after warmup” gives an engineer a testable direction. “The cylinder feels hot” does not identify whether the problem is friction, pressure loss, process heat, or normal accumulation.
Self-lubricating seals do not eliminate the need to verify air quality, alignment, and surface condition. Use the self-lubricating cylinder seal guide for that narrower decision. If the installed body temperature is already outside the standard product range, continue with the high-temperature pneumatic cylinder selection guide.
Current online calculators can describe air consumption or cylinder speed, but they cannot predict cylinder temperature from cycle rate, friction, installation, and cooling conditions. Use them only to document part of the operating recipe. Base the thermal decision on the measured heat balance and component ratings.
From Thermal Trace to Engineering Decision
ISO 19973-1 notes that component service life varies and therefore benefits from statistical evaluation. High-cycle cylinder thermal analysis should follow the same evidence discipline: preserve the full test recipe, compare like-for-like traces, apply the lowest model-specific limit, and change one variable at a time (ISO 19973-1, 2015).
Begin with a synchronized surface-temperature map and local ambient reference. Use the heating curve to study generation plus rejection, and use cooldown to check the installed heat-transfer path. Investigate spatial differences with pressure, motion, alignment, maintenance, and environmental records before specifying cooling hardware or a different seal.
The final engineering decision should name the measured condition, the applicable component rating, the suspected mechanism, and the test that confirmed it. That chain is defensible. A generic temperature-rise allowance, anonymous service-life claim, or colourful simulation without validated boundary conditions is not.
High-Cycle Cylinder Thermal Analysis FAQs
ISO 19973-3 separates reliability testing from condition monitoring, while Parker gives one OSP-P family a standard -10°C to +80°C range. These FAQs keep thresholds tied to the installed product and measured trend rather than treating either source as a universal rule (ISO 19973-3, 2015; Parker, retrieved 2026).
What temperature rise is normal for a high-cycle pneumatic cylinder?
There is no universal normal rise. Establish the baseline at the real load, pressure, speed, cycle rate, ambient condition, and mounting arrangement. Compare the stable temperature and trend with the exact cylinder and accessory ratings. Parker’s -10°C to +80°C OSP-P range is one product-family specification, not a rule for every cylinder.
How long should a high-cycle cylinder thermal test run?
Run long enough to identify a stable plateau, continued rise, or repeatable event-driven change, then capture cooldown. Specify the cycle count and stop criteria before testing. ISO 19973-3 reports cylinder exposure in cycles or kilometres, so “tested for one hour” is incomplete unless the operating cycle and conditions are also recorded.
Can an infrared camera replace contact temperature sensors?
Not for every decision. Use infrared imaging to locate gradients, then validate critical points with repeatable contact sensors. In one NIST thermography study, emissivity and point-spread function dominated an expanded uncertainty of 54.3°C. That example is not a cylinder accuracy claim; it shows why shiny metal readings need validation.
Does a higher cycle rate always make the cylinder hotter?
Not by one universal proportion. Higher cycle rate reduces cooling time and can increase average friction work, but stroke, speed, dwell, pressure, load, seal condition, exhaust restriction, mounting, and airflow also matter. Compare and the measured temperature curve instead of multiplying cycle rate by a generic heat percentage.
When is FEA or CFD justified for cylinder thermal analysis?
Use detailed simulation when geometry, internal gas flow, thermal expansion, external radiation, or cooling design cannot be resolved with a lumped model. Validate boundary conditions against measured temperatures and pressures first. A colourful FEA plot without measured heat input, contact conductance, convection, or material data is not evidence of the installed temperature.
Sources and technical references
-
Hassan, Ghanim, and Hamandy, Experimental Investigation of a Temperature Change inside Pneumatic Cylinder Chambers, 2017, retrieved July 19, 2026.
-
Carneiro and de Almeida, Heat Transfer Evaluation of Industrial Pneumatic Cylinders, 2007, retrieved July 19, 2026.
-
ISO 19973-1:2015, Pneumatic Fluid Power, Assessment of Component Reliability by Testing, General Procedures, retrieved July 19, 2026.
-
ISO 19973-3:2015, Pneumatic Fluid Power, Assessment of Component Reliability by Testing, Cylinders with Piston Rod, retrieved July 19, 2026.
-
NIST, Industrial Thermometer Calibrations, updated 2025, retrieved July 19, 2026.
-
NIST, Uncertainty of Temperature Measurements by Infrared Thermography, 2013, retrieved July 19, 2026.
-
SMC, Precautionary Measures Against Condensation in a Pneumatic System, retrieved July 19, 2026.
-
Parker, OSP-P Pneumatic Rodless Cylinders and Linear Guides, retrieved July 19, 2026.
-
ISO 8573-1:2010, Compressed Air, Contaminants and Purity Classes, retrieved July 19, 2026.