

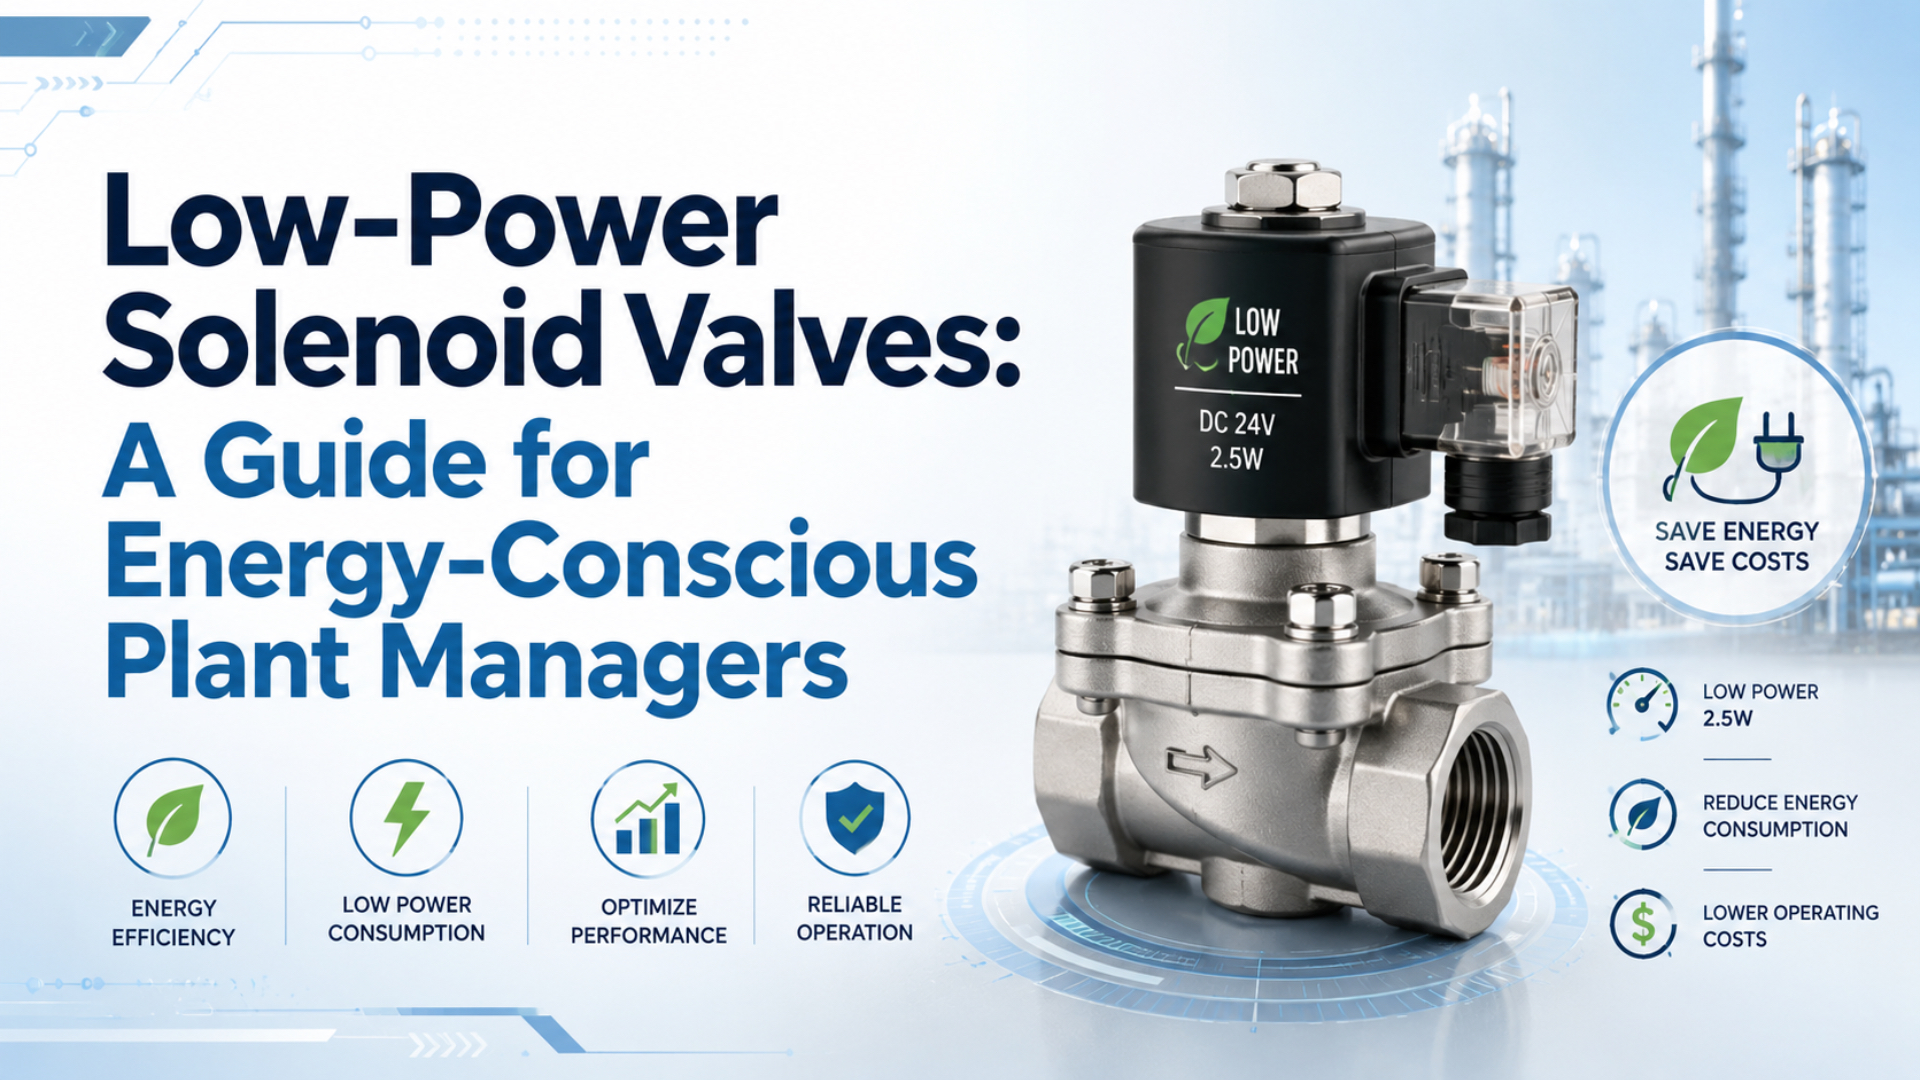
Low-power solenoid valves can cut coil holding power substantially, but the business case must start with the exact valve specification and correct electricity math. A low wattage label does not prove a short payback period, and coil electricity is not the same thing as the compressor energy used to produce compressed air.
The most useful question is practical: how many coils stay energized, for how many hours, at what measured wattage, and what will each compatible replacement cost? Once those inputs are known, a plant manager can calculate direct electrical savings, check heat and control-panel benefits, and decide whether a measured pilot is worthwhile.
Key Takeaways
- Festo documents a VUVG option that reduces holding power from 1 W to 0.35 W.
- SMC lists 0.35 W inrush for 100 ms and 0.1 W holding power on one S070 configuration.
- Calculate coil savings separately from compressed-air savings.
- Approve replacement only after electrical, pneumatic, safety, and timing checks.
A low-power solenoid valve uses a lower steady holding current, a peak-and-hold driver, a latching mechanism, or another design that reduces electrical demand after the armature has shifted. The design still has to keep the valve reliably actuated across its rated voltage, pressure, temperature, duty cycle, and contamination range.
Holding-current reduction is a control method that supplies enough current to shift the armature, then lowers current after the valve reaches its energized position. It must be matched to the coil and valve; it is not a generic voltage-reduction trick.
How Much Power Can a Low-Power Solenoid Valve Save?
Festo’s 2026 VUVG literature lists a 24 VDC holding-current-reduction option that lowers power from 1 W to 0.35 W, a 65% reduction for that specified electrical configuration (Festo VUVG technical data, 2026). This is credible product evidence, not a universal percentage for every solenoid valve.
SMC publishes a different example. Its S070 catalog lists 0.35 W during a 100 ms inrush period and 0.1 W while holding, which is about 71% below the inrush level (SMC S070 catalog, 2025). The comparison is within one power-saving circuit, not between every standard and low-power valve on the market.
Texas Instruments describes the same control principle at the driver level. The DRV110 ramps solenoid current quickly, holds it at a peak value long enough to actuate the load, then reduces it to a lower hold level to limit power dissipation and heat (Texas Instruments DRV110, 2018).
How can a valve use less power without losing its holding state? The magnetic force required to pull an armature across an open air gap is usually greater than the force needed after the magnetic path closes. A properly matched controller uses that difference. It does not simply starve an ordinary coil of voltage.
The useful comparison is not “ordinary valve versus low-power valve” as a broad category. Compare the exact standard configuration against the exact reduced-power configuration that preserves the required porting, flow, pressure range, response time, enclosure rating, manual override, connector, and safe state.
For more electrical detail, see the guides to coil inductance and solenoid response and AC versus DC solenoid coil response.
What Is the Correct Annual Energy-Cost Formula?
Using Festo’s published 1 W and 0.35 W figures, 100 continuously energized valves save 569.4 kWh per year, or $56.94 at $0.10/kWh (Festo VUVG technical data, 2026). That result is far below claims based on forgetting to convert watts to kilowatts.
Use this formula for direct coil electricity:
annual coil cost = valve count x energized watts x energized hours per year x electricity price / 1000Direct coil electricity is the electrical energy consumed by energized valve coils and their control electronics. It excludes the compressor energy used to generate and distribute compressed air.
The / 1000 converts watts to kilowatts. Omitting it overstates the answer by 1,000 times. Treating one valve’s wattage as though it applied to 100 valves creates another factor-of-100 error. Unit labels at every step prevent both mistakes.
Worked example: 100 valves energized continuously
| Input | Standard configuration | Reduced-hold configuration |
|---|---|---|
| Valve count | 100 | 100 |
| Energized power per valve | 1.00 W | 0.35 W |
| Energized hours | 8,760 h/year | 8,760 h/year |
| Electricity price | $0.10/kWh | $0.10/kWh |
| Annual coil energy | 876.0 kWh | 306.6 kWh |
| Annual coil electricity | $87.60 | $30.66 |
Direct annual saving: $87.60 - $30.66 = $56.94.
For example, doubling the electricity price from $0.10 to $0.20/kWh doubles this direct saving to $113.88 without changing the valve duty. For instance, operating only 4,380 energized hours instead of 8,760 cuts the original $56.94 result in half.
Does that make a retrofit unattractive? Not automatically. A large valve population, higher electricity price, full-time energization, reduced enclosure cooling, lower PLC output loading, or a replacement already due for maintenance can change the decision. But those benefits must be measured or costed separately.
No current Bepto calculator matches this job. The compressed-air energy cost calculator estimates compressor energy from air demand and specific power; it should not be used to calculate solenoid-coil electricity.
Which Operations Benefit Most From Lower Holding Power?
SMC lists 0.4 W standard and 0.1 W power-saving options for JSY3000 and JSY5000 plug-in valve families, a 75% configuration-level reduction (SMC energy-saving product data, retrieved July 11, 2026). The financial value depends on how many coils actually remain energized and for how long.
Start with operating state, not industry labels. A food plant is not automatically a better candidate than a machine shop. A continuously energized valve manifold in either facility may offer more direct electrical saving than hundreds of valves that pulse briefly and spend most of the shift de-energized.
Prioritize these conditions:
- Long energized duty: interlocks, clamps, diverters, process states, and normally energized circuits that remain on for hours.
- High valve density: large manifolds or distributed stations where dozens of coils add heat inside one enclosure.
- Limited output current: control systems where total PLC or remote-I/O current constrains expansion.
- Heat-sensitive equipment: sealed cabinets, laboratory instruments, compact assemblies, or temperature-sensitive media paths.
- Maintenance replacement: machines where compatible valves are already due for replacement, reducing incremental labor and downtime.
Do not assume that lower coil watts reduce compressed-air consumption. Air use is set mainly by pressure, actuator volume, cycle frequency, leakage, blow-off demand, and circuit design. Review compressed-air system efficiency separately.
A plant should maintain two ledgers: one for electrical coil energy and another for compressed-air energy. Combining them hides the real driver. A low-power coil can save electricity while leaving air consumption unchanged, while leak repair can save compressor energy without changing coil wattage at all.
What Must Be Verified Before Replacing Existing Valves?
SMC specifies a ±10% rated-voltage range for the S070 family and warns that incorrect voltage can cause malfunction or coil burning (SMC S070 catalog, 2025). A wattage comparison is therefore only one line in a complete electrical, pneumatic, mechanical, and safety review.
Electrical compatibility
- rated voltage and AC or DC supply
- inrush current, holding current, and PLC output limit
- connector pinout, polarity, LED, and protective circuit
- residual leakage voltage from the output or suppression network
- allowable voltage drop at the installed cable length
- duty cycle, ambient temperature, and coil insulation class
Peak-and-hold electronics can change current shape even when nominal voltage stays the same. Review how pneumatic solenoid valves work before treating a coil or connector change as a drop-in substitution.
Pneumatic and mechanical compatibility
- valve function: 2/2, 3/2, 5/2, or 5/3
- normal and de-energized state
- direct acting or pilot operated construction
- operating-pressure and pilot-pressure range
- Cv, Kv, sonic conductance, and exhaust capacity
- port size, manifold interface, mounting pattern, and envelope
- seal and body compatibility with the medium and environment
- manual override, response time, and switching frequency
Lower power is a failed trade if the replacement shifts slowly, cannot pilot at the minimum pressure, restricts exhaust, or changes the safe state. Use the valve response measurement guide to define command, pressure, and actuator timing on one trace.
Hazardous energy and maintenance
OSHA 1910.147 requires potentially hazardous stored or residual energy to be relieved, disconnected, restrained, or otherwise made safe after lockout or tagout is applied (OSHA 1910.147, retrieved July 11, 2026). A de-energized coil or closed directional valve is not an energy-isolating device.
Check isolation, bleed-down, trapped pressure, vertical loads, restart behavior, and manual-override access before approving a replacement. Valve placement also affects service and fault behavior; the pneumatic valve placement guide covers those boundaries.
How Should a Plant Run a Low-Power Valve Pilot?
TI’s TIDA-00289 reference design reports up to 70% power reduction for its tested 24 VDC solenoid driver and automatically changes from peak to hold current after detecting plunger movement (Texas Instruments TIDA-00289, 2014). A plant pilot should prove equally specific results on the actual machine.
Choose one representative station with enough energized hours to measure, but without an unacceptable production or safety consequence if the test is stopped. Record the existing part number, wiring, pressure, cycle, load, ambient temperature, energized time, and fault state before changing hardware.
Use this test sequence:
- Measure supply voltage at the coil while energized and during switching.
- Record inrush current, holding current, and the time spent in each state.
- Calculate real power with a suitable power analyzer, especially for PWM or rectified circuits.
- Measure coil and enclosure temperature after thermal stabilization.
- Record command, valve shift, port pressure, and actuator arrival on the same time base.
- Repeat at minimum and maximum expected pressure and voltage.
- Test loss of electrical power, loss of air, emergency stop, restart, and manual override.
- Inspect for chatter, leakage, connector heating, nuisance diagnostics, and delayed release.
Why not estimate everything from the catalog? PWM waveform, output leakage, cable drop, cabinet temperature, manifold pressure, exhaust restriction, and machine timing can all change the installed result. Catalog data defines the allowed configuration. Measurement proves whether that configuration works in your machine.
The pilot should have two acceptance thresholds: one for energy and one for machine behavior. Passing the wattage target does not excuse slower motion or an unsafe fault state. Passing the production test does not prove the forecast saving unless energized hours and real input power were measured.
Upgrade Approval Matrix
SMC’s S070 data combines 0.1 W holding power with response values of 3 to 6 ms or less for listed configurations, measured at rated voltage and maximum operating pressure (SMC S070 catalog, 2025). Approval must preserve both energy and functional performance.
| Decision item | Evidence required | Reject or redesign when |
|---|---|---|
| Electrical saving | measured inrush, hold power, energized hours, tariff | savings use nameplate assumptions that do not match the duty |
| Pneumatic function | valve function, pressure range, flow data, response trace | flow, minimum pilot pressure, or safe state differs |
| Control compatibility | PLC output rating, leakage voltage, diagnostics, connector pinout | output overload, ghost energization, or fault monitoring appears |
| Thermal result | stabilized coil and enclosure temperatures | temperatures exceed component or enclosure limits |
| Safety behavior | isolation, bleed-down, restart, power-loss test | trapped energy or unexpected motion remains unresolved |
| Financial result | incremental parts, labor, downtime, maintenance, verified annual saving | payback depends on rebates or cooling savings that are not documented |
Calculate simple payback only after the pilot:
simple payback = incremental installed cost / verified annual savingSimple payback is the incremental installed cost divided by the verified annual saving. It is a screening metric, not a complete lifecycle-cost model.
Keep limitations visible. Simple payback ignores financing, tax, residual value, production risk, and future electricity prices. For a small coil-electricity saving, planned maintenance timing may influence the decision more than the energy line alone.
Frequently Asked Questions
Festo’s documented 65% VUVG reduction and SMC’s documented 75% JSY reduction show that large holding-power cuts are technically possible in specific configurations (Festo, 2026; SMC, retrieved July 11, 2026). They do not establish one universal saving, price premium, or payback period.
Do low-power solenoid valves always save 50% to 80%?
No. Festo documents 1 W to 0.35 W for one VUVG option, while SMC lists 0.4 W to 0.1 W for selected JSY configurations. Those are 65% and 75% reductions respectively, but other valve families, voltages, connector circuits, duties, and comparison baselines can produce different results.
How much does a 1 W solenoid valve cost to run continuously?
At 8,760 energized hours and $0.10/kWh, one 1 W coil uses 8.76 kWh and costs $0.876 per year. One hundred such coils cost $87.60. The same 100 valves at 0.35 W cost $30.66, using Festo’s documented reduced-hold value as the example.
Can a low-power coil be installed on any existing valve?
Not safely by assumption. SMC specifies ±10% rated-voltage tolerance for the S070 and lists separate power, pressure, flow, and response configurations. Match the approved coil or connector to the exact valve, then verify voltage, pinout, suppression, duty, temperature, pilot pressure, function, and certifications.
Does lower coil power reduce compressed-air consumption?
Not directly. A reduction from 1 W to 0.35 W changes electrical holding demand by 0.65 W per energized valve. Air consumption still depends on pressure, flow path, actuator volume, cycle rate, leakage, and blow-off demand. Track coil electricity and compressor energy as separate measurements.
What is a realistic payback period?
There is no universal 12- or 24-month answer. At 100 valves, 0.65 W reduction, 8,760 hours, and $0.10/kWh, direct coil saving is only $56.94 per year. Use the actual installed-cost premium and measured saving, then document any cooling, maintenance, or capacity benefit separately.
Conclusion
Published examples range from Festo’s 1 W-to-0.35 W VUVG option to SMC’s 0.4 W-to-0.1 W JSY configurations, equal to 65% and 75% reductions for those products (Festo, 2026; SMC, 2026). The percentage is the start of the decision.
For plant managers, the disciplined path is straightforward: inventory energized coils, measure real power and duty, calculate direct electricity correctly, screen compatibility, run a representative pilot, and approve the upgrade only when energy, production, maintenance, and safety results all pass. That process produces a defensible investment decision without inflated savings claims.
Sources and Retrieval Notes
- Festo: Solenoid valves VUVG and valve manifold assembly VTUG-S, 1 W standard and 0.35 W with holding-current reduction. Published May 2026; retrieved July 11, 2026.
- SMC: Series 10-S070 3 Port Solenoid Valve, 0.35 W inrush for 100 ms, 0.1 W holding power, voltage tolerance, response, and wiring cautions. Retrieved July 11, 2026.
- SMC: Energy Saving, JSY and SY standard versus power-saving wattage examples. Retrieved July 11, 2026.
- Texas Instruments: DRV110 Solenoid Current Controller, peak-and-hold current-control behavior. Datasheet revised March 2018; retrieved July 11, 2026.
- Texas Instruments: TIDA-00289, tested 24 VDC solenoid current-control reference design and stated power-reduction result. Published November 5, 2014; retrieved July 11, 2026.
- OSHA 1910.147: The Control of Hazardous Energy, stored-energy and lockout/tagout requirements. Retrieved July 11, 2026.