

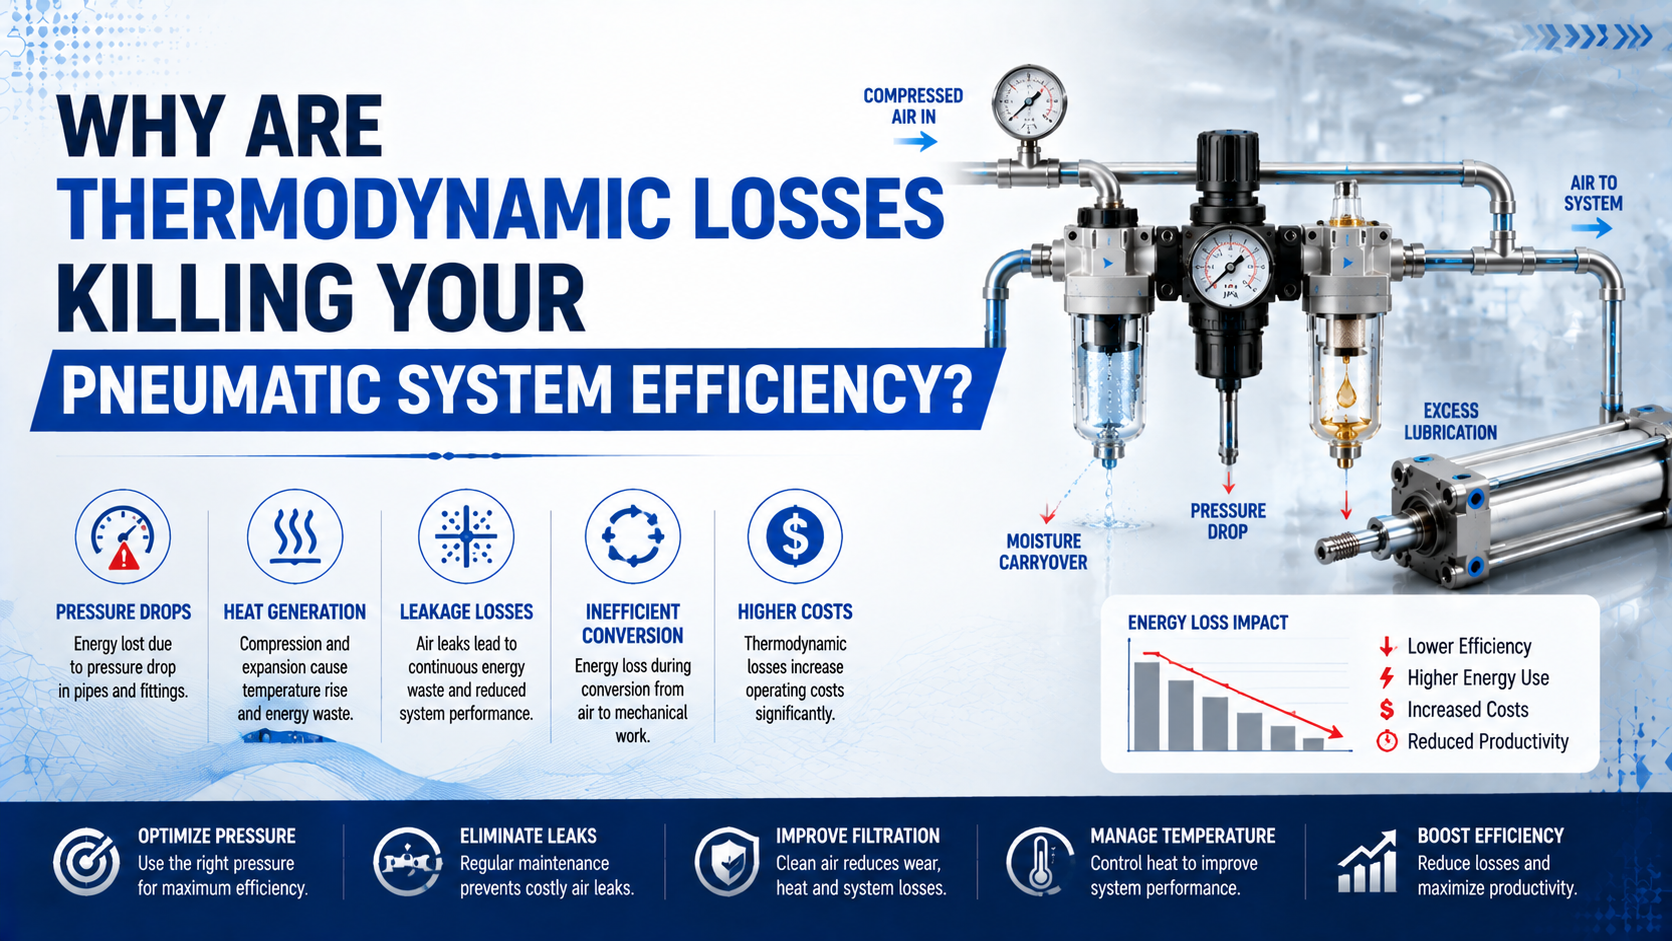
Thermodynamic losses reduce pneumatic system efficiency because electrical energy passes through several irreversible steps before it becomes useful work. Compression rejects heat, treatment consumes power or pressure, regulators throttle air, dead volumes fill, and pressurized exhaust is discharged. Cylinder-wall heat transfer and condensate are not fixed percentage losses by themselves.
Cold exhaust and a warm cylinder do not identify the largest loss. Define the boundary, synchronize measurements, and separate lost work potential from recoverable heat and reliability risks.
Key Takeaways
- DOE reports that 80-93% of compressor electrical input becomes heat.
- Cylinder heat flow has no universal loss percentage.
- A valve-fed chamber changes mass and volume, so one expansion equation is insufficient.
- Synchronize electrical power, normalized flow, boundary pressures, useful work, temperature, and dew point over the same production interval before comparing any proposed changes.
For plant-wide priorities, see the pneumatic energy-conversion guide. This article asks a narrower question: which effects are genuine thermodynamic losses, and what evidence locates them?
Where Does the Input Energy Actually Go?
DOE reports that 80-93% of an industrial air compressor’s electrical input becomes heat, while properly designed recovery equipment can reuse 50-90% of that thermal energy (DOE Compressed Air Sourcebook, accessed 2026-07-27). The audit must therefore begin before the cylinder. Thermodynamic system boundaries define which equipment, energy flows, and operating interval belong in an efficiency calculation. Moving the boundary changes the answer because compressor, distribution, and actuator efficiency are not interchangeable.
| Boundary | Input | Useful output | Losses or penalties included |
|---|---|---|---|
| Compressor package | Electrical energy | Delivered compressed-air energy | motor, compression, cooling, controls, unload operation |
| Distribution network | Air entering the header | Air reaching the machine | leaks, pressure drop, drains, storage and treatment penalties |
| Machine branch | Air and allocated electrical energy | Motion and process work | regulators, valves, tubing, dead volumes, exhaust and friction |
| Actuator | Chamber air energy | Load work at the mechanism | exhaust state, leakage, friction, cushioning and unused pressure |
Do not add percentages from different rows. The DOE heat figure and an actuator exergy result may overlap. Treating them as separate losses would count the same input twice.
Assigning a percentage before defining the boundary is the most common accounting error. Heat, pressure drop, condensation, and exhaust can all matter. Only synchronized input and output measurements show their effect on electrical demand and useful work.
Why Is Heat Transfer Not Automatically a Loss?
DOE says 50-90% of available compressor heat can be recovered in suitable applications, which proves that heat leaving one control volume may become useful energy in another (DOE Compressed Air Sourcebook, accessed 2026-07-27). Heat flow needs a direction, boundary, and practical consequence before it is called a loss. Cylinder walls can reject heat after rapid filling and return heat to cooler chamber air during expansion or dwell; the direction may reverse within one cycle. Aluminum conductivity alone cannot predict the result because gas-side convection, wall geometry, mounting conduction, cycle time, and temperature history affect the heat rate. Simple slab conduction also assumes steady, one-dimensional flow and known surface temperatures. An installed actuator adds curved geometry, boundary films, changing volume, and changing gas mass.
This is why insulating a cylinder is not an automatic efficiency upgrade. Insulation may reduce an unwanted environmental heat load, but it can also slow temperature equalization or keep seals and lubricant hotter. Diagnose the source first with the heat-transfer boundary guide.
Ask a practical question: did the proposed thermal change reduce measured compressor energy for the same production output without violating component temperature limits? If that comparison is missing, the result is a temperature observation, not an energy-saving claim.
A Valve-Fed Cylinder Is an Open, Transient System
Researchers in 2023 modeled pneumatic-motor chambers with changing volume, heat transfer, inlet and outlet mass flow, and energy conservation, then tested operation across 2-8 bar (Energies, accessed 2026-07-27). A working pneumatic cylinder requires the same open-system terms while a valve is flowing.
The control-volume energy balance is:
Here, is chamber air mass, is specific internal energy, is heat transferred into the chamber air, is absolute chamber pressure, and is chamber volume. The mass-flow terms use inlet and outlet enthalpy . Positive boundary work leaves the chamber through piston motion under this sign convention.
Isentropic temperature-pressure relationships apply only to a fixed ideal-gas mass undergoing a reversible adiabatic process. They also require absolute pressure and temperature. A chamber connected to a supply or exhaust valve violates the fixed-mass assumption during flow, so the equation cannot predict a universal 50-70°C temperature drop.
Temperature still matters. It affects density, mass stored in dead volume, pressure response, moisture behavior, seals, lubricant, sensors, and material limits. It does not create a universal force correction such as “3.5% per 10°C.” Cylinder force at an instant depends primarily on both chamber pressures, effective areas, friction, and the external load.
Use the detailed adiabatic versus isothermal cylinder guide for model limits and chamber equations. The measurement method below is more direct when the task is locating plant energy waste.
Which Losses Destroy Available Work at the Point of Use?
One 2023 exergy study analyzed a 63 mm bore, 500 mm stroke cylinder moving 120 kg at 6.3 bar gauge. In its classical configuration, only 6.7% of 5,186 J input exergy became mechanical work; about 46% went to dead-volume effects and more than 40% left through the exhaust path (Energy, 2023). These are case-specific diagnostic results, not default percentages. They show why bore oversizing, long tubing, valve cavities, full-stroke pressurization, and high exhaust pressure can dominate an actuator-level balance. Exergy is the portion of energy that can become useful work relative to a stated environment. Energy is conserved, but irreversible throttling, mixing, friction, and pressure drop destroy exergy; exhaust air can carry it outside the selected boundary.
| Mechanism | What happens | Evidence to collect | Typical correction boundary |
|---|---|---|---|
| Pressure throttling | Available pressure is destroyed across a restriction | dynamic pressure before and after the device | regulator, valve, fitting or tubing |
| Dead-volume charging | Tubing and valve cavities fill and vent every cycle | internal volume, pressure trace and cycle count | shorten or resize the branch |
| Oversized actuator | More air is admitted than the load requires | load, bore, pressure and safety factor | resize or reduce pressure with validation |
| Residual exhaust pressure | Pressurized air leaves before doing more work | chamber and exhaust pressure traces | expansion control or recovery concept |
| Leakage | Air flows without producing commanded work | off-cycle flow and isolation test | repair seals, fittings or valves |
| Friction and impact | Mechanical energy becomes heat and vibration | force, position, speed and stop energy | guidance, alignment, cushioning |
Do not lower pressure at random. A local regulator can reduce air consumption, yet it also creates throttling loss and may slow the actuator. Verify load margin, minimum dynamic pressure, stroke time, cushioning, and safe failure behavior. The pressure-drop troubleshooting guide and compressed-air pipe-sizing guide cover those separate checks.
Does Condensate Belong in the Efficiency Calculation?
Parker’s drying guide compresses an illustrative 8 ft³ intake to 1 ft³ at 100 psig, then shows an aftercooler reducing its water content from 2.1 g to 0.6 g, a 75% reduction in that example (Parker Drying Compressed Air, accessed 2026-07-27). It does not assign condensation a universal efficiency percentage. Condensate appears when air cools below its pressure dew point. Corrosion, lubricant displacement, sticking, freezing, contamination, and maintenance are reliability and quality costs, not proof that water consumed a fixed share of compressor energy. Drying also has penalties: electrical power, purge air, filter pressure drop, or drain loss. A valid comparison includes those costs and the avoided risk.
Separate three questions:
- Will water condense? Compare pressure dew point with the coldest expected temperature.
- What is the damage risk? Inspect materials, lubricant, contamination limits, exposure time, freezing risk, and whether a wet surface can contact the product.
- What does treatment cost? Measure dryer power or purge demand, filter pressure drop, drain loss, maintenance hours, and any purchased energy displaced by heat recovery during the same interval.
Use the pressure dew-point selection guide for moisture specifications. If corrosion is already present, the pneumatic cylinder water-damage guide separates wet supply air from external ingress.
How Should Engineers Measure Thermodynamic Efficiency?
An ORNL-supported 2025 review places efficiency near 15% when judged by energy delivered from compressed air. It also stresses that flow-measurement error directly affects project economics (ORNL, 2025). Reliable diagnosis requires synchronized power, flow, pressure, and output data.
Define system efficiency as:
is dimensionless, is the mechanical work that actually advances the process, and is allocated electrical energy for the compressed-air equipment serving the same interval. Use joules for both terms or convert both to kWh before dividing.
For a linear actuator, useful work over a segment is load force integrated over useful displacement. Do not count unloaded return travel, impact, internal cushioning, or motion that does not advance production as useful output unless the process specifically requires it.
Record at least these channels against one clock:
| Channel | Minimum data | Why synchronization matters |
|---|---|---|
| Compressor electrical input | kW, loaded/unloaded state and time | separates production demand from idle power |
| Branch air demand | normalized flow, duty cycle and off-cycle flow | connects machine activity to compressor demand |
| Dynamic pressure | header, machine inlet, valve outlet and both chambers | identifies throttling and pressure collapse during motion |
| Mechanical output | force or torque, position, speed and cycle count | calculates useful work instead of assuming it |
| Thermal condition | supply, surface and local ambient temperature | distinguishes transient temperature from chronic heat load |
| Moisture condition | pressure dew point and sampling location | predicts condensation without guessing from ambient humidity |
In our experience reviewing pneumatic energy complaints, a synchronized trend usually changes the first diagnosis. A hot surface may be normal heat rejection, while the actual waste is off-cycle flow. A cold exhaust may attract attention, while an oversized cylinder and long tube volume consume far more air.
Correct Losses in Evidence Order
In the 2023 exergy study, the oversized test configuration saved almost 50% through pressure reduction and about 75% through intermittent supply (Energy, 2023). These results support testing load-matched controls, but do not guarantee savings on another machine.
Start with actions that remove demand without changing required work:
- Stop leaks, open blowing, failed drains, and excess purge.
- Confirm the complete load profile, useful stroke, required cycle time, impact energy, and actuator safety margin before changing hardware.
- Shorten tubing and position the valve to reduce dead volume.
- Remove measured restrictions instead of raising compressor pressure.
- Test the lowest pressure that still meets force, motion time, cushioning, restart behavior, and every required safe-state condition under the worst credible load.
- Evaluate early supply cutoff, back-pressure use, or exhaust recovery only after validating dynamic pressure, motion stability, and control response.
- Match treatment to the actual dew-point and contamination limit.
- Recover compressor heat only when a stable heat sink, compatible temperature level, operating schedule, and seasonal demand produce a measured net benefit.
| Proposed change | Baseline to capture | Acceptance condition |
|---|---|---|
| Lower branch pressure | flow, cycle time, load, minimum chamber pressure | same production and safe load margin |
| Resize cylinder | load profile, stroke, mounting, impact energy | required force and life at measured pressure |
| Shorten tubing | volume, flow, valve position, response time | stable motion with maintainable installation |
| Change dryer setting | dew point, purge or power, filter drop | required air quality at lower total penalty |
| Recover exhaust | exhaust pressure and timing, back pressure, controls | useful recovered energy without motion risk |
| Recover compressor heat | available heat, temperature level, heat-sink demand | displaced purchased energy exceeds added fan or pump power |
Large temperature differences do not automatically identify the best thermodynamic project. Prefer the change that removes the most electrical input per unit of verified production while preserving force, cycle time, air quality, reliability, and safe failure behavior.
Document the compressor state, product count, machine recipe, ambient condition, and measurement uncertainty with every comparison. If the project changes several variables at once, the result may show improvement without proving which change caused it.
For broader system prioritization, return to the compressed-air efficiency guide. Publisher context is available on About Bepto, and engineers can submit load, flow, pressure, and timing evidence through Contact.
Pneumatic Thermodynamic Loss FAQs
ORNL’s 2025 review places compressed-air efficiency near 15% when judged by delivered air energy. That system-level reference is not a correction factor for every actuator (ORNL, 2025).
Is all heat produced by an air compressor wasted?
No. DOE reports that 80-93% of compressor electrical input becomes heat and that suitable systems may recover 50-90% of it. Recovery must still provide a verified net benefit after auxiliary power.
Does cold exhaust prove that a pneumatic actuator is inefficient?
No. Cold exhaust proves that the air’s state changed during expansion and discharge, not how much electricity was wasted. Compare synchronized power, flow, pressure, useful work, and exhaust data before assigning a cause.
Can I use the adiabatic temperature equation for a powered cylinder stroke?
Not by itself. The isentropic relationship describes a fixed mass undergoing reversible adiabatic change. A valve-fed chamber changes mass and volume while transferring heat, so the full stroke needs mass and energy balances.
Is condensate a fixed percentage energy loss?
No. Condensate proves that air cooled below its pressure dew point. Quantify treatment through dryer power or purge demand, filter pressure drop, and drain loss; assess water damage separately.
What should I measure first in a pneumatic efficiency audit?
Start with compressor power, normalized branch flow, production count, and dynamic pressure over one interval. Add actuator force or torque, position, temperature, and pressure dew point only as the diagnosis requires.