

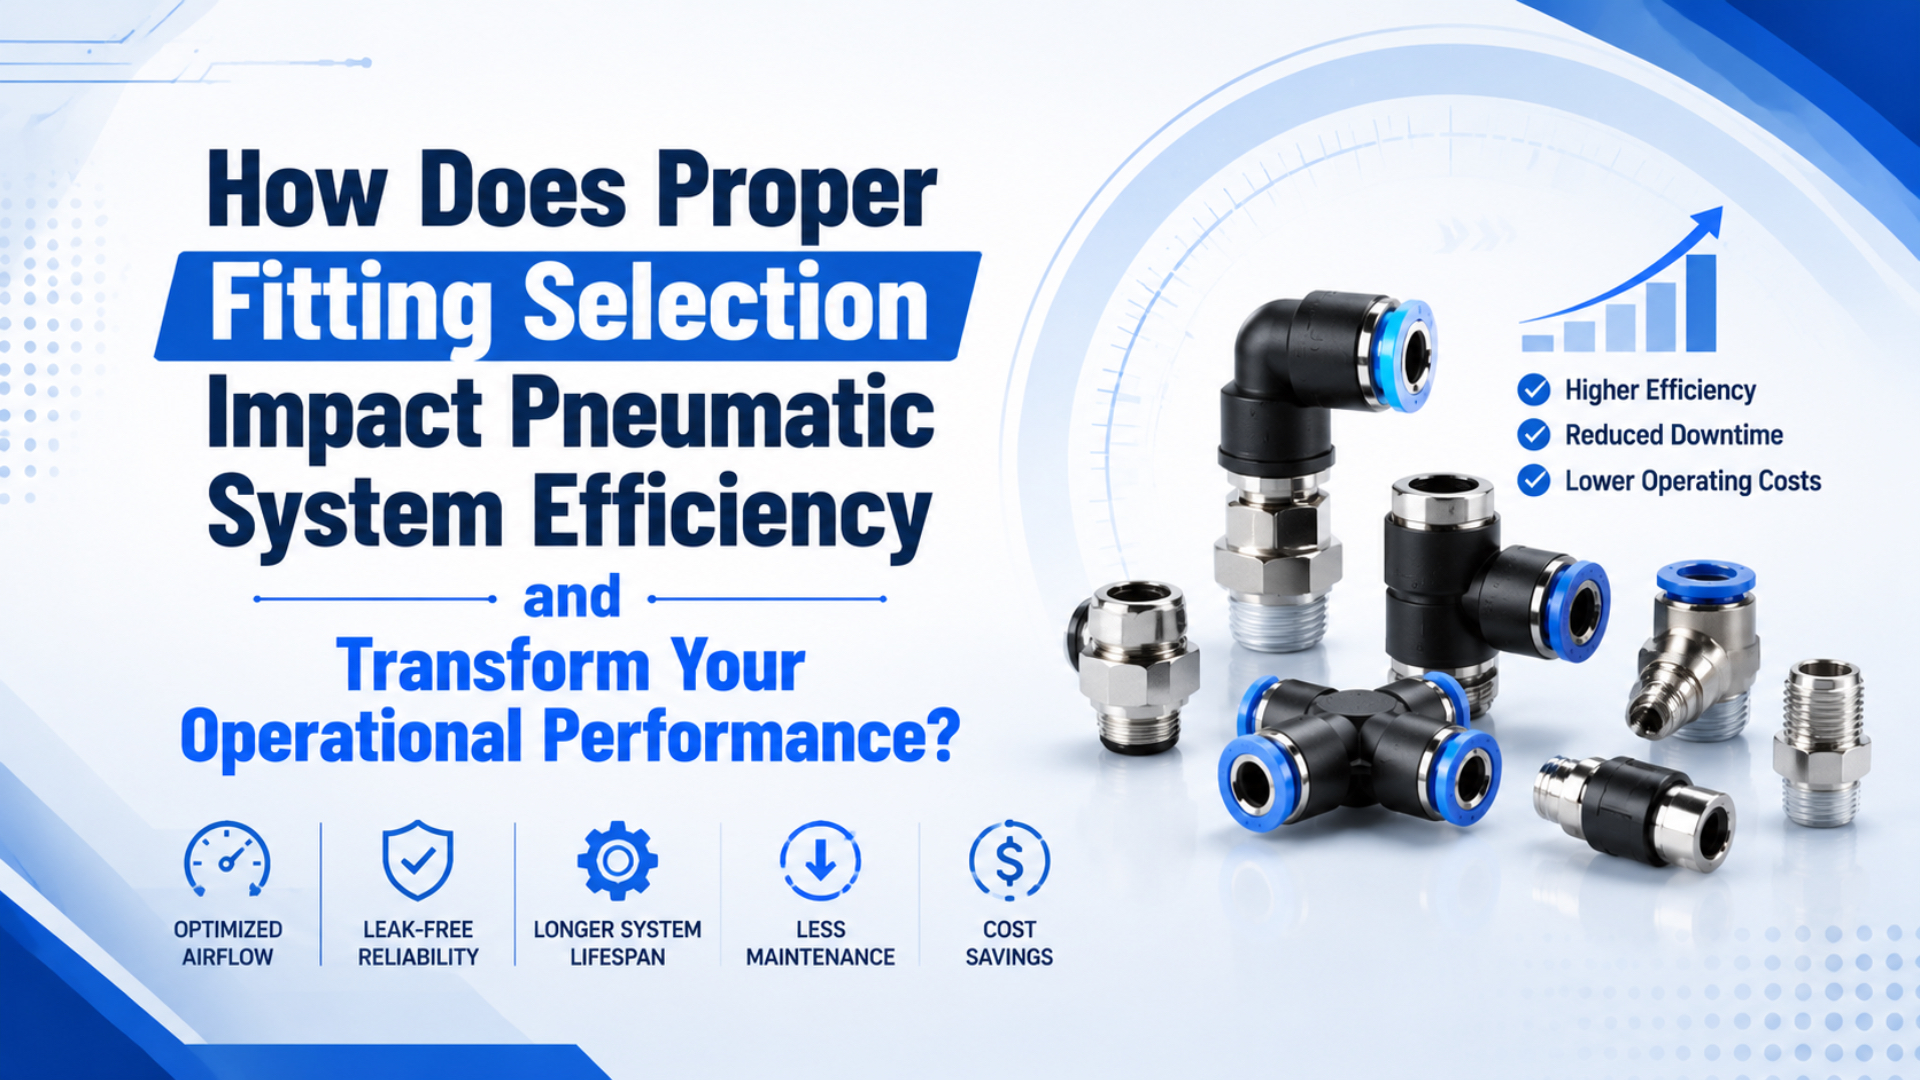
Proper pneumatic fitting selection improves efficiency when it removes a measured restriction, preserves dynamic pressure at the machine, or lets the plant lower an unnecessarily high pressure setting. It does not guarantee a fixed percentage of energy savings. The result depends on peak flow, internal passage size, fitting geometry, tubing, downstream demand, and compressor controls.
The U.S. Department of Energy recommends a pressure loss well below 10% from the receiver outlet to the point of use. It also warns that restrictions in hoses, tubes, disconnects, filters, regulators, and lubricators are common point-of-use problems (DOE Compressed Air Sourcebook, 2003). A fitting matters when its contribution is large enough to change the operating result.
Key Takeaways
- DOE recommends keeping receiver-to-use pressure loss well below 10%.
- Compare internal flow data, not tube OD or thread size alone.
- ISO 6358 addresses pneumatic component flow with compressible fluids.
- Measure pressure during peak demand before changing hardware.
- Energy savings require a verified reduction in compressor or system pressure.
How Do Fittings Affect Pneumatic System Efficiency?
DOE identifies undersized hoses, tubes, disconnects, filters, regulators, and lubricators among the highest point-of-use pressure-drop risks. It recommends selecting components at the system’s highest flow and temperature, when pressure loss will be greatest (DOE Compressed Air Sourcebook, 2003). Fittings belong inside that same dynamic review.
A pneumatic fitting affects efficiency through its smallest internal passage, changes in direction, local contractions, sealing geometry, and any valve mechanism inside a quick coupling. Each restriction converts some upstream pressure into turbulence, heat, and velocity. The effect grows as flow rises.
Dynamic pressure is the pressure available while the machine is consuming air. A gauge may show 6.5 bar while the actuator is idle and fall to 5.2 bar during a fast stroke. The lower number governs available force and flow during that event.
This explains why a fitting can have little effect on a slow clamp but become a bottleneck on a cylinder that must fill within 200 ms. The thread matches. The tube fits. Neither fact proves that the complete flow path supports the required mass flow.
What should you look for first? Find the narrowest repeated restriction between the branch supply and the actuator, including fittings, tube inserts, manifolds, valve ports, silencers, and quick couplings. The article on pneumatic pressure-drop causes provides the wider troubleshooting boundary.
One restrictive fitting rarely explains an entire plant’s energy bill. Several identical restrictions on a high-duty machine can still matter because operators often compensate by raising a regulator or compressor setpoint. The energy penalty comes from that pressure response, not from the fitting label itself.
Pneumatic Fitting Flow Data That Matters
For example, with 8 mm tubing and a Uni 1/4 connection, SMC lists 26.1 mm2 effective area with nylon tube for its KQ2H straight connector and 21.6 mm2 for its KQ2L elbow. With urethane tube, the values are 18.0 and 14.9 mm2 (SMC KQ2 catalog, accessed 2026).
Those figures are model-specific, but they demonstrate two useful rules. First, the same tube outside diameter and thread do not guarantee the same flow capacity. Second, the tube material can change the published effective area for the same fitting body.
Compare these catalog fields when available:
| Catalog field | What it tells you | What to verify |
|---|---|---|
| Tube outside diameter | Which tube can be retained and sealed | Actual tube inside diameter and wall thickness |
| Minimum port size | Smallest stated internal opening | Whether another internal feature is more restrictive |
| Effective area | A flow-capacity representation in mm2 | Test method, tube material, and exact model |
| Sonic conductance, C | Choked-flow conductance under ISO 6358 conventions | Units, reference conditions, and upstream pressure |
| Critical pressure ratio, b | Boundary between subsonic and choked behavior | Component-specific tested value |
| Nominal flow, Qn | Flow at the supplier’s stated conditions | Inlet pressure, outlet pressure or pressure drop, temperature, and reference state |
| Pressure-flow curve | Expected flow across a range of pressure ratios | Whether the curve includes the tube and connector assembly |
ISO 6358-1 specifies steady-state test methods for pneumatic components with fixed or variable internal flow passages using gases. ISO 6358-2 provides alternative charge and discharge test methods, while ISO 6358-3 estimates system characteristics when the individual component and piping characteristics are known (ISO 6358-1; ISO 6358-2; ISO 6358-3).
The strongest request to a supplier is not “Is this high-flow?” Ask for the exact model’s tested C and b values, effective area, nominal flow conditions, or a pressure-flow curve. If the catalog publishes none of them, mark the capacity as unknown.
Why Can’t a Liquid Cv Shortcut Size a Compressed-Air Fitting?
ISO 6358-3 explicitly models both subsonic and choked flow through pneumatic components and combines components whose flow characteristics are already known (ISO 6358-3, confirmed 2025). That is why compressed-air fitting selection cannot rely on a liquid-style equation using only Cv, pressure difference, and specific gravity.
Cv is historically defined from water flow at a stated pressure drop. Pneumatic catalogs may publish Cv as a convenient comparison value, but gas flow also depends on upstream absolute pressure, downstream pressure, temperature, gas properties, and whether the flow has choked. There is no universal Cv × constant = SCFM conversion valid across all pressure ratios.
The familiar ideal-gas critical pressure ratio near 0.528 applies to a specific idealized converging-nozzle model for air. A real connector’s critical ratio depends on its tested flow behavior. ISO 6358 represents that boundary with the component parameter b; do not assign every fitting the same value.
Does this make Cv useless? No. It can still compare components when the same supplier uses the same test basis and provides the operating conditions. It should not replace a compressible-flow curve or ISO 6358 data. The separate guide to Cv and pneumatic valve sizing explains where Cv remains useful for valve selection.
A false sense of accuracy is more dangerous than a missing number. If a fitting catalog gives only tube OD and thread size, a precise SCFM result calculated from an assumed Cv is still an assumption. Measure the branch or obtain supplier data before committing to a cycle-time guarantee.
How Do Straight, Elbow, Y, Reducer, and Quick-Coupling Designs Differ?
Parker lists 550 L/min for one Series 21 single-shutoff coupling and 310 L/min for the corresponding double-shutoff version, both at 6 bar inlet pressure and 0.5 bar pressure drop (Parker Legris Rectus catalogue, accessed 2026). The connection size alone cannot reveal that internal-valve difference.
Geometry changes the flow path, but no universal percentage can be assigned to each fitting style. A well-designed elbow may outperform a poor straight connector with a smaller internal throat. Compare the exact part numbers.
| Fitting type | Main design reason | Potential restriction | Evidence to request |
|---|---|---|---|
| Straight connector | Direct tube-to-port connection | Small threaded throat or tube support | Minimum port, effective area, C and b, or flow curve |
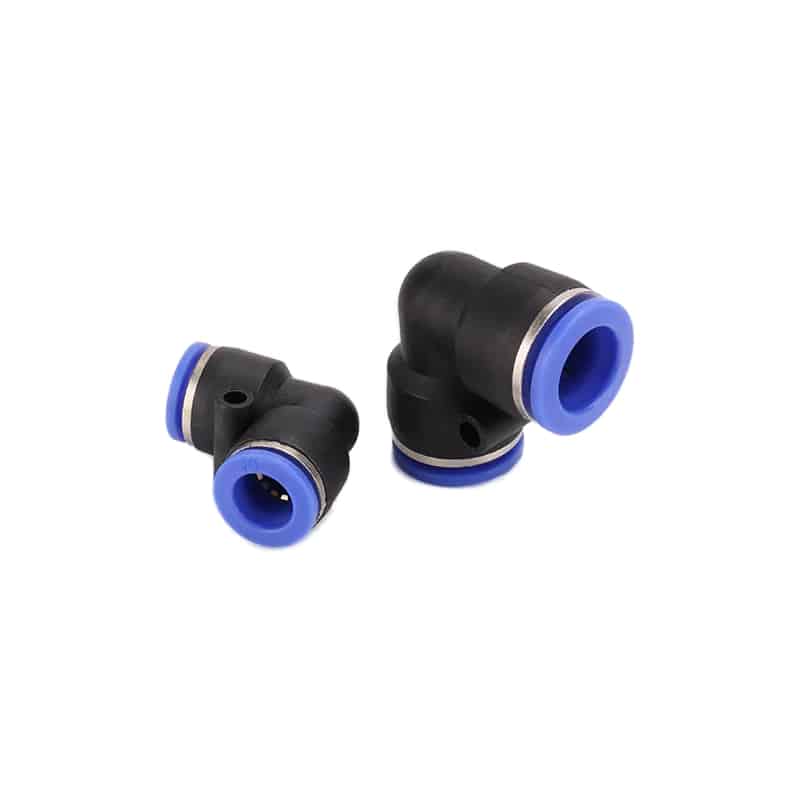
| Elbow | Change direction in limited space | Turn plus local contraction | Same-model comparison with straight version |
| Tee or Y | Split one supply into branches | Shared inlet and unequal simultaneous demand | Inlet capacity, branch capacity, and test orientation |
| Reducer | Join different tube sizes | Smaller outlet controls capacity | Actual IDs and full assembly flow data |
| Banjo or swivel elbow | Allow adjustable port direction | Compact rotating passage | Tested flow plus locking and sealing limits |
| Quick coupling | Frequent disconnection | Internal shutoff valve and plug profile | Flow at stated inlet pressure and pressure drop |
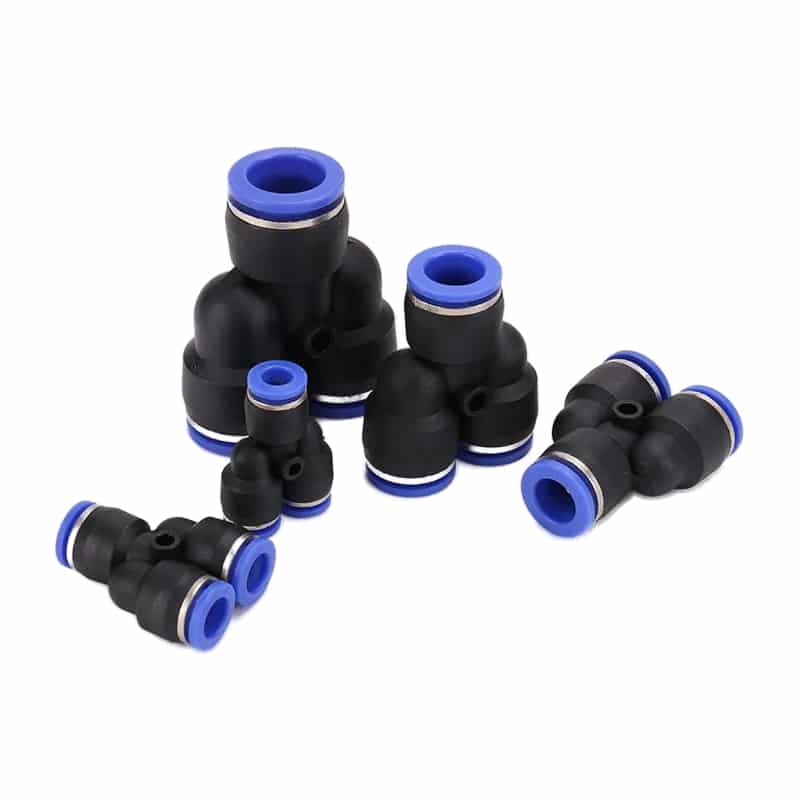
A Y fitting creates another design question: will both branches demand peak flow at the same time? If so, size the common inlet for the combined event and verify that branch pressure stays acceptable. If the motions are sequenced, the simultaneous requirement may be lower.
Quick couplings deserve special attention because their internal valves can create more restriction than a plain connector. Selection must also include safe venting, accidental-disconnection risk, connection frequency, residual pressure, and plug compatibility. A “full-flow” marketing label is not a substitute for a stated test point.
Fitting location matters too. Long valve-to-cylinder tubing adds volume and delays pressure response even when the fittings pass enough steady-state flow. Review valve placement when the problem is response time rather than steady pressure alone.
How Should You Measure Fitting Restrictions?
DOE says the maximum supply-to-point-of-use pressure drop occurs at the highest compressed-air flow and temperature. It recommends requesting component pressure-drop data under those conditions rather than relying on idle readings (DOE Compressed Air Sourcebook, 2003). Test the machine during its worst simultaneous demand.
Use this measurement sequence:
- Record the symptom, cycle step, required pressure, stroke time, peak flow estimate, regulator setting, tube OD and ID, and every fitting model in the path.
- Inspect for leakage, kinked tube, incomplete insertion, contamination, damaged seals, clogged silencers, and partially open isolation valves.
- Install suitable pressure sensors immediately upstream and downstream of the suspected restriction, using ports and instruments that do not create a new bottleneck.
- Capture both pressures during the actual event. A static gauge observation is not enough for a 200 ms stroke.
- Repeat the measurement during the highest simultaneous machine demand.
- If safe and approved, change one component at a time and repeat the same cycle, load, pressure, and temperature conditions.
- Compare dynamic pressure, cycle time, end-of-stroke margin, and compressor or regulator setpoint before and after the change.
What result identifies the bottleneck? A repeatable pressure difference across the fitting during the failing event, followed by a measurable improvement after replacing that restriction without changing other variables.
The pressure difference must be interpreted in context. A 0.2 bar drop may be unacceptable on a low-pressure precision circuit and irrelevant on another machine with ample margin. The component manufacturer and machine risk assessment define the allowable point-of-use pressure.
In our experience, the most misleading test is an idle regulator reading. It tells us the static supply setting, not what reaches the valve or cylinder during peak flow. We review time-aligned upstream pressure, downstream pressure, and machine-cycle data before recommending a larger fitting.
For system-level isolation, follow the broader compressed-air pressure-drop diagnostic process. If the measured loss is mainly across the directional valve, use the dedicated valve pressure-drop guide instead of attributing it to nearby connectors.
How Does Pneumatic Fitting Selection Balance Flow and Reliability?
ISO 14743:2020 covers complete push-in connector assemblies for thermoplastic tubes with outside diameters from 3 to 16 mm. It establishes uniform design and performance test methods but excludes air-braking systems (ISO 14743, 2020). Flow capacity is only one part of a compliant application selection.
Work through these checks in order:
1. Define the Flow Event
Use the peak simultaneous free-air demand, minimum inlet pressure, permitted pressure drop, and required response time. Average compressor flow can hide a short, high-demand cylinder stroke. If demand is not yet known, estimate the connected actuator and blow-off loads before comparing fittings.
2. Match Tube OD, Actual ID, and Material
Push-in fitting names normally use tube outside diameter. Flow area depends on inside diameter, which changes with wall thickness. Tube material and hardness also affect sealing, retention, bend radius, temperature, and sometimes the supplier’s published effective area.
Use the Tube ID Calculator for an initial velocity-based tube check, then verify the selected tube and fitting combination in the manufacturer’s documentation. The result cannot replace a fitting flow test.
3. Verify the Exact Port and Flow Data
A 10 mm tube attached to a 1/8-inch port may still be limited by the threaded throat. Check the exact combination of tube size, thread, fitting shape, seal method, and tube material. Compare C and b, effective area, or a flow curve under matched conditions.
4. Match Pressure, Temperature, Fluid, and Environment
Festo’s QS documentation, for example, separates pressure limits by product variant and temperature while identifying compatible media, seal types, tightening torque, tube insertion depth, and corrosion-resistance class (Festo QS, 2026). That is the level of model-specific detail a fitting selection needs.
Material choice protects reliability; it doesn’t automatically increase flow. Polymer, nickel-plated brass, stainless steel, and other constructions serve different temperature, corrosion, washdown, chemical, cleanliness, and mechanical requirements. For aggressive environments, use the separate stainless-steel pneumatic fitting guide.
5. Check Installation and Service Conditions
Confirm the specified tightening method, tube cut quality, insertion depth, pull check, bend radius, side load, orientation, accessibility, and replacement part. Don’t apply thread sealant where a product uses a gasket, face seal, or pre-coated thread unless the manufacturer permits it.
The safest fitting is not always the one with the largest passage. Stored energy, accidental tube release, whipping, hot surfaces, chemical exposure, and maintenance access remain part of the decision. ISO 4414 addresses general rules and significant hazards for pneumatic systems used on machinery (ISO 4414, 2010).
When Does Better Fitting Selection Reduce Energy Cost?
For systems near 100 psig, DOE gives a rule of thumb that each 2 psi increase in compressor discharge pressure raises full-output energy consumption by about 1%. It also notes an additional artificial-demand penalty when unregulated uses consume more air at higher pressure (DOE Compressed Air Sourcebook, 2003).
The energy chain must be complete:
Restrictive fitting or connector
        ↓
Measured dynamic pressure loss
        ↓
Plant raises regulator or compressor pressure to compensate
        ↓
Restriction is corrected and required point-of-use pressure is maintained
        ↓
Higher setpoint is safely reduced
        ↓
Compressor power, flow, and production are measured again
Suppose verified fitting and tubing changes let a plant reduce compressor discharge pressure by 4 psi while maintaining production. DOE’s rule of thumb suggests roughly a 2% full-output energy reduction near 100 psig, before considering control behavior or artificial demand. This is a transparent screening estimate, not a promised project result.
What if the local pressure improves but the compressor setpoint never changes? The machine may cycle faster or run more reliably, yet compressor energy might not fall measurably. A load/unload compressor, variable-speed compressor, and sequenced multi-compressor plant will respond differently.
Use measured compressor package power, delivered flow, production output, pressure, and operating hours for the final calculation. The compressed-air system design guide explains how demand, pressure, storage, distribution, treatment, and controls interact.
The calculator below screens pipe and tube pressure drop from flow, length, equivalent fitting length, inside diameter, and working pressure. Use manufacturer flow data or measured differential pressure for the individual fitting.
No fixed 20%, 30%, or 40% fitting savings claim is credible without that before-and-after evidence. The business case may also include fewer cycle faults, less scrap, lower maintenance time, or restored production capacity, but keep those benefits separate from compressor energy.
Commissioning and Maintenance Checks
ISO 4414 applies pneumatic-system safety principles to design, construction, modification, installation, adjustment, uninterrupted operation, maintenance, reliability, energy efficiency, and environment (ISO 4414, 2010). A fitting change is complete only after the connection, machine function, hazardous-energy controls, and measured operating result have been verified.
Before returning the machine to production:
- confirm the correct fitting, tube, seal, and thread specification;
- verify tube insertion and mechanical retention using the manufacturer’s procedure;
- inspect for side load, abrasion, excessive bend, heat, vibration, and chemical exposure;
- perform the approved leak test at operating pressure;
- record upstream and downstream dynamic pressure during peak flow;
- confirm actuator speed, force margin, cushioning, and fault behavior;
- verify that isolation, exhaust, and restart work as intended;
- document the final compressor and regulator settings.
Never disconnect a pressurized tube merely to test whether a fitting releases. Isolate the energy source, lock out according to the machine procedure, vent stored pressure, restrain gravity or spring loads, and confirm zero-energy state before service.
During maintenance, trend the symptom instead of changing every connector by appearance. A fitting can leak because of a scratched tube, poor cut, incompatible material, damaged collet, wrong seal, excessive side load, or repeated reconnection. Replacing only the body may leave the cause in place.
When a flow problem appears after a machine modification, compare the new simultaneous demand, tube length, valve placement, manifold capacity, and exhaust path. The fitting closest to the slow cylinder is not automatically the restrictive component. Choked-flow behavior elsewhere can cap mass flow, so the complete supply and exhaust path still needs diagnosis.
FAQs About Pneumatic Fitting Selection and Efficiency
SMC’s 8 mm, Uni 1/4 example lists 26.1 mm2 effective area for a straight KQ2H connector and 21.6 mm2 for a KQ2L elbow with nylon tube (SMC KQ2, accessed 2026). These FAQs therefore focus on model-specific evidence rather than universal fitting percentages.
Do elbow fittings always cause unacceptable pressure drop?
No. An elbow usually introduces a turn and may have less effective area than the comparable straight model, but the result depends on the exact design and operating point. Compare tested flow data for both part numbers, then measure dynamic pressure if the application is sensitive to cycle time or force.
Should a fitting port always match the component’s thread size?
The thread must be mechanically compatible, but matching thread labels do not prove flow capacity. Check the minimum internal port, tube ID, effective area or ISO 6358 data, seal method, pressure rating, and available installation space. A larger thread can still contain a smaller internal restriction.
How much energy can higher-flow fittings save?
There is no universal percentage. Near 100 psig, DOE estimates about 1% more full-output energy for each additional 2 psi of compressor discharge pressure. A fitting change creates energy savings only when it removes verified pressure loss and allows a safe reduction in system pressure or compressor demand.
Is Cv enough to compare pneumatic fittings?
Cv can support a comparison when both suppliers state compatible test conditions, but it isn’t enough for final compressed-air sizing. Ask for upstream and downstream pressure, temperature, reference flow conditions, and choked-flow behavior. ISO 6358 C and b values or a complete pressure-flow curve are more explicit pneumatic data.
What fitting information should an RFQ include?
Include tube OD, actual ID and material; thread and seal type; fluid; minimum and maximum pressure; temperature; environment; peak flow; permitted pressure drop; fitting geometry; required flow data; applicable ISO 14743 evidence; quantity; drawings; and the measurement point used for final acceptance. Send missing model data through the technical contact page.
Proper fitting selection improves operational performance when it is treated as an engineering boundary, not a catalog-size shortcut. Match the full assembly, compare compressible-flow data, test at peak demand, and connect any energy claim to a verified pressure reduction. That approach protects cycle time, reliability, and compressor efficiency without promising savings the system cannot deliver.
External technical references and retrieval dates
- U.S. Department of Energy, Improving Compressed Air System Performance: Point-of-use pressure-drop causes, less-than-10% system guidance, dynamic operating conditions, and the 2 psi pressure rule of thumb. Retrieved 2026-07-14.
- ISO 6358-1:2013: General rules and steady-state testing of pneumatic component flow characteristics with compressible fluids. Retrieved 2026-07-14.
- ISO 6358-2:2019: Alternative charge and discharge test methods for pneumatic component flow characteristics. Retrieved 2026-07-14.
- ISO 6358-3:2014: Calculation of steady-state subsonic and choked flow characteristics for systems with known component data. Retrieved 2026-07-14.
- ISO 14743:2020: General requirements and performance testing for push-in connectors used with 3-16 mm OD thermoplastic tubes. Retrieved 2026-07-14.
- ISO 4414:2010: General rules and safety requirements for pneumatic fluid-power systems and components on machinery. Retrieved 2026-07-14.
- SMC, KQ2 One-touch Fittings: Model-specific effective area, minimum port, tube-material, thread, and geometry data. Retrieved 2026-07-14.
- Festo, Push-in Fitting QS: Fitting variants, pressure and temperature limits, tube insertion, tightening, materials, and environmental conditions. Retrieved 2026-07-14.
- Parker Legris Rectus Distribution Catalogue: Quick-coupling air-flow ratings at stated inlet pressure and pressure drop. Retrieved 2026-07-14.