

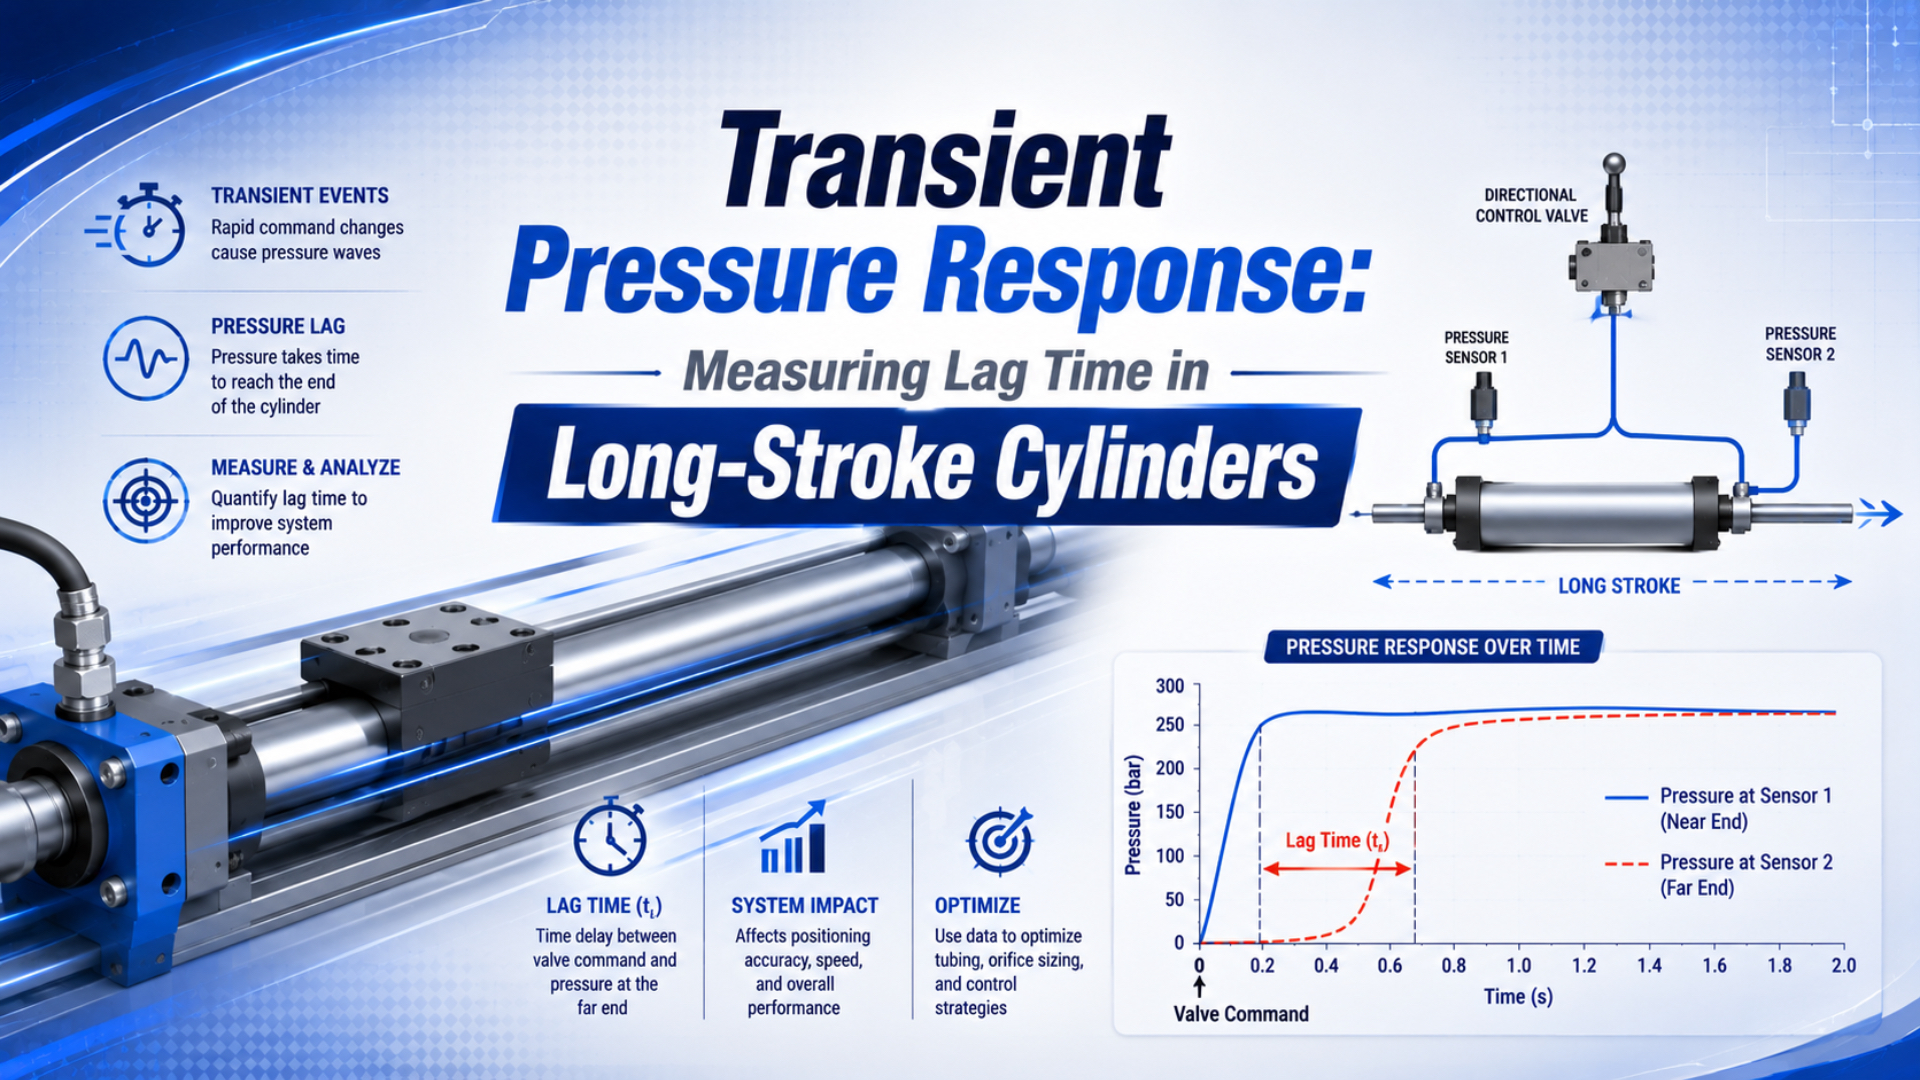
Transient pressure lag is the measured time between two explicitly defined pressure events on a shared clock. It is not the same as valve shifting time, chamber filling time, command-to-first-motion delay, or full-stroke time. A useful long-stroke test records the command, pressure at both ends of the valve-to-cylinder path, both cylinder chamber pressures, and piston position.
This guide concentrates on pressure-transfer measurement. For the broader delay budget, see our analysis of cylinder response time and dead volume. For motion after breakaway, use the separate piston-velocity calculation guide.
Publisher and author information is available on About Us. Send technical corrections or application questions through Contact.
Key Takeaways
- Name the start event, end event, pressure threshold, and filtering before quoting a lag time.
- Use two pressure sensors on the same acquisition clock to measure pressure-transfer delay.
- Treat wave arrival, pressure buildup, piston breakaway, and stroke completion as separate events.
- Choose sample rate from the measurement bandwidth and timing uncertainty, not from a universal rule.
- Long stroke increases swept volume, but initial piston position determines the chamber volume present before motion.
What Exactly Should “Pressure Lag” Mean?
ISO 12238:2023 covers shifting-time tests for electrically and pneumatically operated two- or three-position directional valves. It does not define the response of a complete valve, tube, cylinder, load, and sensor chain (ISO 12238, 2023). Pressure lag therefore needs an event pair, not just a value in milliseconds.
Define the events before connecting the recorder:
| Event | Practical definition | What it includes |
|---|---|---|
| electrical command crosses its stated threshold | controller output and timestamp logic | |
| upstream pressure signal crosses threshold | electrical delay, valve actuation, local fluid response | |
| cylinder-port pressure crosses threshold | upstream effects plus pressure transfer through the connecting path | |
| position changes beyond the validated motion threshold | pneumatic buildup plus load, opposing pressure, and static friction | |
| end-position event occurs | all preceding delay plus acceleration, travel, deceleration, and sensing |
The pressure-transfer interval between sensors A and B is:
Here, is the measured transfer delay, and and are the threshold-crossing times. The thresholds and may be absolute pressures or normalized fractions of each signal’s repeatable pressure step. The report must state which convention was used.
Two tests can produce different values even on the same hardware if one uses first detectable change and the other uses 50% of the pressure step. Noise filtering, sensor delay, timestamp alignment, and hysteresis around the threshold can also move the crossing time.
The most useful distinction is between pressure disturbance arrival and pressure buildup sufficient for motion. The first reveals how quickly the change reaches a location. The second includes the mass flow needed to change pressure in a finite volume. Collapsing both into “air propagation delay” hides the actual bottleneck.
Build a Measurement Chain That Does Not Create Its Own Delay
Pressure sensors can contribute meaningful delay. WIKA notes that response behavior includes dead time, rise time, settling time, and overshoot, with device construction producing response times from a few milliseconds to far longer values (WIKA, accessed 2026). Sensor dynamics must therefore be small and documented relative to the interval being measured.
Use this minimum channel set:
- Valve command or measured coil current.
- Pressure A close to the active valve outlet.
- Pressure B at the cylinder port.
- Pressure at the opposing cylinder chamber.
- Piston position, or a validated first-motion signal.
Record every channel with one acquisition system or clocks that have been independently synchronized and characterized. Two fast sensors connected to unrelated loggers can still produce a poor delay measurement if their timestamps drift or their filters differ.
Place the pressure diaphragm as close to the flow passage as the hardware allows. PCB explains that flush mounting minimizes added cavity volume, while recessed mounting can alter high-frequency response through cavity resonance (PCB Piezotronics, accessed 2026). A long sensing tube, narrow adapter, tee pocket, or trapped branch can make the measured pressure arrive later than the pressure in the main line.
Select a sensor pressure range that covers the expected transient without overload but preserves useful resolution. Check the datasheet for dynamic response, not only static accuracy. A highly accurate static transmitter can still be unsuitable for a short timing event if its internal damping or digital update period is too slow.
How Should Sampling Rate and Thresholds Be Chosen?
Nyquist requires a sampling rate greater than twice the highest frequency of interest, while NI recommends a higher ratio, often about five times, when waveform shape matters (NI, accessed 2026). “Use 1 kHz” is therefore not a complete specification.
Start with the timing uncertainty the test can tolerate. A sample interval of 1 ms places un-interpolated threshold crossings on a 1 ms grid. Increasing the rate can reduce that quantization, but only if the sensor, signal conditioning, analog-to-digital converter, and software path all preserve the required bandwidth.
Then document:
- sampling rate for every channel;
- analog and digital filter type, cutoff, and phase behavior;
- anti-aliasing method;
- sensor update rate and response time;
- trigger source and pre-trigger duration;
- pressure threshold definition;
- motion threshold and position-sensor resolution;
- whether threshold times are interpolated between samples.
Choose thresholds above the measured noise floor and below regions dominated by overshoot or saturation. If runs have different final pressures, a normalized threshold such as 10% or 50% of the stable step may improve comparison, but it also changes the question being answered. A fixed absolute threshold is often better when the engineering requirement is “time to reach breakaway pressure.”
Zero-phase filtering performed offline avoids phase shift but uses future samples, so it is unsuitable for proving the latency of a real-time controller. A causal filter represents online behavior but adds phase delay. Save raw data and report both the raw-channel settings and any post-processing.
In our experience with application reviews, threshold ambiguity causes more disagreements than arithmetic. One report says “pressure appeared,” another says “pressure reached operating level,” and both label the result response time. A one-line event definition usually resolves the apparent conflict.
Pressure-Wave Travel and Chamber Filling Are Different
NASA gives the small-disturbance speed of sound in a calorically perfect gas as , which is about 343 m/s for dry air near 20°C (NASA Glenn Research Center, updated 2021). That value estimates an ideal propagation lower bound, not the time required to pressurize a cylinder chamber.
In these equations, is the small-disturbance wave speed, is the specific-heat ratio, is the specific gas constant, is absolute temperature, is the propagation-path length, and is the idealized travel time. The approximation assumes a known gas state and does not include sensor cavities, reflections, valve dynamics, restricted mass flow, or chamber filling.
A pressure disturbance may reach sensor B quickly while the local pressure continues to rise slowly. The rise rate depends on the mass-flow path, upstream and downstream absolute pressures, temperature, line and chamber volumes, valve characteristics, exhaust restriction, and piston motion.
ISO 6358-1 defines steady-state flow characterization for pneumatic components and explicitly excludes cylinders and other components that exchange energy with the fluid (ISO 6358-1, 2013). A valve’s ISO flow parameters help model the restriction, but they do not by themselves certify transient cylinder lag.
For an initial engineering estimate of a fixed chamber before motion, a pneumatic chamber fill-time calculator can organize volume, pressure, and free-air flow assumptions. Treat its output as a screening calculation. Validate the actual valve, line, temperature, leakage, opposing chamber, and breakaway behavior with a synchronized trace.
Why Is Stroke Length Not a Stand-Alone Lag Predictor?
For a fixed piston area, full-stroke swept volume increases in direct proportion to stroke. Initial delay is different: before motion, the active chamber volume depends on the piston’s starting position, clearance, port passages, and connected line volume. A 2 m nameplate stroke does not prove that the piston starts with 2 m of chamber volume.
For extension, a simple geometry model is:
Here, is active-chamber volume at position , is the clearance and connected volume represented at , and is full piston area. Retraction uses the annular area after subtracting the rod area and its own end clearance.
At , the swept contribution is zero. Near the far end of a long stroke, it can dominate the chamber volume. That is why the same cylinder can show different pressure-rise and first-motion behavior when tested from different starting positions.
A 2026 pneumatic-cylinder experiment measured both chamber pressures and piston position while varying initial position, supply pressure, airflow, load, and cylinder configuration. Its data were acquired every 1.16 ms, but that rate was a choice for that experiment, not a universal requirement (Nguyen Ngoc et al., 2026).
Long-stroke installations often add long tubes, guides, large moving loads, and remote manifolds. Those associated design choices can increase response delay or variability, yet they must be diagnosed individually. See our guide to long-stroke cylinder application constraints and the analysis of air compressibility in cylinder control for the adjacent design questions.
How Do You Run a Repeatable Lag-Time Test?
The 2026 experimental study recorded a common command path, two chamber pressures, piston position, and other derived motion quantities on one acquisition device. That channel discipline is more transferable than its 1.16 ms interval. A production test should likewise control starting state, record raw signals, repeat cycles, and preserve the analysis definition.
- State the test boundary. Choose command-to-port pressure, sensor-A-to-sensor-B pressure transfer, command-to-first-motion, or another explicit event pair.
- Map the pneumatic path. Record tube length and internal diameter, fittings, speed controls, manifolds, silencers, valve model, cylinder bore, rod diameter, stroke, and sensor-port geometry.
- Fix the initial state. Set piston position, supply pressure, regulator setting, load, dwell time, ambient temperature, and both chamber pressures.
- Validate the acquisition chain. Confirm sensor ranges, response specifications, channel synchronization, sample interval, anti-aliasing, filters, and command timestamp.
- Capture both directions. Extension and retraction use different effective areas, volumes, loads, and flow paths. Do not assume symmetry.
- Repeat without hiding spread. Report the number of runs, median or mean as appropriate, minimum, maximum, and a spread measure. Investigate outliers rather than deleting them silently.
- Change one factor at a time. Move sensor B, shorten a tube, bypass a flow control, change initial position, or log supply pressure dynamically. Re-run the same event definition.
Measure supply pressure during the transient, not only before the test. A regulator gauge can look stable while the local manifold pressure collapses during a fast fill. Record the opposing chamber because restricted exhaust can delay force development even when the active chamber rises normally.
If command-to-motion is the requirement, calculate the instantaneous pneumatic force from measured absolute or gauge pressures using a consistent convention. First motion occurs when the net available force exceeds the combined load and breakaway resistance, not at a universal chamber pressure.
What Can the Trace Shape Tell You?
A trace with five synchronized events can separate problems that a stopwatch cannot. If command-to-sensor-A delay changes while stays stable, investigate the electrical and valve region. If sensor A responds consistently but sensor B drifts, inspect the downstream path, local supply, measurement branch, and connected volume.
| Trace observation | Likely region to investigate | Confirming test |
|---|---|---|
| is long; is stable | command output, coil, pilot, valve shift | record coil current; compare with the valve manufacturer’s method |
| A changes sharply; B changes later or more slowly | tube, fitting, flow control, manifold, sensor cavity | move B upstream in stages; document each added volume |
| Both active pressures rise normally; motion remains late | opposing pressure, load, guide alignment, seal breakaway | record opposing chamber and high-resolution position |
| Pressure rise changes with start position | position-dependent chamber volume | repeat at several documented positions |
| Delay increases during repeated cycles | dynamic supply sag, temperature, valve heating, changing friction | log local supply and temperature throughout the sequence |
| B shows ringing not visible at A | sensing branch or pneumatic resonance | compare flush and recessed mounting; shorten the sensing connection |
Do not jump from a slow full-stroke time to a larger valve. First separate pre-motion delay from travel time, then check whether the valve and tubing can pass the required flow using a model-specific calculation. Our solenoid-valve sizing guide explains that adjacent step. For high-flow systems, also inspect pressure drop within the cylinder barrel.
Moving the downstream pressure sensor in stages is a practical localization test. If the measured crossing shifts when only the sensing location changes, the result contains path or mounting effects. If it does not, the dominant delay lies before the moved point or after the pressure threshold.
Report the Measurement So Another Engineer Can Reproduce It
A lag-time report should contain enough information to rebuild both the pneumatic boundary and the signal processing:
- schematic with sensor locations and port connections;
- component model numbers and relevant settings;
- tube lengths and internal diameters;
- cylinder bore, rod, stroke, and initial position;
- supply, exhaust, ambient, load, and dwell conditions;
- sensor ranges, response specifications, and mounting details;
- sample rate, clock arrangement, filters, and interpolation;
- exact event and threshold definitions;
- raw traces plus processed traces;
- cycle count, central result, spread, and rejected-run rationale;
- measurement uncertainty or, at minimum, its dominant contributors.
Timing uncertainty can include sample interval, channel skew, sensor response tolerance, threshold noise, filter delay, and position-resolution effects. Avoid reporting more decimal places than that combined chain can support.
Transient Pressure Lag FAQs
The five signals most often needed are the command, upstream pressure, active-chamber pressure, opposing-chamber pressure, and piston position. A 2026 system-level cylinder experiment likewise combined valve input, two chamber pressures, and motion measurements rather than relying on a single pressure switch (Nguyen Ngoc et al., 2026).
Is pressure-wave travel the same as cylinder fill time?
No. Pressure-wave travel describes the arrival of a small disturbance and has an ideal-gas speed governed mainly by gas properties and temperature. Chamber fill time describes a finite pressure change produced by mass flow into a volume. Valve restrictions, pressure ratio, temperature, leakage, connected volume, and piston motion affect filling.
Is a 1 kHz sample rate always enough?
No. One kilohertz gives a 1 ms sample interval, but adequacy depends on the required timing uncertainty and the complete measurement bandwidth. Confirm sensor response, conditioning, anti-alias filtering, converter behavior, channel alignment, and signal frequency content. NI’s guidance starts above twice the highest relevant frequency and recommends more margin when waveform shape matters.
Does a longer stroke always increase first-motion lag?
No. Stroke sets the maximum swept volume, while first-motion lag begins from the actual initial chamber volume. Starting position, clearance, connected tubing, valve response, mass flow, opposing pressure, load, and breakaway friction all matter. Test multiple start positions if the machine can begin from different locations.
Can ISO 12238 certify complete cylinder response time?
No. ISO 12238:2023 defines directional-valve shifting-time measurements for specified valve types. A complete cylinder response includes downstream volume, pressure buildup, exhaust behavior, load, friction, motion, and sensing. Use the standard for its stated valve boundary, then define and validate the broader machine boundary separately.
Which pressure value should define lag?
Use the pressure event that matches the requirement. First detectable change is useful for propagation studies, a normalized step percentage supports waveform comparison, and an absolute threshold may match a breakaway or process requirement. State the threshold, hysteresis, filtering, interpolation, and reference pressure convention with the result.
Which Sources Support This Test Method?
The method rests on seven sources with different boundaries: two ISO standards define valve-shift and steady-state flow tests; NASA supplies the ideal-gas wave-speed relation; NI covers sampling; WIKA and PCB cover sensor dynamics and mounting; and a 2026 cylinder study demonstrates synchronized pressure and position acquisition. None supplies a universal cylinder-lag value.
- ISO 12238:2023, Pneumatic fluid power, directional control valves, measurement of shifting time
- ISO 6358-1:2013, Steady-state flow-rate characterization of pneumatic components
- NASA Glenn Research Center, Speed of Sound
- NI, Bandwidth, Nyquist Sampling Theorem, and Aliasing
- WIKA, The Response Time Behaviour of Pressure Sensors
- PCB Piezotronics, Introduction to Pressure Sensors
- Nguyen Ngoc, Pham, and Tran Xuan, Experimental and System-Level Simulation Study of Stick-Slip Characteristics in Pneumatic Cylinders, Actuators, 2026.