

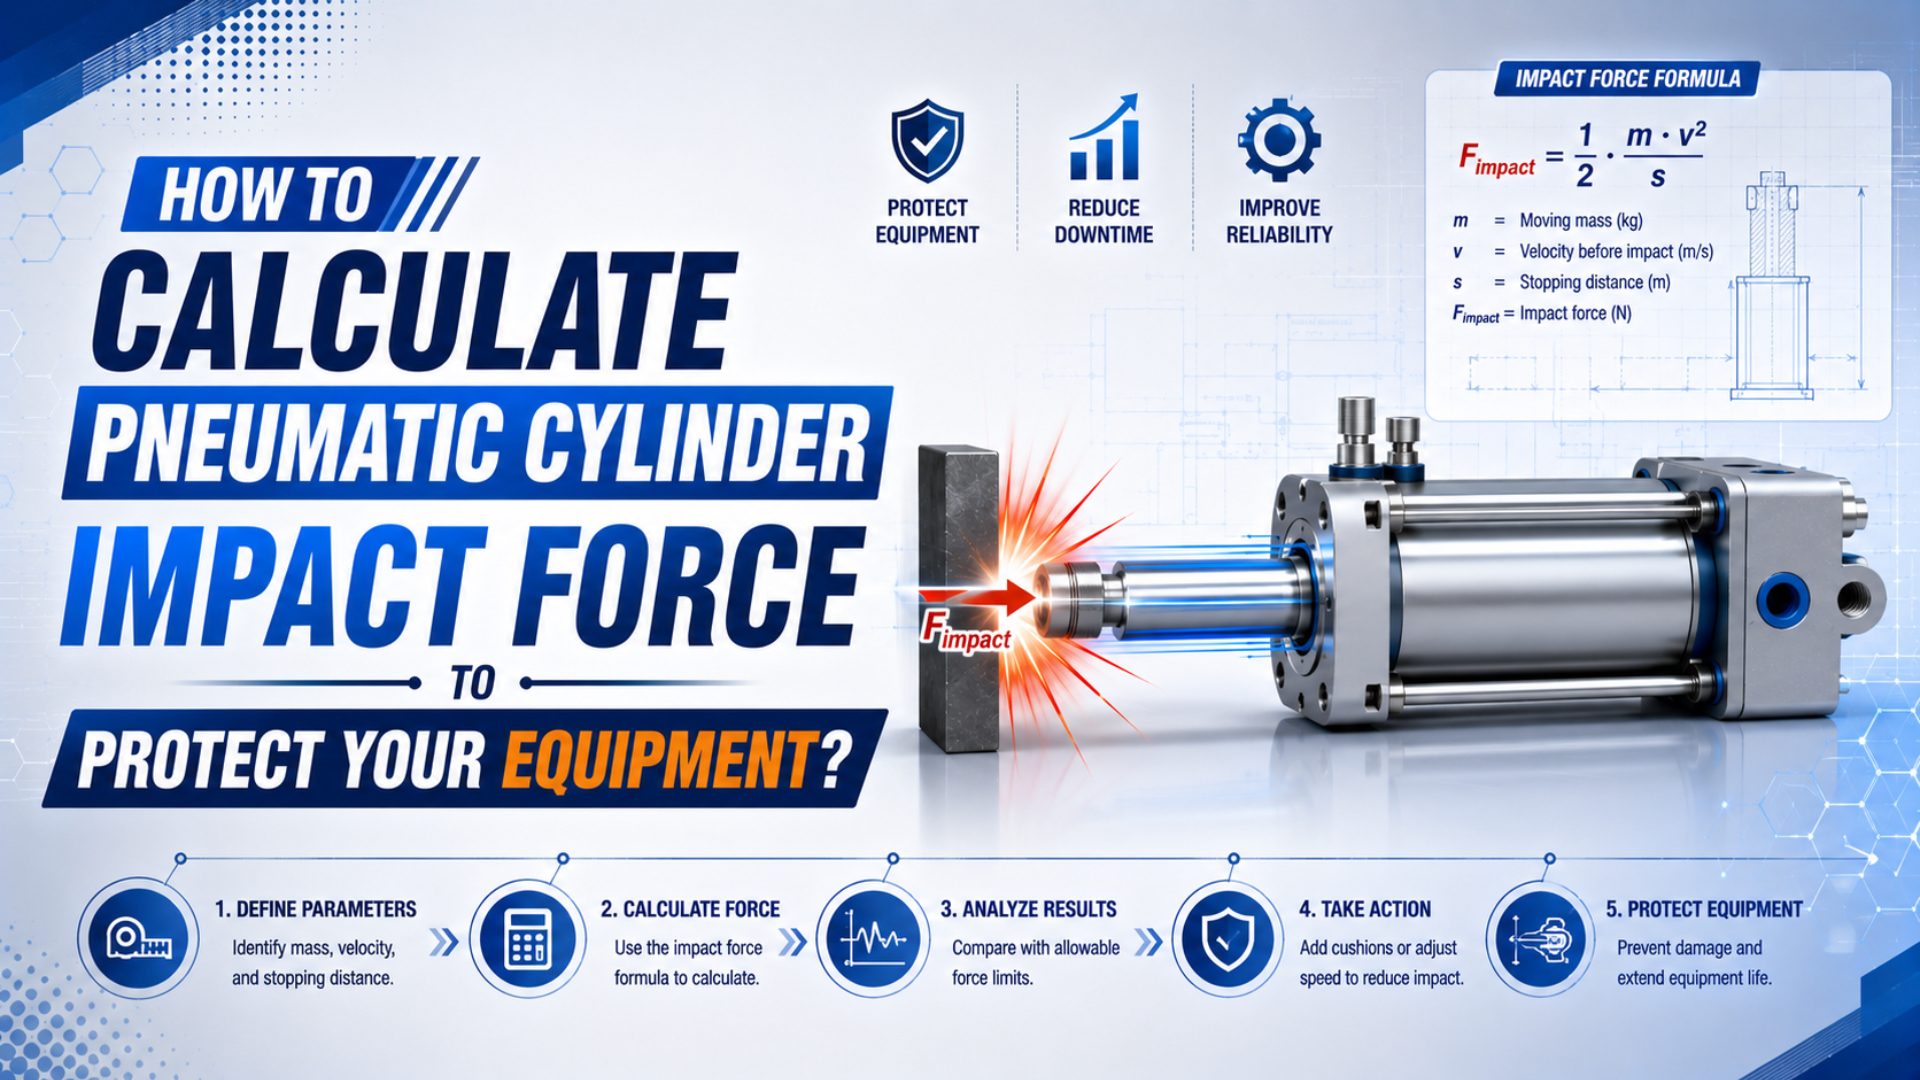
You can estimate the energy and average stopping force of a pneumatic cylinder from its moving mass, speed, drive force, and stopping distance. You cannot calculate a trustworthy peak impact force from mass, speed, and distance alone. Peak force also depends on the actual deceleration profile, contact stiffness, damping, pressure dynamics, and structural response.
That boundary matters when the purpose is equipment protection. A correct energy calculation can screen a cushion or shock absorber, while the machine’s allowable peak load must be checked against a force-time trace, a manufacturer-supplied force curve, or a validated dynamic model.
Average stopping force is absorbed energy divided by effective stopping distance. Peak impact force is the highest instantaneous reaction during the event. Cushion-entry velocity is the local piston or carriage speed when the stopping device begins to decelerate the moving assembly.
Key Takeaways
- Parker says cushion-entry speed is typically about 50% above average stroke speed.
- The familiar energy-over-distance equation gives an average inertial force, not peak impact force.
- Add continuing cylinder and gravity work when the selected device method requires them.
- Verify peak load in the actual bracket, guide, stop, or frame load path.
What Does the Pneumatic Cylinder Impact-Force Formula Actually Calculate?
Parker warns that piston speed at the start of cushioning is typically about 50% higher than average stroke speed, so even the input velocity needs careful definition. With that velocity and a known stopping distance, the standard work-energy calculation produces an average inertial stopping force, not the short peak seen by the machine (Parker P1F catalogue).
Start with translational kinetic energy:
Here, is kinetic energy in joules, is the total translating mass in kilograms, and is velocity at cushion or stopper entry in metres per second. The mass includes the piston or carriage, tooling, payload, brackets, and any mechanism whose motion is reflected into the cylinder axis.
If that energy is removed over an effective stopping distance , the energy-equivalent average inertial force is:
is an average over the stated distance. The equation assumes the moving mass reaches zero speed and does not describe how force varies during the stop. Calling this result “peak impact force” gives a screening calculation more authority than it has.
The label belongs with the number. Record the result as average inertial stopping force over the usable stopping distance. If a drawing or risk review requires a peak reaction, create a separate verification item instead of silently reusing the average.
For the broader energy and load-path method, see the complete end-of-stroke force guide. This article stays focused on the calculation boundary and the evidence needed to protect a specified piece of equipment.
Which Inputs Belong in the Calculation?
Festo identifies 5 influences on adjustable pneumatic cushioning: moving mass, speed at damping, required deceleration, working pressure, and cylinder resistance. That list explains why payload and regulator pressure alone are insufficient. The calculation must represent the installed motion, stopping device, direction, and production rate (Festo cylinder cushioning guide).
Build one input row for each travel direction and load recipe. Extension and retraction can have different effective areas, process forces, moving assemblies, and gravity signs.
| Input | Unit | What to use | Frequent error |
|---|---|---|---|
| Total moving mass, | kg | Piston or carriage, tooling, payload, moving brackets, reflected mechanism mass | Using payload alone |
| Cushion-entry velocity, | m/s | Measured local velocity or a conservative validated estimate | Using stroke divided by total cycle time |
| Effective stopping distance, | m | Usable cushion length or absorber working stroke | Using total cylinder stroke |
| Net continuing drive force, | N | Dynamic pressure-area force minus defensible opposing loads | Using theoretical force at static regulator pressure |
| Gravity force along travel, | N | Signed component that assists or opposes the stop | Ignoring vertical direction |
| Sustained event rate, | 1/h | Worst continuous production rate | Using a daily average |
| Device limits | J/event, J/h, m/s, kg | Exact model and installed orientation | Copying another bore or series |
| Equipment acceptance limit | N, J, mm, ms | Drawing, component rating, or verified design requirement | Comparing average force with an unspecified peak limit |
Use dynamic pressure at the cylinder ports when drive work is material. Long tubing, valves, silencers, and flow controls can make chamber pressure during deceleration different from the regulator setting. The pressure-and-area force guide covers that force balance separately.
How should velocity be obtained? A position trace with adequate sampling can provide the local slope near cushion entry. A suitable velocity sensor is better when the motion changes rapidly. If only total stroke time is available, treat the resulting average as an estimate and apply the exact manufacturer’s selection guidance rather than inventing a universal multiplier.
Calculating Average Stopping Force Step by Step
SMC’s model-selection guide gives one specific mass-speed example: a 40 mm-bore CM2 air-cushioned cylinder moving 50 kg is limited to 300 mm/s in the illustrated condition. The example is a catalog boundary, not a universal rule, and it shows why the calculation must end with an exact-model check (SMC air-cylinder selection guide).
Consider a horizontal transfer with these inputs:
- Total moving mass: 15 kg
- Measured cushion-entry speed: 1.2 m/s
- Usable stopping distance: 12 mm, or 0.012 m
- Net cylinder drive force through the stopping zone: 500 N
- Sustained stopping events: 900 per hour
First calculate the kinetic energy:
Next calculate the work added by the cylinder while it continues to push:
Because the motion is horizontal, gravity does no work along the axis. The event energy is therefore:
The average resisting force needed over the full usable distance is:
This 1,400 N result contains two parts: 900 N of average inertial force and 500 N opposing the continuing drive. It is still not a peak. A cushion that builds pressure late, a bottomed shock absorber, a hard stop with small compliance, or a flexible bracket can all produce a different maximum reaction.
Finally, calculate the sustained energy duty:
Compare 16.8 J per event and 15,120 J/h with the exact stopping device’s limits. Check its permitted impact-speed and effective-mass ranges too. ACE lists energy per cycle, propelling-force energy, total energy per cycle, and total energy per hour as separate shock-absorber selection quantities (ACE calculation basis).
Required Stop Distance and Maximum Entry Speed
ACE defines 4 separate energy quantities in its calculation basis: kinetic energy, propelling-force work, total energy per cycle, and total energy per hour. Working backward from an allowable energy or average-force target is therefore possible, but only after the engineer states which limit is being used and what it represents (ACE calculation basis).
Suppose the preliminary design assigns a maximum average resisting force to a controlled stopping device. Let be the net force that continues to assist motion into the stop, including cylinder drive and the signed gravity component. The minimum idealized stopping distance is:
This equation is meaningful only when . If the denominator is zero or negative, the proposed average resisting force cannot overcome the continuing applied force while also removing the initial kinetic energy.
For the 15 kg load at 1.2 m/s, let the preliminary average-force target be 1,200 N and the continuing drive be 500 N:
The idealized minimum is about 15.4 mm. A nominal 12 mm cushion cannot meet that average-force target under these assumptions. Increasing stroke, reducing entry speed, reducing continuing drive, or selecting another stop architecture are the available levers.
You can also screen the maximum entry velocity for a known usable distance:
This is not permission to operate at the calculated speed. The exact cylinder cushion or shock absorber must still accept the energy, velocity, effective mass, return time, temperature, and hourly duty. If the equipment limit is explicitly a peak force, do not insert it into these average-force equations without a validated force profile.
Reverse calculations expose impossible requirements early. If the available distance is fixed and the assisting drive nearly equals the allowed average reaction, no amount of arithmetic can create a gentle stop. The design must change speed, force, stroke, or load path.
Why Can’t the Same Calculation Predict Peak Impact Force?
SMC publishes cushion lengths from 11.0 to 11.8 mm and absorbable energies from 0.54 to 2.35 J for CM2 bore examples. Those paired values vary by model, yet they still do not provide a universal peak-force multiplier. Peak reaction requires the force distribution within the stop and the structure receiving it (SMC air-cylinder selection guide).
Force changes during deceleration:
is the instantaneous inertial force and is measured acceleration. The reaction at a specific machine component can also contain pneumatic drive, gravity, friction, linkage effects, and local vibration. A frame accelerometer, a load cell at the stopper, and a pressure trace answer different questions.
Consider three stops that absorb the same energy over the same nominal distance:
- A progressive cushion may build force gradually.
- A correctly selected hydraulic absorber may spread the reaction over much of its stroke.
- A hard stop may remove most energy after clearances close, creating a narrow high-amplitude pulse.
All three can have the same calculated average. Their peaks and transmitted moments can differ substantially.
How Should You Verify the Peak Load in the Equipment?
ISO 4414:2010 covers pneumatic-system hazards throughout design, installation, adjustment, operation, and maintenance, while ISO 12100:2010 defines a machinery risk-assessment and risk-reduction process. A component calculation is only one input to that process; it does not certify the machine or replace verification of the installed load path (ISO 4414; ISO 12100).
Define the acceptance question first. Are you protecting the cylinder end cap, a shock absorber, guide bearings, mounting bolts, a welded frame, or the carried product? Place the sensor or model boundary where that reaction actually passes.
A practical verification sequence is:
- Confirm the drawing limits and whether each is an allowable peak, fatigue range, moment, energy, displacement, or acceleration.
- Inspect stop alignment, guide clearance, mounting stiffness, fastener condition, cushion setting, and shock-absorber stroke.
- Record mass, recipe, direction, pressure, temperature, entry velocity, and sustained cycle rate.
- Capture displacement or velocity together with force, acceleration, or pressure at adequate bandwidth for the event.
- Test both directions and the credible worst combinations of payload, speed, pressure, and temperature.
- Compare the measured peak and impulse with the relevant component and structure limits.
- Repeat after adjustment, then save traces and settings with the machine acceptance record.
In our experience, the most useful test record keeps four columns separate: measured input, calculated screening value, catalog limit, and measured response. That prevents a 1,400 N average-force estimate from later appearing on a drawing as a verified 1,400 N peak.
Noise alone is not a force measurement. A quieter stop can still overload a bracket through a long moment arm, and a brief sharp sound can come from loose hardware rather than the cushion. Use the side-loading guide when the stop reaction is offset from the guide or cylinder axis.
Which Protection Method Should You Choose?
SMC’s selection example limits one 50 kg, 40 mm-bore CM2 case to 300 mm/s, while Parker advises using cushion-entry speed rather than average speed. These two manufacturer checks rule out universal thresholds such as “internal cushions below 30 kg” or “external absorbers above 50 kg.” Selection must follow the exact model envelope (SMC; Parker).
Choose the intervention that changes the limiting quantity:
| Finding | Appropriate next step | Evidence required |
|---|---|---|
| Entry speed is too high | Reduce approach speed or command a staged profile | Measured velocity and revised cycle time |
| Internal cushion is within its model envelope | Tune it under real load in both directions | Mass-speed or energy data, pressure, no residual impact or rebound |
| Internal cushion limit is exceeded | Select an external absorber or another stopping architecture | Energy/event, energy/hour, speed, effective mass, stroke |
| Required average force is too high | Increase usable stop distance or reduce speed and drive force | Recalculated distance and measured motion |
| Equipment peak remains excessive | Change the force profile, stop location, stiffness, or load path | Instrumented peak and structural review |
| Position datum belongs at the tooling | Put the mechanical stop near the guided load | Guide moments, stop reaction, repeatability test |
| Load or recipe range is wide | Validate every operating corner or use a suitable self-adjusting/controlled solution | Approved mass-speed-pressure envelope |
The internal air-cushion energy guide explains how to read product-specific ratings. If an external device is required, use the shock-absorber sizing guide for effective mass, hourly duty, mounting, and positive-stop checks.
Don’t treat a flow-control valve as an energy-rated stopping device. Reducing approach speed can lower kinetic energy, but the selected cushion, absorber, bumper, stop, guide, and frame still need their own acceptance checks.
Pneumatic Cylinder Impact Force FAQs
Parker’s 50% cushion-entry warning and SMC’s 0.54 to 2.35 J CM2 examples show why pneumatic impact calculations need both measured motion and model-specific limits. These 5 answers keep average-force estimates, peak reactions, cylinder thrust, stop distance, and equipment safety as separate engineering quantities (Parker; SMC).
Does energy divided by stopping distance give peak impact force?
No. Dividing absorbed energy by usable stopping distance gives an average energy-equivalent resisting force under the stated assumptions. Peak force depends on the real force-displacement or force-time profile, contact stiffness, pressure dynamics, damping, clearances, and structural response. Measure or model that transient when a component has a peak-load limit.
Should cylinder thrust be added to the stopping calculation?
Add the work of the net continuing drive force when the cylinder keeps pushing through the stopping distance and the selected manufacturer’s method requires it. Do not automatically add theoretical thrust to a catalog capacity that already incorporates pressure or drive assumptions. Follow the exact model’s published procedure and avoid double counting.
Can average stroke speed be used as impact velocity?
Only as a documented estimate when no better measurement exists. Parker states that cushion-entry speed is typically about 50% higher than average speed in its selection guidance. Measure local velocity near cushion entry when cycle timing, load variation, valve flow, or pressure changes can produce a nonuniform motion profile.
Is there a universal safe ratio between impact force and cylinder thrust?
No universal ratio establishes safety. Cylinder thrust, cushion energy, absorber capacity, mounting reaction, guide moment, fastener load, and frame strength are different limits. A force calculated as two or three times theoretical thrust may still be harmless in one load path and damaging in another. Verify each applicable component requirement.
When is an external shock absorber required?
Use an external absorber when the exact internal cushion or bumper cannot accept the application’s energy, speed, effective mass, stopping distance, or cycle rate, or when the process needs a different force profile or stop location. There is no universal 30 kg, 50 kg, 1.5 m/s, or 2 m/s crossover.
Sources and technical references
- Parker Hannifin, P1F ISO Pneumatic Cylinders Technical Catalogue. Cushioning characteristics and cushion-entry speed guidance.
- SMC, Air Cylinders Model Selection. Model-specific mass-speed graphs, effective cushion lengths, and absorbable kinetic-energy data.
- ACE Controls, Calculation Basis for Industrial Shock Absorbers. Energy per cycle, propelling work, effective mass, and hourly energy.
- Festo, Cylinder Cushioning: The Three Most Common Methods. Variables affecting adjustable pneumatic cushioning.
- ISO 4414:2010. Pneumatic fluid-power safety requirements.
- ISO 12100:2010. Machinery risk assessment and risk reduction.
- AVENTICS, Adjustable Cushioning - Advantages. Manufacturer demonstration of adjustable end cushioning.