

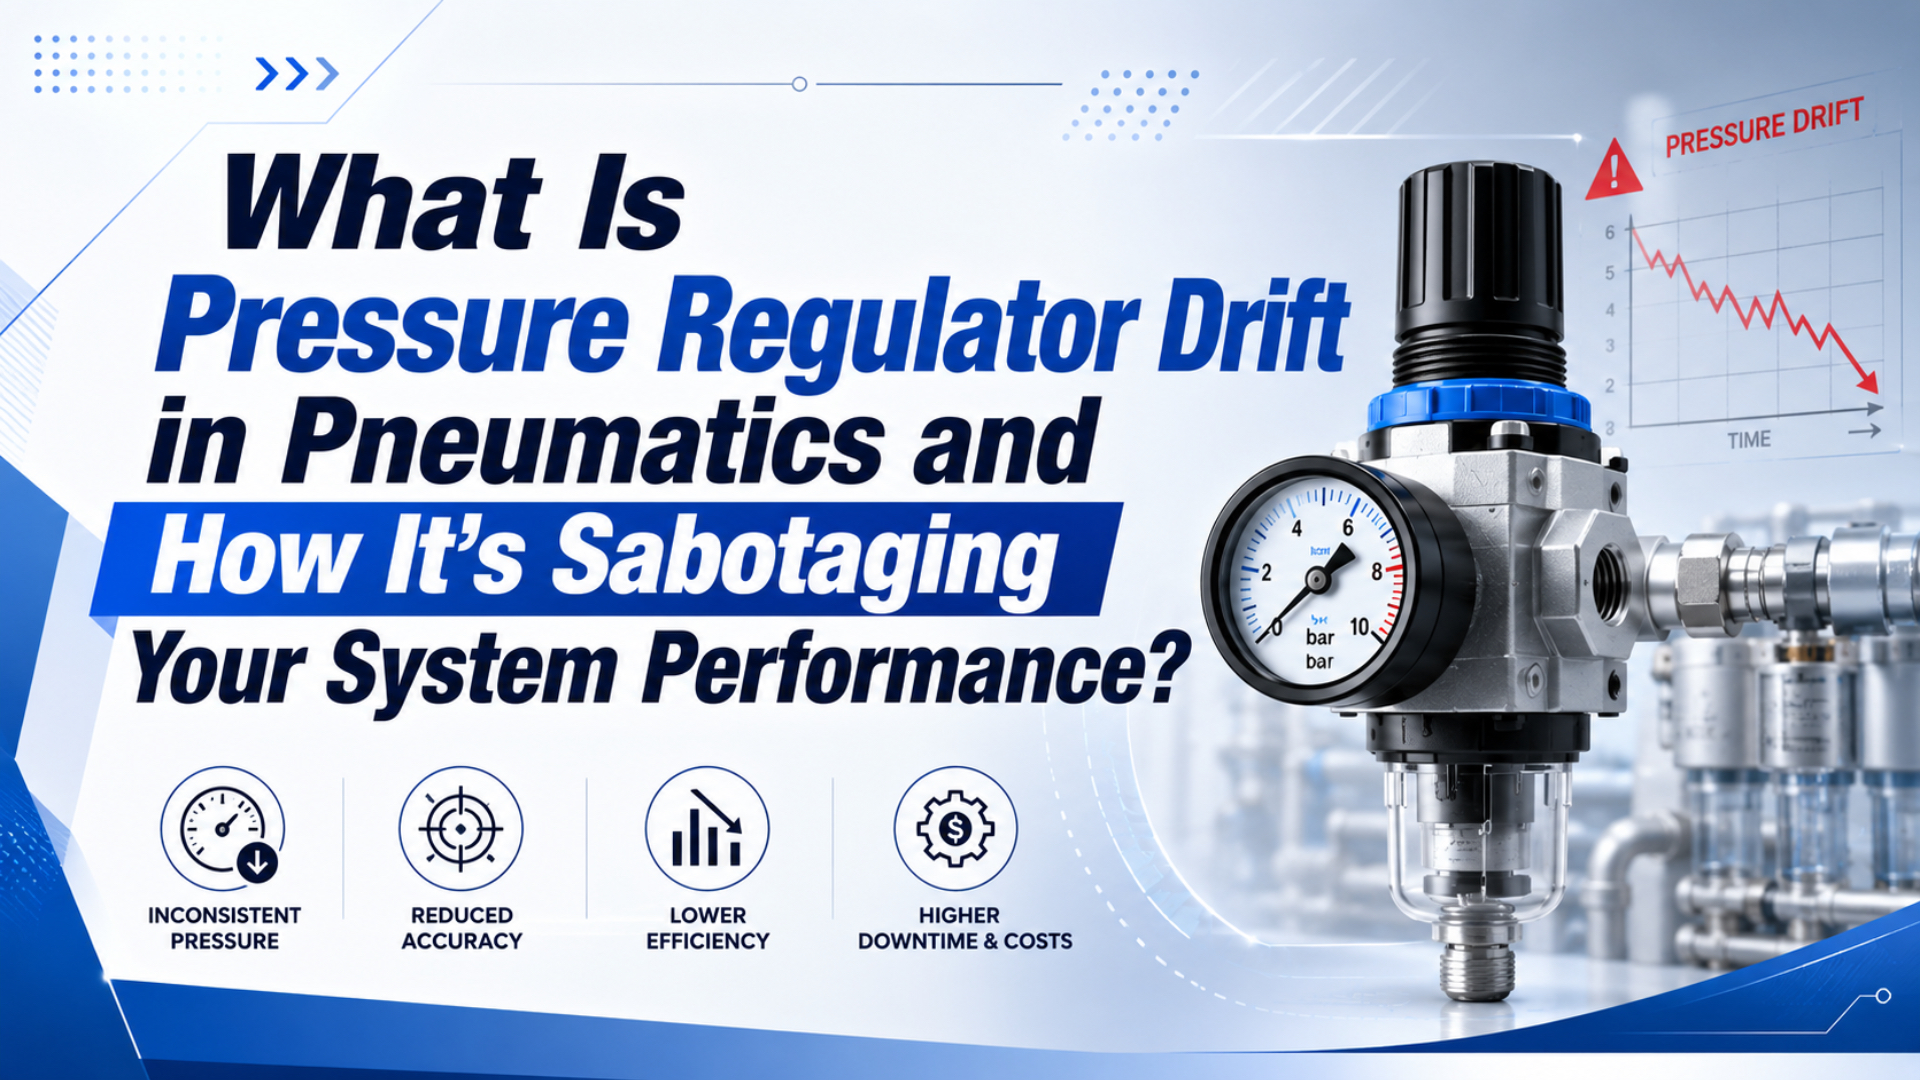
Pressure regulator drift is a sustained change in regulated outlet pressure over time after the setpoint, inlet pressure, airflow, temperature, and measurement method have been held constant. One gauge reading can’t prove it. A trend collected under repeatable conditions can.
A slow cylinder may be suffering from dynamic pressure drop, while pressure rise after flow stops may be lockup or creep. Separate those behaviors before replacing the regulator.
Key Takeaways
- True drift is a controlled time trend.
- ISO 6953-2:2024 standardizes comparison tests, but the installed limit still comes from the exact regulator model, operating conditions, and process tolerance.
- Log inlet pressure, outlet pressure, flow, temperature, and setpoint together.
- Verify the gauge first.
A useful drift investigation treats the regulator and the measuring instrument as two separate devices under test. If only one downstream gauge is logged, a moving reading cannot tell you which device changed.
What Exactly Is Pressure Regulator Drift?
ISO 6953-1:2024 applies to compressed-air regulators rated up to 25 bar inlet and 16 bar adjustable outlet pressure and requires suppliers to publish their main characteristics (ISO, ISO 6953-1:2024, 2024). Regulator drift is a persistent setpoint error that remains after operating and measurement variables are controlled.
Think of drift as a trend, not an event. Set a regulator to a defined outlet pressure, reproduce the same inlet pressure and flow condition, allow the system to stabilize, and compare the result with the earlier baseline. A repeated movement in one direction is evidence worth investigating.
The acceptance limit is not a universal number of psi per month. It comes from two places:
- The regulator manufacturer’s stated characteristics and test conditions.
- The process tolerance at the actual point of use.
Those two limits can be very different. Festo’s 2026 MS6N-LRP precision-regulator data lists 0.02 bar pressure hysteresis for one product family, while its MS-LR-B general-purpose family lists model-dependent maximum hysteresis values from 0.25 to 0.5 bar (Festo, MS6N-LRP Data Sheet, 2026; Festo, MS-LR-B Data Sheet, 2025). Neither figure is a universal drift allowance.
Short sags, pulses, and oscillations belong to the separate pressure-fluctuation diagnosis.
How Is Drift Different From Droop, Creep, and Gauge Error?
Parker’s regulator guide uses an example supply-pressure-effect coefficient of 0.6 psig outlet change per 100 psig inlet change and states that every regulator model has its own coefficient (Parker, Pressure Regulators Installation and Operation Guide, accessed 2026). If inlet pressure or flow changed, the outlet movement is not yet proof of long-term drift.
Use the pattern below before assigning a failure mode.
| Observed behavior | What changed | Better name | First check |
|---|---|---|---|
| Outlet pressure moves slowly in one direction over repeated controlled tests | Time | Possible regulator drift | Reference instrument and test repeatability |
| Outlet pressure falls as downstream flow rises | Flow demand | Droop or flow sensitivity | Regulator flow curve and inlet pressure under flow |
| Outlet pressure rises as flow falls or stops | Flow shutoff | Lockup or creep | Seat condition, shutoff behavior, trapped volume |
| Outlet pressure moves when inlet pressure changes | Supply pressure | Supply pressure effect | Simultaneous inlet and outlet trace |
| Pressure alternates around the target | Loop or pneumatic dynamics | Hunting or oscillation | Volume, restrictions, signal stability, regulator sizing |
| The displayed pressure changes but a reference does not | Measurement system | Gauge or sensor drift | Calibration against a known reference |
| Pressure decays after supply isolation | Stored air leaves the volume | Leakage or consumption | Define test volume and isolate leak paths |
Droop is a flow-dependent performance characteristic. It often appears only while the machine consumes air. The regulator may return close to the setpoint after flow falls, so logging only idle pressure hides the fault.
Lockup or creep is an outlet-pressure rise near zero flow. Parker notes that delivery pressure normally rises slightly as flow is reduced and stopped. A continued rise well beyond the published behavior can indicate contamination, seat damage, backfeeding, or the wrong regulator architecture. It still needs a controlled test.
Supply pressure effect is another common trap. If the upstream header changes, the downstream pressure can change even when nobody touched the adjustment knob. Log both sides of the regulator on the same time base.
Finally, don’t confuse a mechanical regulator with a proportional pressure regulator. An electro-pneumatic regulator adds a command signal, internal sensor, control algorithm, and exhaust behavior. Its error budget includes linearity, hysteresis, repeatability, temperature coefficient, signal scaling, and sensor accuracy.
Measuring Pressure Regulator Drift
Fluke recommends comparing an isolated, stabilized pressure gauge with a calibrator, and its transmitter guidance says the reference should be at least three times more accurate than the device under test (Fluke, Verifying Analog and Digital Pressure Gauges, accessed 2026). Prove drift by trending a verified outlet measurement while controlling inlet pressure, flow, temperature, and setpoint.
Use a five-step field test
- Define the acceptance band. Start with the process requirement and the exact regulator data sheet. Record whether the limit applies at no flow, a specified flow, or both.
- Verify the measuring instrument. Compare the installed gauge or transducer with a suitable reference. A gauge that has shifted can make a healthy regulator look unstable.
- Log the inputs. Record inlet pressure, outlet pressure, flow or machine state, ambient temperature, medium temperature where practical, and the untouched setpoint.
- Separate static and dynamic tests. Test no-flow lockup, then repeat at one or more defined flow conditions. Don’t compare an idle reading today with a peak-flow reading next month.
- Repeat the same procedure. Use the same ports, instruments, stabilization time, flow condition, and temperature band. Compare trends, not isolated readings.
Record enough context for another technician to reproduce the result:
| Field | What to record |
|---|---|
| Regulator | Manufacturer, model, range, relieving/non-relieving design |
| Setpoint | Knob or pilot setting and adjustment direction |
| Inlet | Static and flowing pressure at the regulator inlet |
| Outlet | No-flow lockup pressure and pressure at defined flow |
| Demand | Flow rate, machine step, valve state, or repeatable load |
| Environment | Ambient and medium temperature, vibration, washdown exposure |
| Instrument | Gauge/transducer ID, range, accuracy, last verification date |
| Result | Error from baseline and process effect |
Compare the same operating states
A useful sequence is no flow, low flow, normal flow, and peak repeatable flow. If outlet pressure changes only with demand, investigate flow capacity, filter restriction, tubing, and upstream supply. The FRL setup and maintenance guide covers those system checks.
If the result changes mainly with inlet pressure, calculate or obtain the model’s supply-pressure-effect data. If it changes with temperature, repeat at stable temperature before opening the regulator. A Festo VPPM data sheet, for example, lists a 0.04%/K temperature coefficient alongside 0.5% full-scale hysteresis and 1.25% full-scale total accuracy (Festo, VPPM Data Sheet, 2026). Those values apply to that model, not to every regulator.
In our experience, the most productive field trace contains inlet pressure, outlet pressure, and machine state on one time axis. Without those three channels, technicians can spend hours calling a demand-related sag “drift” because the downstream gauge is the only recorded signal.
Causes of Upward and Downward Pressure Drift
The same 2026 Festo VPPM data distinguishes 1% full-scale linearity, 0.5% full-scale hysteresis, 0.5% reproducibility, and a 0.04%/K temperature coefficient (Festo, VPPM Data Sheet, 2026). Upward or downward movement can come from different mechanisms, so direction alone does not identify the failed part.
Possible upward movement includes:
- Valve-seat debris.
- Seat damage that prevents complete shutoff and allows downstream pressure to keep rising after demand stops.
- Backfeeding from a downstream branch or check valve.
- Flow falling toward zero and exposing normal lockup behavior rather than a time-dependent fault.
- External movement of the adjustment mechanism.
- Temperature effects in either the regulator or the measuring instrument.
Possible downward movement includes:
- Spring relaxation.
- Corrosion that changes the spring force or prevents free internal movement.
- Diaphragm or seal aging that changes compliance, preload, or sealing behavior.
- A loose adjustment mechanism.
- Restricted pilot passages in a pilot-operated regulator, especially when contamination gradually changes the pilot balance across otherwise repeatable inlet and flow conditions.
- Falling inlet pressure, greater flow demand, or downstream leakage that is being mistaken for regulator drift.
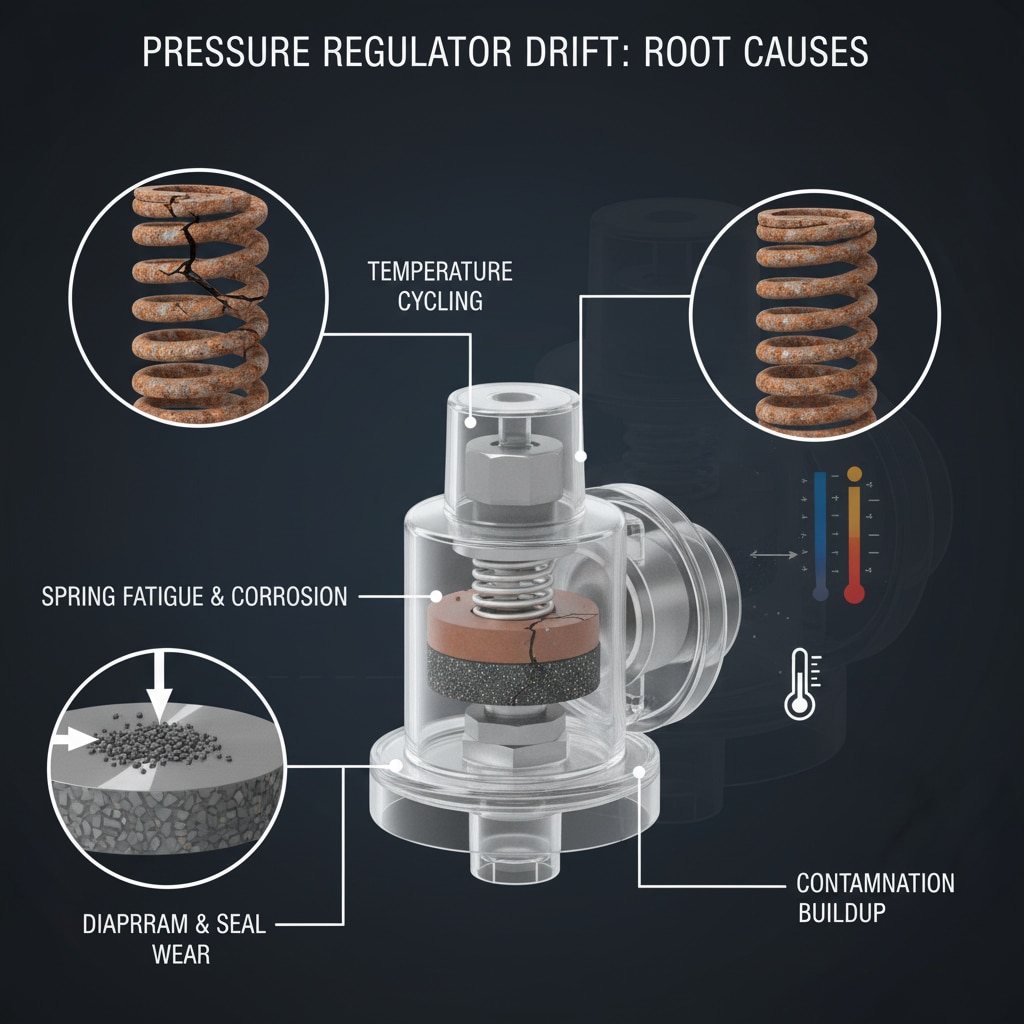
The image is a conceptual fault map. It does not assign a universal drift direction or service interval to any component.
Material aging is real, but it does not supply a universal replacement date. A 2019 study examined stress relaxation in AISI 304 stainless-steel springs under different loads and temperatures, while a 2022 EPDM study identified compression stress relaxation and compression set as indicators of long-term seal performance (Li et al., Materials Characterization, 2019; Kömmling et al., Continuum Mechanics and Thermodynamics, 2022). Actual life still depends on material, stress, temperature, contamination, duty, and design.
Air quality matters for the same reason. Particles can interfere with a valve seat, moisture can promote corrosion, and incompatible oil or chemicals can attack elastomers. Use the regulator’s own particle, oil, dew-point, and medium limits. A universal “5-micron minimum” rule is unsafe because requirements vary by model and application. The ISO 8573-1 air-quality guide explains how to specify contamination classes without guessing.
How Does Drift Affect Cylinder Force, Speed, and Energy Use?
The U.S. Department of Energy reports that, around 100 psig, a 2 psi discharge-pressure increase can raise total energy use by about 1.6% to 2% when unregulated demand is 30% to 50% (DOE, Improving Compressed Air System Performance, 2003). Upward regulator error can waste air, while downward error can reduce actuator force and process margin.
For a cylinder chamber, the first-order force change is:
Change in theoretical force = effective piston area x change in chamber pressure
ΔF = A x ΔP
For example, a 50 mm bore has an effective piston area of about 1,963 mm². A verified 0.1 bar pressure change therefore changes theoretical chamber force by about 19.6 N before friction, opposing pressure, acceleration, and mechanism losses are considered.
The real force change also depends on opposing chamber pressure, seal and guide friction, mechanism ratio, acceleration, side load, and back pressure. The pressure-and-area force guide explains the full relationship. To quantify an observed pressure shift, use the Cylinder Force Calculator as a supporting check, not as proof that the regulator caused the shift.
Speed is less direct. A higher static pressure reading does not guarantee more speed if the regulator, valve, tubing, or exhaust path cannot pass enough air. If the outlet sags during motion and recovers at rest, investigate droop and restrictions before calling it drift. That boundary is central to selecting a realistic cylinder working pressure.
Quality problems appear when pressure error consumes the process margin. A clamp can lose holding force, a press can miss its force window, and a gripper can mark a product after an upward change. Define the allowed pressure band from the required process result. Don’t start with an arbitrary ±5 psi rule.
Energy consequences also need the right boundary. The DOE figures apply to compressor discharge pressure and unregulated demand, not directly to every point-of-use regulator. They do show why raising the entire plant header to hide one unstable branch is a poor correction. Fix the local fault first.
The best alarm limit is often expressed twice: once as pressure at the process sensor and once as the resulting force, speed, or quality limit. Pressure is the regulator variable. The process result is why the limit exists.
How Can You Correct and Prevent Pressure Regulator Drift?
Festo’s 2026 MS6N-LRP lists 0.02 bar hysteresis for a precision family, while other regulator families publish much wider model-dependent values (Festo, MS6N-LRP Data Sheet, 2026). Correct drift by restoring the specified performance of the exact model, not by applying one generic repair threshold to every regulator.
Use this order:
- Confirm the measurement. Verify the gauge or transducer and repeat the controlled test.
- Exclude supply and flow effects. Compare inlet pressure, outlet pressure, and demand on the same trace.
- Check installation conditions. Confirm flow direction, mounting, exhaust path, vibration, temperature, and downstream backfeed.
- Review air quality. Inspect the upstream filter and condensate controls against the regulator manufacturer’s requirements.
- Follow the service instructions. Clean or replace only the parts the manufacturer identifies as serviceable. Use approved materials and service kits.
- Retest every relevant state. Include no-flow lockup, normal flow, peak repeatable flow, supply variation, and the production acceptance condition.
- Replace when performance cannot be restored. Use the process tolerance, published characteristics, repairability, safety consequence, and service history, not a universal psi cutoff.
Before internal inspection or component replacement, apply the site’s energy-control procedure. OSHA 29 CFR 1910.147 covers servicing where unexpected energization or release of stored energy can injure workers, and requires stored or residual energy to be relieved, restrained, or otherwise made safe (OSHA, Control of Hazardous Energy, accessed 2026).
Set a risk-based verification interval
There is no universal monthly, quarterly, or annual calibration schedule for pneumatic regulators. Start with manufacturer guidance and shorten or extend the interval using:
- Process tolerance.
- Safety consequences if pressure leaves that tolerance and the machine cannot detect the loss before a hazardous motion or failed hold occurs.
- Historical as-found error across several verification cycles.
- Cycle count and adjustment frequency.
- Temperature, vibration, contamination, washdown exposure, and the presence of an electronic pressure sensor.
- The cost and detectability of an error compared with the labor, downtime, and instrument cost of another controlled verification.
Fluke’s calibration guidance uses performance history, regulatory needs, safety, quality, and preventive-maintenance policy as interval inputs rather than prescribing one fixed period (Fluke, HART Pressure Transmitter Calibration, accessed 2026). The same risk-based logic is more defensible than copying a calendar interval from an unrelated machine.
Define acceptance before buying a replacement
ISO 6953-2:2024 standardizes regulator test methods and presentation so different products can be compared, but it also states that those comparison tests are not production tests for every individual regulator (ISO, ISO 6953-2:2024, 2024). Put the installed acceptance test in the RFQ or maintenance standard:
- Inlet-pressure range during actual demand.
- Outlet setpoint and allowable error.
- No-flow lockup limit.
- Required flow and permitted droop.
- Relieving or non-relieving behavior.
- Temperature range and stabilization time.
- Measurement location and instrument accuracy.
- Process force, speed, or quality limit.
This turns “stable pressure” into a testable requirement.
FAQs About Pressure Regulator Drift in Pneumatics
ISO 6953-2:2024 is a 39-page comparison-test standard, yet it does not create one universal drift limit for every installed regulator (ISO, ISO 6953-2:2024, 2024). The practical answers below therefore tie each decision to the exact product specification, controlled test condition, measurement uncertainty, and process tolerance.
How much pressure regulator drift is considered normal?
There is no universal normal value. One 2026 Festo precision family specifies 0.02 bar hysteresis, while general-purpose families publish different model-dependent values. Hysteresis is not the same as long-term drift, but the contrast shows why the acceptance band must come from the exact data sheet and the process requirement.
Is pressure rise after flow stops always regulator drift?
No. Parker describes a small rise as flow decreases and stops as lockup or creep. First compare the observed rise with the regulator’s published behavior, verify that the downstream circuit is not backfeeding, and inspect the seat only after inlet pressure, trapped volume, temperature, and gauge accuracy are controlled.
Can a pressure gauge make a regulator look as if it is drifting?
Yes. Fluke recommends isolating the gauge, allowing the pressure to stabilize, and comparing it with a calibrator or reference gauge. Its transmitter guidance recommends a reference at least three times more accurate than the device under test. Verify the measurement chain before adjusting or replacing the regulator.
How often should a pneumatic pressure regulator be checked?
Set the interval from process risk and as-found history. Fluke lists performance history, regulatory compliance, safety, quality, and preventive maintenance among the inputs for pressure-instrument calibration frequency. A critical clamp may justify frequent verification, while a noncritical service-air branch with stable history may justify a longer interval.
Should a drifting regulator be repaired or replaced?
Repair only when the manufacturer provides a suitable procedure or service kit and the restored unit passes the installed acceptance test. Replace it when damage is not serviceable, parts are unavailable, error cannot be restored, or failure consequences outweigh repair value. Always isolate and dissipate pneumatic energy before internal service.
Pressure regulator drift becomes manageable once it is treated as a measurement problem rather than a label. Verify the instrument, hold the operating state constant, separate time effects from flow and supply effects, and judge the result against the exact regulator and process limits.
External technical references and retrieval dates
ISO 6953-1:2024. Retrieved 2026-07-14.
ISO 6953-2:2024. Retrieved 2026-07-14.
Festo, MS6N-LRP Precision Pressure Regulator. Retrieved 2026-07-14.
Festo, MS-LR-B Pressure Regulator. Retrieved 2026-07-14.
Festo, VPPM Proportional-Pressure Regulator. Retrieved 2026-07-14.
Parker, Pressure Regulators Installation and Operation Guide. Retrieved 2026-07-14.
Fluke, Verifying Analog and Digital Pressure Gauges. Retrieved 2026-07-14.
Fluke, HART Pressure Transmitter Calibration. Retrieved 2026-07-14.
U.S. Department of Energy, Improving Compressed Air System Performance. Retrieved 2026-07-14.
OSHA 29 CFR 1910.147. Retrieved 2026-07-14.
Li et al., Microstructure Evolution in Stress Relaxation Behavior of Austenite AISI 304 Stainless Steel Spring. Retrieved 2026-07-14.
Kömmling et al., Oxidative Ageing of Elastomers: Experiment and Modelling. Retrieved 2026-07-14.