

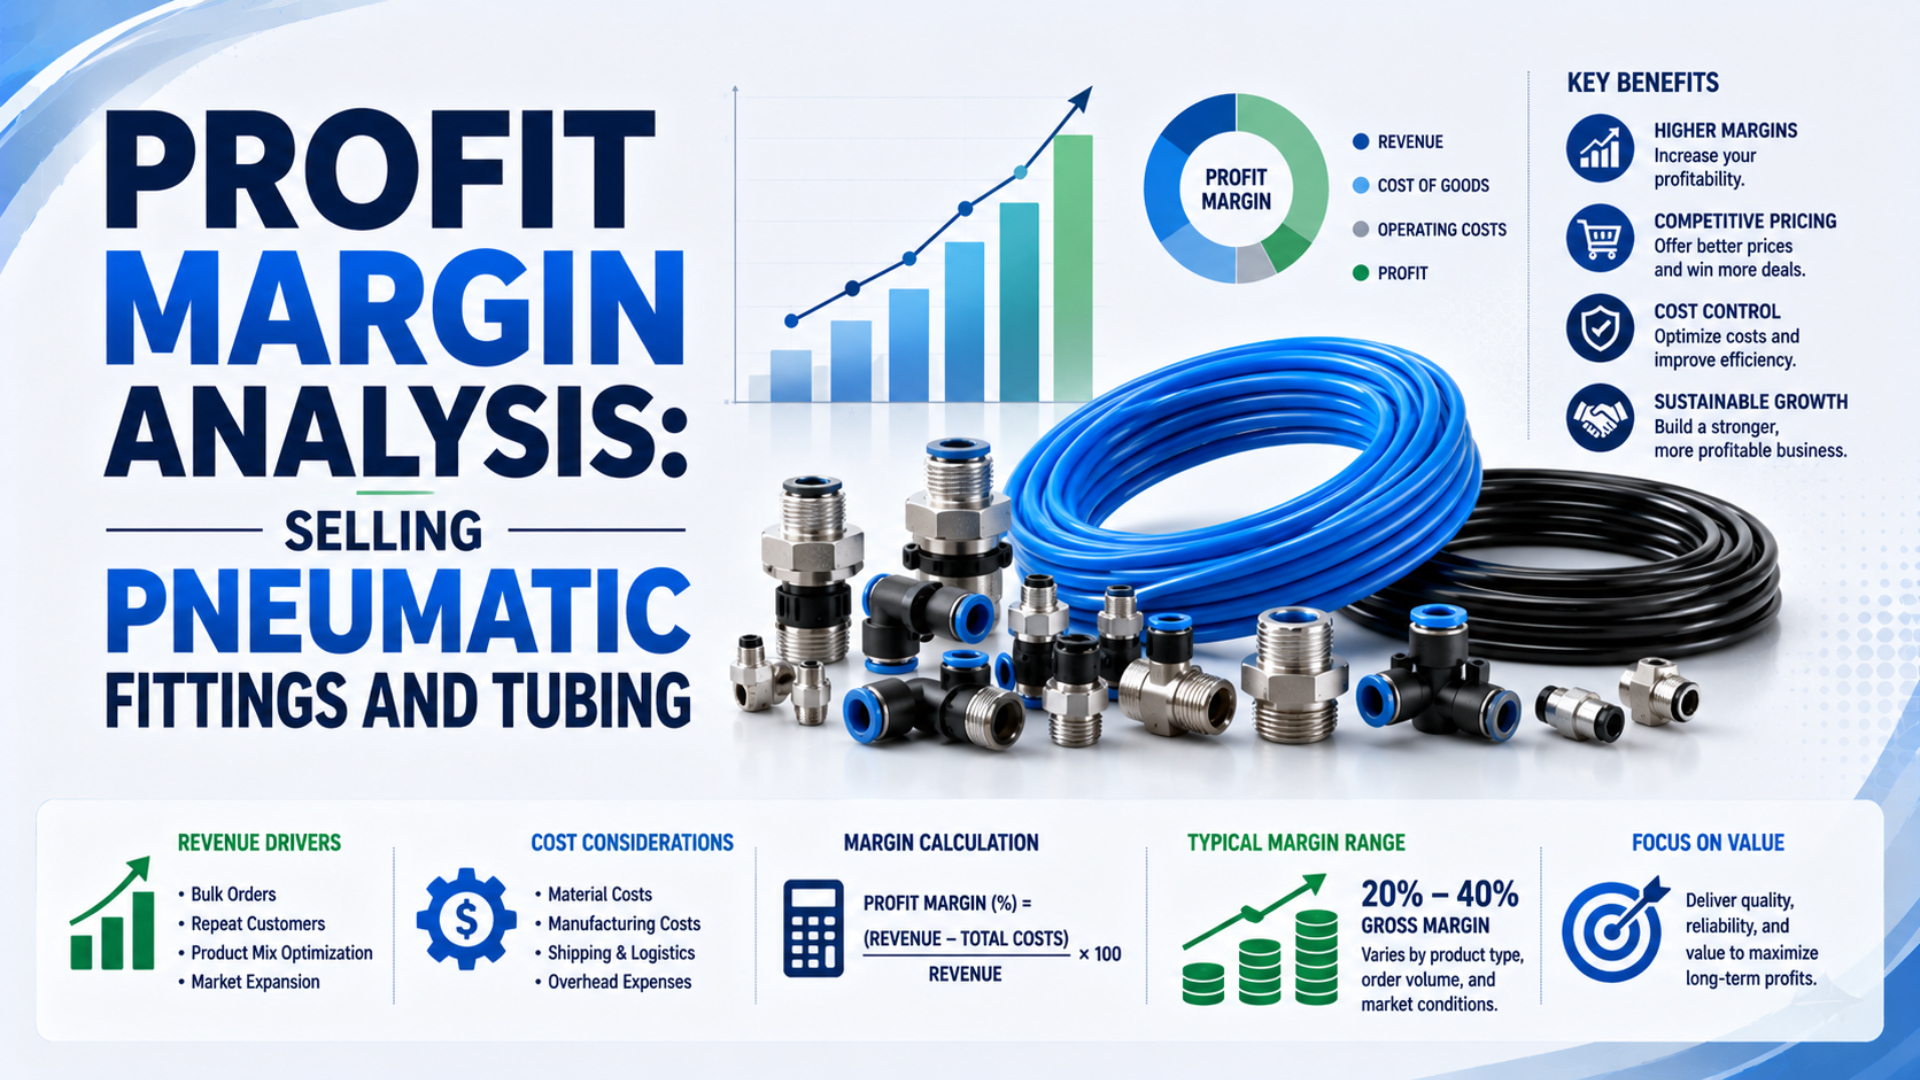
Selling pneumatic fittings and tubing profitably cannot be judged by one claimed industry margin. A distributor needs its own gross margin, contribution margin, inventory turns, GMROI, stockout, return, and service-cost data at SKU or product-family level. Public company results provide context, but they do not establish a target for this category.
In fiscal 2025, Fastenal reported a 45.0% consolidated gross margin and a 20.2% operating margin (Fastenal 2025 Form 10-K). That 24.8-percentage-point gap shows why gross margin alone cannot answer whether a stocked fitting or tubing program is genuinely profitable.
Key Takeaways
- Public industrial distributors report consolidated margins, not a universal fittings benchmark.
- Put inbound freight, duties, and purchase rebates in the correct inventory-cost boundary.
- Track contribution margin, inventory turns, GMROI, stockouts, returns, and service cost together.
- Use SKU-level evidence before changing price, stock depth, or assortment.

Small unit prices do not guarantee attractive economics. Each stocked fitting and tubing family must recover its inventory, fulfillment, service, and working-capital costs.
Which Margin Metric Are You Actually Measuring?
Fastenal’s 2025 consolidated gross margin was 45.0%, while its operating margin was 20.2% (Fastenal 2025 Form 10-K). The correct first step is therefore to name the metric: gross margin measures revenue after inventory cost, markup compares profit with cost, and contribution margin subtracts additional variable selling costs.
These measures answer different questions:
| Metric | Calculation boundary | Decision it supports |
|---|---|---|
| Gross margin | Net sales minus cost of goods sold | Is the product spread sufficient before selling and overhead costs? |
| Markup | Gross profit divided by cost of goods sold | How far is the selling price above recorded inventory cost? |
| Contribution margin | Net sales minus inventory cost and variable order costs | Does the sale contribute enough to fixed operating expenses and profit? |
| Operating margin | Operating income divided by net sales | Is the whole operating model profitable after selling, warehouse, and administrative costs? |
| Net margin | Net income divided by net sales | What remains after operating costs, interest, tax, and other included items? |
Gross margin is the share of net revenue remaining after recognized inventory cost. Markup is gross profit measured against inventory cost. Contribution margin is the amount remaining after inventory cost and the variable fulfillment and selling costs included in the stated boundary.
Gross margin percentage is:
Here, is gross margin percentage, is net revenue after discounts and returns, and is the recognized cost of the goods sold. Use one reporting period and one accounting policy for every SKU family being compared.
Markup percentage is:
Here, is markup on inventory cost. A 50% gross margin equals a 100% markup, not a 50% markup. Confusing the two can produce a selling price far below the intended margin.
The label on the report matters as much as the number. If one branch calculates margin on net sales while another divides by product cost, their percentages cannot be compared. Freeze the definition, cost accounts, return treatment, rebate treatment, and reporting period before ranking product families.
What Belongs in the Landed Inventory Cost?
IAS 2 states that inventory purchase cost includes purchase price, import duties, non-recoverable taxes, transport, handling, and other directly attributable acquisition costs, less trade discounts and rebates (IFRS Foundation, IAS 2). For fitting and tubing analysis, inbound freight cannot simply disappear below the gross-profit line.
The practical cost boundary normally starts with the supplier invoice and then adjusts for:
- Contract discounts, volume rebates, and credits
- International freight or domestic inbound freight
- Import duty, brokerage, and non-recoverable tax
- Origin and destination handling attributable to acquisition
- Packaging or inspection charged as part of obtaining the inventory
- Currency effects recognized under the distributor’s accounting policy
IAS 2 also requires inventory to be measured at the lower of cost and net realizable value. Slow-moving tube colors, obsolete thread combinations, damaged coils, and customer-specific kits may therefore need a write-down. A product can show a healthy invoice spread while aged inventory quietly reduces the category result.
MSC Industrial’s fiscal 2025 filing says its cost of goods sold includes product cost net of rebates and discounts plus inbound freight, while outbound freight, purchasing, receiving, and warehousing are included in operating expenses (MSC Industrial 2025 Form 10-K). Your chart of accounts may differ, but the boundary must be explicit and consistent.
If the category includes imported fittings, use the factory-direct pneumatic sourcing guide to normalize Incoterms, inspection, freight, import, and claim costs. For bulk purchases, the pneumatic fittings quality-assurance guide covers the product evidence that should accompany the commercial calculation.
How Do You Calculate SKU-Level Contribution Margin?
MSC Industrial reported a 40.8% gross margin but only an 8.0% operating margin for fiscal 2025 (MSC Industrial 2025 Form 10-K). The 32.8-percentage-point difference is not a fittings benchmark; it demonstrates why picking, freight, selling, service, and overhead cannot be ignored after gross profit is calculated.
A useful SKU or product-family contribution calculation is:
Here, is contribution margin in currency, is net revenue, is recognized cost of goods sold, is variable picking, packing, and outbound-delivery cost, and covers commissions, payment fees, returns, warranty, or other costs that change with the sale.
What should be included? Follow the behavior of the cost, not the name of the department. A parcel charge that occurs only when an order ships is different from annual warehouse rent. A card-processing fee tied to revenue is different from a fixed accounting salary. Keep fixed overhead outside contribution margin, then show how contribution must cover it.
Small orders deserve particular attention. Ten separate orders for one fitting each can generate more picking, packing, invoicing, and freight work than one order for a complete installation set. Does the category report capture that difference, or does it credit every SKU only with its invoice spread?
Track at least these variable cost drivers:
- Order lines and units picked
- Packaging material and parcel or route-delivery cost
- Sales commission and payment-processing cost
- Returns, credits, warranty replacements, and claim freight
- Cutting, labeling, bagging, kitting, or customer-specific handling
- Technical clarification and order-correction time when it varies materially by product family
The fitting-selection guide helps reduce mismatched tube, thread, material, and flow choices before they become returns. The port-thread guide is useful when mixed NPT, BSPT, BSPP, and metric specifications are driving corrections or dead stock.
A low-priced fitting can be profitable in a consolidated order and unprofitable as a one-line emergency shipment. That is not a contradiction. The product, order, customer, and service boundaries are different. Keep both product-family contribution and order-level contribution so pricing rules do not punish efficient baskets or subsidize expensive ones.
A Worked Pneumatic Fittings Profit Example
IAS 2 places transport and handling attributable to acquisition inside inventory cost, and MSC applies inbound freight within cost of goods sold (IFRS Foundation; MSC Industrial 2025 Form 10-K). The following USD 500,000 scenario is illustrative, not a published industry average or a promised distributor result.
Assume one annual fittings and tubing category has these records:
| Item | Amount |
|---|---|
| Net sales after discounts and returns | USD 500,000 |
| Product invoice cost after purchase rebates | USD 240,000 |
| Inbound freight attributable to the inventory | USD 8,000 |
| Cost of goods sold | USD 248,000 |
| Gross profit | USD 252,000 |
| Gross margin | 50.4% |
| Variable outbound freight | USD 18,000 |
| Variable picking and packing labor | USD 12,000 |
| Sales commissions | USD 10,000 |
| Returns and warranty provision | USD 6,000 |
| Payment-processing fees | USD 5,000 |
| Category contribution | USD 201,000 |
| Contribution margin | 40.2% |
The gross-profit calculation is USD 500,000 minus USD 248,000, producing USD 252,000. The category contribution is USD 252,000 minus USD 51,000 of defined variable selling and fulfillment costs, producing USD 201,000.
Do not call USD 201,000 net profit. The scenario still excludes fixed warehouse occupancy, salaried labor, software, insurance, bad debt, depreciation, management, interest, tax, and other shared expenses. Allocation of those costs requires a separate policy, and different reasonable allocation methods can change the apparent profitability of the category.
How Should Inventory Productivity Be Measured?
MSC Industrial’s fiscal 2025 gross margin was 40.8%, but that percentage says nothing about how much inventory was required to earn the gross-profit dollars (MSC Industrial 2025 Form 10-K). Measure fittings and tubing with inventory turns and GMROI together, then review aging, stockouts, and supplier lead time before changing stock depth.
Standard inventory turns are:
Here, is annual inventory turns, is annual cost of goods sold, and is average inventory at cost for the same category and period. Use average inventory, not only the closing balance.
In the illustrative example, annual cost of goods sold is USD 248,000 and average inventory at cost is USD 85,000. Inventory turns are therefore 2.92 times. Dividing USD 500,000 of sales by USD 85,000 gives 5.88, but that is a sales-to-inventory ratio, not standard inventory turns.
GMROI connects gross profit with inventory investment:
Here, is gross margin return on inventory investment, is annual gross-profit currency, and is average inventory at cost. The illustrative category produces GMROI of 2.96, meaning USD 2.96 of gross profit per average USD 1.00 invested in inventory during that period.
Do not read GMROI alone. A high value can coexist with poor service if stock is too shallow, while a low-turn item may be essential for a contract, emergency response, or complete product range. Add:
- Fill rate and stockout frequency by customer priority
- Lost-sales or back-order records
- Days of supply and supplier replenishment time
- Inventory age and write-down exposure
- Return and mis-pick rate
- Gross-profit dollars per bin, shelf, or cubic unit where space is constrained
- Order frequency and attachment to cylinders, valves, FRLs, or maintenance kits
The vendor-managed inventory guide explains how replenishment ownership and consumption data change the inventory decision. If tube diameter or fitting restrictions affect the application, connect the commercial record with the tubing and fitting flow guide.
How Do You Set Prices Without a Universal Margin Target?
Grainger reported a 41.7% gross margin for High-Touch Solutions North America and 29.9% for Endless Assortment in 2025, an 11.8-percentage-point difference inside one company (Grainger 2025 Form 10-K). Price pneumatic fittings from your cost-to-serve, competitive context, service promise, and customer terms rather than copying a single target percentage.
Start with a transaction-level price waterfall:
- List price
- Contract or customer discount
- Quantity break
- Rebate or promotional allowance
- Return, credit, or warranty expectation
- Net realized price
- Inventory cost
- Variable order and service cost
- Contribution
A price floor can be tested with:
Here, is the minimum net price under the chosen contribution objective, and are per-unit or per-order costs within the defined boundary, and is the target contribution rate written as a decimal. The result is a management input, not a market guarantee.
Set different rules where the economics differ. A full-carton release from stock, a cut length of tubing, a same-day emergency counter order, a customer-specific bagged kit, and a drop shipment do not impose the same work. Quantity breaks should follow measured savings in handling, packaging, freight, or selling effort, not a copied discount ladder.
Technical compatibility also protects margin. Stocking the wrong tube material, outside diameter, thread form, seal material, or pressure rating creates returns and claim exposure. The hose and fitting matching guide can support the product rules behind the price file.
For sales execution, connect these economics to the local pneumatic distributor marketing guide. A campaign should be judged on qualified contribution, not clicks or revenue without cost.
What Should a Fittings and Tubing Dashboard Contain?
Fastenal’s 2025 filing attributes margin movement partly to customer and product mix, while Grainger’s segment gross margins ranged from 29.9% to 41.7% (Fastenal 2025 Form 10-K; Grainger 2025 Form 10-K). A useful dashboard must therefore separate mix, price, cost, inventory, and service rather than reporting one blended percentage.
Use monthly and rolling-12-month views for:
| Dashboard block | Minimum fields |
|---|---|
| Sales and price | Gross sales, discounts, returns, net sales, units, net price, price variance |
| Inventory cost | Invoice cost, rebates, inbound freight, duty, write-downs, cost of goods sold |
| Contribution | Gross profit, outbound freight, handling, commission, payment cost, warranty, contribution |
| Inventory | Average inventory at cost, turns, GMROI, age bands, stockouts, write-downs |
| Orders | Order count, line count, average lines per order, picking time, attachment rate |
| Service | Fill rate, on-time shipment, returns, mis-picks, claims, technical clarifications |
| Supplier | Lead time, order minimum, delivery performance, defects, credits, change notices |
Build the hierarchy from transaction to SKU, product family, customer, branch, and channel. Reconcile it back to the financial ledger. If the sum of SKU gross profit does not agree with the recognized category total, decisions made from the dashboard will be hard to defend.
Who owns each exception? Assign one person to investigate price leakage, one to review inventory depth, and one to close product or supplier problems. A dashboard without named action thresholds becomes a monthly picture of the past.
In our experience, a compact exception list is usually more useful than a page of averages. Start with the SKUs that combine high revenue with negative contribution, aged inventory with no strategic justification, repeated stockouts, or frequent returns. Those four queues point to different remedies.
Use the pneumatic supplier negotiation checklist when a cost or lead-time exception must be converted into a documented supplier action.
Profitability Comes From a Defined Cost Boundary
Fastenal, Grainger, and MSC reported 2025 gross margins of 45.0%, 39.1%, and 40.8%, respectively, but each figure covers a broad company or business mix rather than pneumatic fittings alone (Fastenal; Grainger; MSC Industrial). Your own transaction and inventory records must determine the category decision.
Begin with five controls:
- Freeze the definitions of net sales, inventory cost, variable cost, contribution, inventory turns, and GMROI.
- Reconcile supplier rebates, inbound freight, duties, returns, and write-downs to the accounting records.
- Calculate contribution at both product-family and order level.
- Review inventory productivity alongside service and supplier risk.
- Change price or stock only after the responsible cost driver is visible.
There is no defensible promise that fittings always outperform cylinders, valves, or other pneumatic products. A well-managed category can earn attractive gross-profit dollars and support complete customer orders. A poorly measured one can hide excess inventory, expensive handling, price leakage, and returns behind a high invoice spread.
Pneumatic Fittings Profit Margin FAQs
Fastenal, Grainger, and MSC reported 2025 gross margins between 39.1% and 45.0%, yet none of those filings supplies a universal pneumatic fittings target (Fastenal; Grainger; MSC Industrial). The practical questions concern metric definitions, cost boundaries, inventory productivity, and the evidence required for pricing decisions.
What gross margin should a pneumatic fittings distributor target?
There is no reliable universal target. Set a category objective from your landed inventory cost, variable order costs, service promise, customer mix, competition, and fixed-cost requirement. Public distributor margins are useful context only. Compare realized gross margin and contribution with your own historical data, budget, and defined accounting boundary.
Is markup the same as gross margin?
No. Markup divides gross profit by inventory cost, while gross margin divides gross profit by net revenue. If an item costs USD 5 and sells for USD 10, its markup is 100% and its gross margin is 50%. Name the metric on every price file and dashboard.
Should inbound freight be included in fitting cost?
IAS 2 includes transport and handling directly attributable to acquiring inventory within purchase cost, less discounts and rebates. The exact ledger presentation depends on the applicable reporting framework and company policy, but inbound freight should not vanish from the profitability analysis. Document and apply one consistent treatment.
How are inventory turns and GMROI different?
Inventory turns divide annual cost of goods sold by average inventory at cost. GMROI divides annual gross-profit dollars by that same average inventory. Turns show how quickly inventory investment cycles; GMROI shows the gross-profit return on that investment. Review both with stockouts, aging, lead time, and service obligations.
Can a high-gross-margin fitting still lose money?
Yes. Small, urgent, or error-prone orders can consume the invoice spread through picking, packaging, outbound freight, payment fees, commission, returns, warranty, and technical correction. Calculate contribution after defined variable costs and inspect order-level economics. Gross margin is an intermediate result, not proof of net profit.