

Rodless cylinder total cost of ownership (TCO) is the present value of acquiring, installing, operating, maintaining, replacing, and eventually disposing of the system. No fixed percentage can describe it. A defensible estimate uses measured air demand, recorded service and failures, production consequences, replacement timing, and residual value for the exact machine position.
That makes this article narrower than a general pneumatic versus electric actuator cost comparison. The goal here is to compare two rodless-cylinder options, or an installed unit and its proposed replacement, without assuming that the cheaper or higher-priced cylinder must win.
Key Takeaways
- NIST requires one study period.
- DOE plant data cannot prove cylinder savings.
- SMC lists eight inspection items for one named MY1B series.
- A price premium pays back only when measured air, maintenance, and downtime savings exceed its calculated break-even threshold.
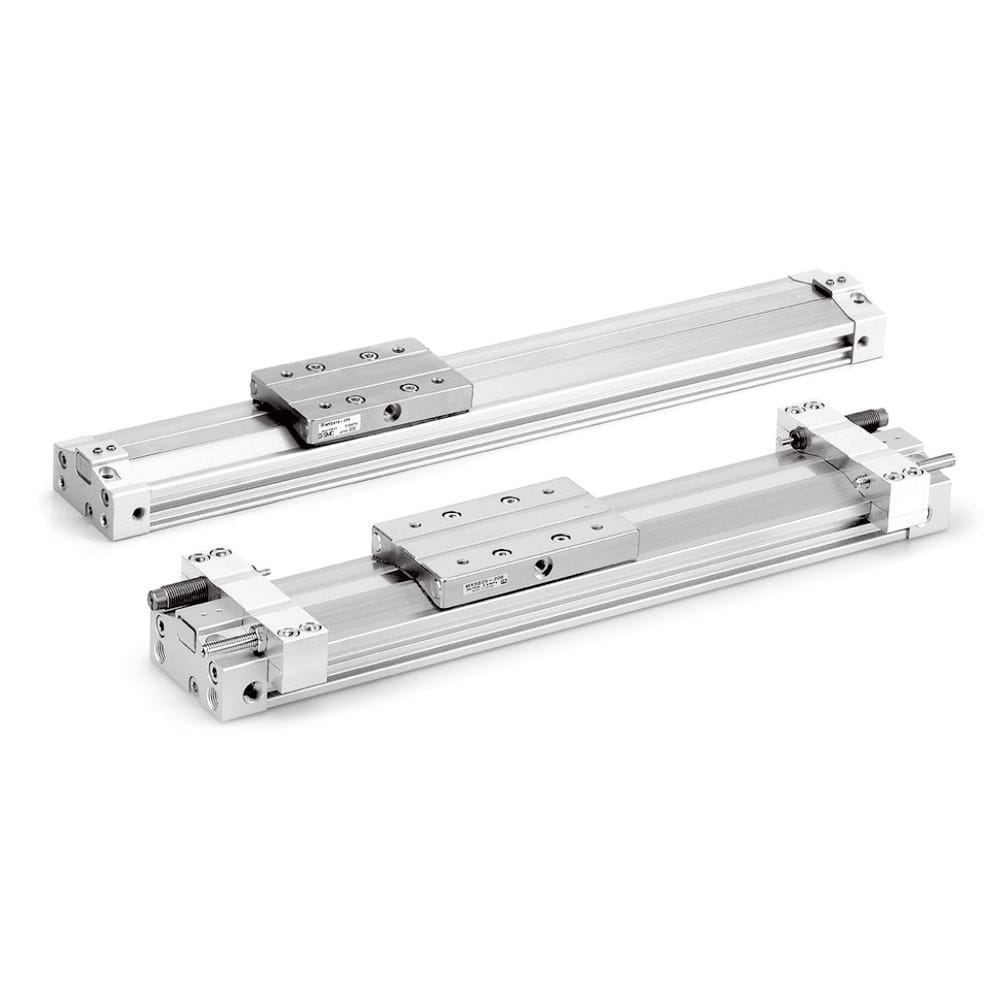
A rodless-cylinder TCO record should identify the exact series, bore, stroke, guide arrangement, cushioning, sensors, and maintenance parts. Product appearance alone does not define operating cost.
What Costs Belong in a Rodless Cylinder TCO Model?
NIST’s 2022 life-cycle costing handbook organizes cost by year and discounts every amount to one base date. Its method covers acquisition, ownership, operation, maintenance, and disposal over a defined study period (NIST Handbook 135, 2022). Those five boundaries are a sound starting point for a rodless-cylinder comparison.
Use the same functional requirement for every option. A less expensive cylinder that cannot carry the specified pitch, yaw, or roll moment isn’t an economic alternative. Neither is a premium unit whose extra guide capacity, sensor resolution, or corrosion protection has no value in the application.
Opening cost includes more than the cylinder body:
| Cost bucket | Include in the worksheet | Evidence to retain |
|---|---|---|
| Acquisition | Cylinder, carriage, guides, sensors, shock absorbers, fittings, valves, spares | Itemized quotation and exact model codes |
| Installation | Brackets, machining, tubing, wiring, guarding, alignment labor | Work order, drawing, technician hours |
| Commissioning | Programming, pressure and speed setup, acceptance testing | Test sheet and approved limits |
| Operation | Compressed air, purge or blow-off demand, inspections | Flow log, pressure log, cycle count |
| Maintenance | Cleaning, lubrication, seals, bands, bearings, shock absorbers | PM history and parts invoices |
| Failure impact | Troubleshooting, repair, scrap, lost output, expedited freight | Downtime code and incident record |
| Replacement | Removal, new unit, recommissioning, disposal | Planned replacement year and residual value |
The cost boundary must follow the machine position, not the supplier’s invoice. If Option A includes a guided carriage and Option B needs a separate guide, place both guide systems inside the comparison. Apply the same rule to valves, sensors, supports, service kits, and commissioning labor. For example, compare a cylinder with integrated guidance against the competing cylinder plus its required external rail, brackets, alignment work, and replacement bearings. For a supplier change, first complete the checks in the SMC rodless cylinder alternatives guide. TCO ranks technically acceptable options; it never excuses an unverified interchange.
The Data Record Behind a Credible Estimate
SMC’s current MY1B-Z1 manual lists eight inspection points: loose bolts, smooth operation, cycle-time change, table movement, leakage, damage, drainage, and slider play (SMC MY1B-Z1 operation manual, accessed 2026). A usable cost record attaches time and money to those observable conditions.
Build the baseline from one machine position or one clearly defined population. Don’t combine a clean packaging line with a welding cell merely because both use the same bore. Contamination, stroke, load moment, cycle rate, cushion energy, tubing, maintenance access, and downtime consequence can change the result.
Record at least these inputs:
| Input | Preferred source | Unit or format |
|---|---|---|
| Exact configuration | Nameplate, drawing, purchase history | Series, bore, stroke, options |
| Working pressure | Gauge near the machine during production | bar(g), MPa(g), or psig |
| Free-air demand | Metered branch or validated cycle calculation | m³/min ANR, L/min ANR, or SCFM |
| Duty and production time | PLC counter and shift calendar | cycles/hour and hours/year |
| Compressor specific power | Verified compressor data at relevant pressure | kW per m³/min or kW per 100 cfm |
| Electricity price | Utility bill with demand charges separated | Currency/kWh |
| Preventive work | CMMS history | Hours/event and events/year |
| Corrective work | Failure and repair record | Failures/year, labor, parts |
| Production consequence | Approved finance or operations rate | Currency/hour plus scrap |
| Study assumptions | Engineering and finance | Years, discount rate, escalation treatment |
Normalize flow before comparing suppliers. ISO 8778 specifies the standard reference atmosphere used when pneumatic component and system performance is stated (ISO 8778, confirmed 2022). If one catalog reports ANR and another uses a different reference condition, document and convert the basis before using either number. A calculated cycle volume is useful during screening, but a meter is stronger evidence when valve exhaust, tube volume, leakage, pressure recovery, intermediate stops, or auxiliary blow-off affect the branch. The air consumption calculator can establish preliminary demand before a measured production trial.
How Do You Calculate Annual Compressed-Air Cost?
DOE’s plant-level tip sheet reported that compressed-air generation represented about 10% of electricity in a typical industrial facility and 30% or more in some facilities (DOE, 2004). That historic range shows why measurement matters, but it does not assign a universal cost percentage to one rodless cylinder.
For an end-use estimate, combine normalized air flow with compressor specific power. CAGI defines specific power as the electrical input required to deliver a stated flow at a stated discharge pressure and publishes verified data-sheet guidance for compressor comparison (CAGI, accessed 2026).
Where:
- is annual air-energy cost.
- is active free-air flow, stated in m³/min on the documented reference-atmosphere basis rather than an unspecified catalog condition.
- is the fraction of scheduled time with that flow active.
- is verified compressor package specific power, in kW per m³/min at the relevant discharge pressure and operating state.
- is annual hours.
- is the applicable electricity price per kWh, using the same tariff boundary for every option.
Flow multiplied by specific power gives electrical kW. Multiplying by active hours gives kWh, and multiplying by the energy price gives annual cost. Use measured compressor input and delivered flow when available. A nameplate motor rating can overstate or understate the marginal cost of an actuator change because unloaded power, compressor sequencing, storage, dryer purge, leaks, and pressure controls affect the plant response. DOE’s full compressor formula includes operating time, load fraction, full-load brake horsepower, motor efficiency, and electricity price for that reason.
Don’t divide measured cylinder flow by an invented “system efficiency” percentage. Either use a plant-specific cost per unit of free air, or multiply end-use free-air demand by verified compressor specific power. Mixing those methods can count losses twice.
Pressure is also an economic input. If the candidate needs more pressure to overcome friction or carry the load, evaluate the changed specific power and any effect on other plant users. The related guide to air-cylinder working pressure explains why force margin and pressure strategy must be checked together.
How Should Maintenance and Downtime Be Priced?
The MY1B-Z1 manual gives model-specific leakage limits of 300 cm³/min (ANR) at 0.1 MPa and 425 cm³/min (ANR) at 0.8 MPa (SMC, accessed 2026). It also recommends monthly grease application to specified guide and seal-band areas. These figures cannot be transferred to every rodless cylinder.
Start with the manufacturer’s instructions for the exact series. A mechanically jointed design may require inspection of a seal band, dust band, slider, and guide. A magnetically coupled cylinder has different leakage and decoupling behavior. An externally guided system may move much of the wear cost out of the cylinder and into the guide.
Separate scheduled and corrective maintenance:
Where:
- is failures per year.
- includes parts, emergency freight, and outside service for one event.
- and combine internal labor hours with the loaded labor rate approved for the work.
- and value only the production time actually lost, using an operations-and-finance rate that reflects buffers, bypasses, and process constraints.
- is attributable restart loss.
Use an observed failure count only when the installed population and exposure are known. Ten failures across 100 cylinders running one shift is not equivalent to ten failures across 12 cylinders running continuously. Record cycles, distance traveled, or operating hours alongside the event count. Downtime rate deserves its own owner. Maintenance can report repair duration, but operations and finance should approve the value of lost production. If buffers or bypasses keep output moving, the full line revenue rate exaggerates the loss. When one cylinder stops a constrained process, direct repair cost may understate it.
The companion article on cylinder and actuator maintenance requirements covers technician skills and isolation work. For leakage diagnosis, distinguish acceptable model leakage from a fault using the internal leakage guide.
A Five-Year Worked Example
This illustrative worksheet compares two technically acceptable systems over five years at a 6% real discount rate. The present-value factor for equal year-end costs is 4.212. That follows the NIST method of discounting every alternative to the same base date and study period (NIST Handbook 135, 2022).
These are sample assumptions, not field results:
| Input | Installed system A | Candidate system B |
|---|---|---|
| Installed and commissioned cost | USD 4,000 | USD 5,500 |
| Active free-air flow | 0.45 m³/min ANR | 0.38 m³/min ANR |
| Active fraction | 35% | 35% |
| Operating time | 4,000 h/year | 4,000 h/year |
| Specific power | 7.0 kW per m³/min | 7.0 kW per m³/min |
| Electricity price | USD 0.12/kWh | USD 0.12/kWh |
| Expected annual maintenance and failure cost | USD 2,800 | USD 2,040 |
The energy formula gives USD 529.20/year for A and USD 446.88/year for B. Total recurring cost is therefore USD 3,329.20/year for A and USD 2,486.88/year for B.
The present-value TCO equation is:
Here, is installed and commissioned cost, is the study period, is the discount rate, is residual value, and the annual terms cover air, preventive maintenance, failure, and replacement. Use either constant currency with a real discount rate or escalated currency with a nominal rate. Don’t mix them.
With no intermediate replacement or residual value, the example produces:
| Result | System A | System B |
|---|---|---|
| Five-year present-value TCO | USD 18,024 | USD 15,976 |
| Difference | USD 2,048 lower |
System B wins under these assumptions, but the conclusion is not universal. Its maintenance and failure allowance accounts for most of the difference. If that allowance came from a sales estimate rather than comparable maintenance records or a controlled trial, the worksheet has exposed the uncertainty rather than resolved it.
When Does a Higher-Priced Cylinder Pay Back?
In the worked example, B carries a USD 1,500 initial premium. Over five years at 6%, it needs recurring savings above approximately USD 356/year under the NIST present-value method, 2022. This threshold lets each plant test its own energy, maintenance, and downtime inputs instead of claiming one payback period.
Break-even annual savings is the recurring cost reduction whose present value equals the candidate’s initial premium over the selected study period.
For roughly constant annual savings, simple payback is:
In the example, annual recurring savings are USD 842.32, so simple payback is about 1.78 years. Simple payback ignores the timing of replacement, residual value, escalation, and discounting. Use it as a screening metric, then use present-value TCO for the decision. Break-even analysis also tells you what evidence matters. If documented air savings alone exceed the threshold, uncertain downtime estimates won’t control the choice. If the result depends on an assumed failure-rate improvement, require a warranty boundary, comparable service data, or a staged machine trial before approving the premium.
Create at least three scenarios:
- Measured case: metered air and CMMS history.
- Conservative case: recorded air demand, no unproven reliability improvement, and a downtime rate reduced to reflect buffers or bypass capability.
- Stress case: higher electricity price, peak production demand, an earlier replacement, expedited freight, and no residual value at the end of the study period.
For instance, rerun the conservative case with no reliability improvement before crediting a supplier’s service-life claim.
Under reasonable input ranges, the candidate is financially resilient when it remains preferable. If a small change in one uncertain assumption reverses the result, negotiate risk through a trial, acceptance criteria, spare stock, service agreement, or price rather than presenting one TCO number as fact.
How Do You Keep the Comparison Honest?
NIST requires competing alternatives to use the same study period, base date, service date, and economic assumptions, and it lists sensitivity analysis as part of uncertainty assessment (NIST, 2022). Those four controls prevent most spreadsheet advantages created by inconsistent boundaries.
Apply these review rules before signing off:
- Compare only technically acceptable options. The same load, moments, speed, stroke, environment, sensing, cushioning, safety functions, and machine acceptance limits must apply before financial ranking begins.
- Use one production schedule.
- Identify the flow basis.
- Keep plant-level compressor savings separate from the metered or calculated change at the rodless-cylinder end use.
- Use approved labor and downtime rates.
- Place each replacement cost in its expected year, including the labor and recommissioning tied to that event.
- Record residual value consistently, including zero where no resale, reuse, or recoverable spare value exists.
- Test duty, specific power, electricity price, failures, downtime rate, and replacement year.
- Keep the evidence together.
For a design-stage decision, the rodless versus standard cylinder comparison can confirm whether a rodless architecture is justified before costs are modeled. Once the architecture is fixed, compare exact configurations rather than generic “economy,” “standard,” and “premium” labels. An honest conclusion may show that the lower-priced cylinder wins. It may instead justify a higher installed cost through measured air demand, service access, or failure exposure. The worksheet earns trust when either outcome is possible.
David Li prepared this cost-modeling guide for Bepto Pneumatic. For an application review, send the exact model codes, duty data, pressure, flow basis, maintenance record, and acceptance requirements through the contact page.
Rodless Cylinder TCO FAQs
SMC’s MY1B-Z1 manual states two allowable-leakage test points, 300 cm³/min (ANR) at 0.1 MPa and 425 cm³/min at 0.8 MPa. The difference illustrates the FAQ rule: use the exact cylinder manual and operating basis instead of applying one generic percentage, service interval, or payback claim.
Is purchase price enough to compare two rodless cylinders?
No. Compare delivered hardware, installation, commissioning, air use, scheduled service, corrective work, downtime, replacement timing, and residual value over one study period. First confirm that both configurations meet the same load, moment, speed, environment, sensing, cushioning, and safety requirements. A lower price cannot compensate for an option that fails the application.
Should I use catalog air consumption or measured flow?
Use catalog or calculated consumption for early screening, then meter the branch when the decision is material. Catalog values may not include valve exhaust, tubing volume, leakage, auxiliary blow-off, or actual duty. Record the reference-air basis under ISO 8778 and compare it with compressor specific power at the relevant pressure.
Can I assume a premium cylinder uses less compressed air?
No. Air use depends on effective volume, pressure, cycle rate, valve state, leakage, tubing, and controls. Compare exact configurations at the same duty. A better guide or seal system may improve reliability without changing swept volume, while a larger bore selected for margin can consume more air despite a higher purchase price.
How should unplanned downtime be valued?
Maintenance should provide the repair duration and event history; operations and finance should approve the monetary rate. Account for buffers, bypass capability, constrained operations, restart losses, and scrap. Don’t multiply every repair hour by full line revenue unless the failure truly stops that output for the complete recorded duration.
What is the best way to validate an expected TCO saving?
Baseline the installed axis, install the candidate in a containable position, and record pressure, normalized flow, cycle time, inspection work, failures, and production impact against written acceptance limits. Recalculate the model with measured results. Expand the change only when technical acceptance and the financial threshold both remain satisfied.
Sources and technical references
- NIST Handbook 135, Life-Cycle Costing Manual. Common study periods, present-value costing, discounting, comparison criteria, and sensitivity analysis. Published 2022. Accessed July 27, 2026. https://tsapps.nist.gov/publication/get_pdf.cfm?pub_id=934646
- U.S. Department of Energy, Determine the Cost of Compressed Air for Your Plant. Compressor operating-cost formula and plant-level electricity context. Published 2004. Accessed July 27, 2026. https://www1.eere.energy.gov/manufacturing/tech_assistance/pdfs/compressed_air1.pdf
- U.S. Department of Energy, Improving Compressed Air System Performance. System economics, measurement, pressure, leakage, maintenance, and plant assessment guidance. Accessed July 27, 2026. https://www1.eere.energy.gov/manufacturing/tech_assistance/pdfs/compressed_air_sourcebook.pdf
- Compressed Air & Gas Institute, Performance Verification. Definition and use of compressor package specific power and verified performance data sheets. Accessed July 27, 2026. https://www.cagi.org/performance-verification/
- ISO 8778:2003. Standard reference atmosphere; confirmed 2022. Accessed July 27, 2026. https://www.iso.org/standard/26559.html
- SMC MY1B-Z1 operation manual, DOC1120098. Inspection items, air supply, environment, maintenance, leakage limits, seal work, and troubleshooting for the named series. Accessed July 27, 2026. https://www.smcworld.com/upfiles/manual/en-jp/files/DOC1120098.pdf
- SMC Maintenance Parts List. MY and CY service parts. Accessed July 27, 2026. https://www.smcworld.com/maint/en-my/