

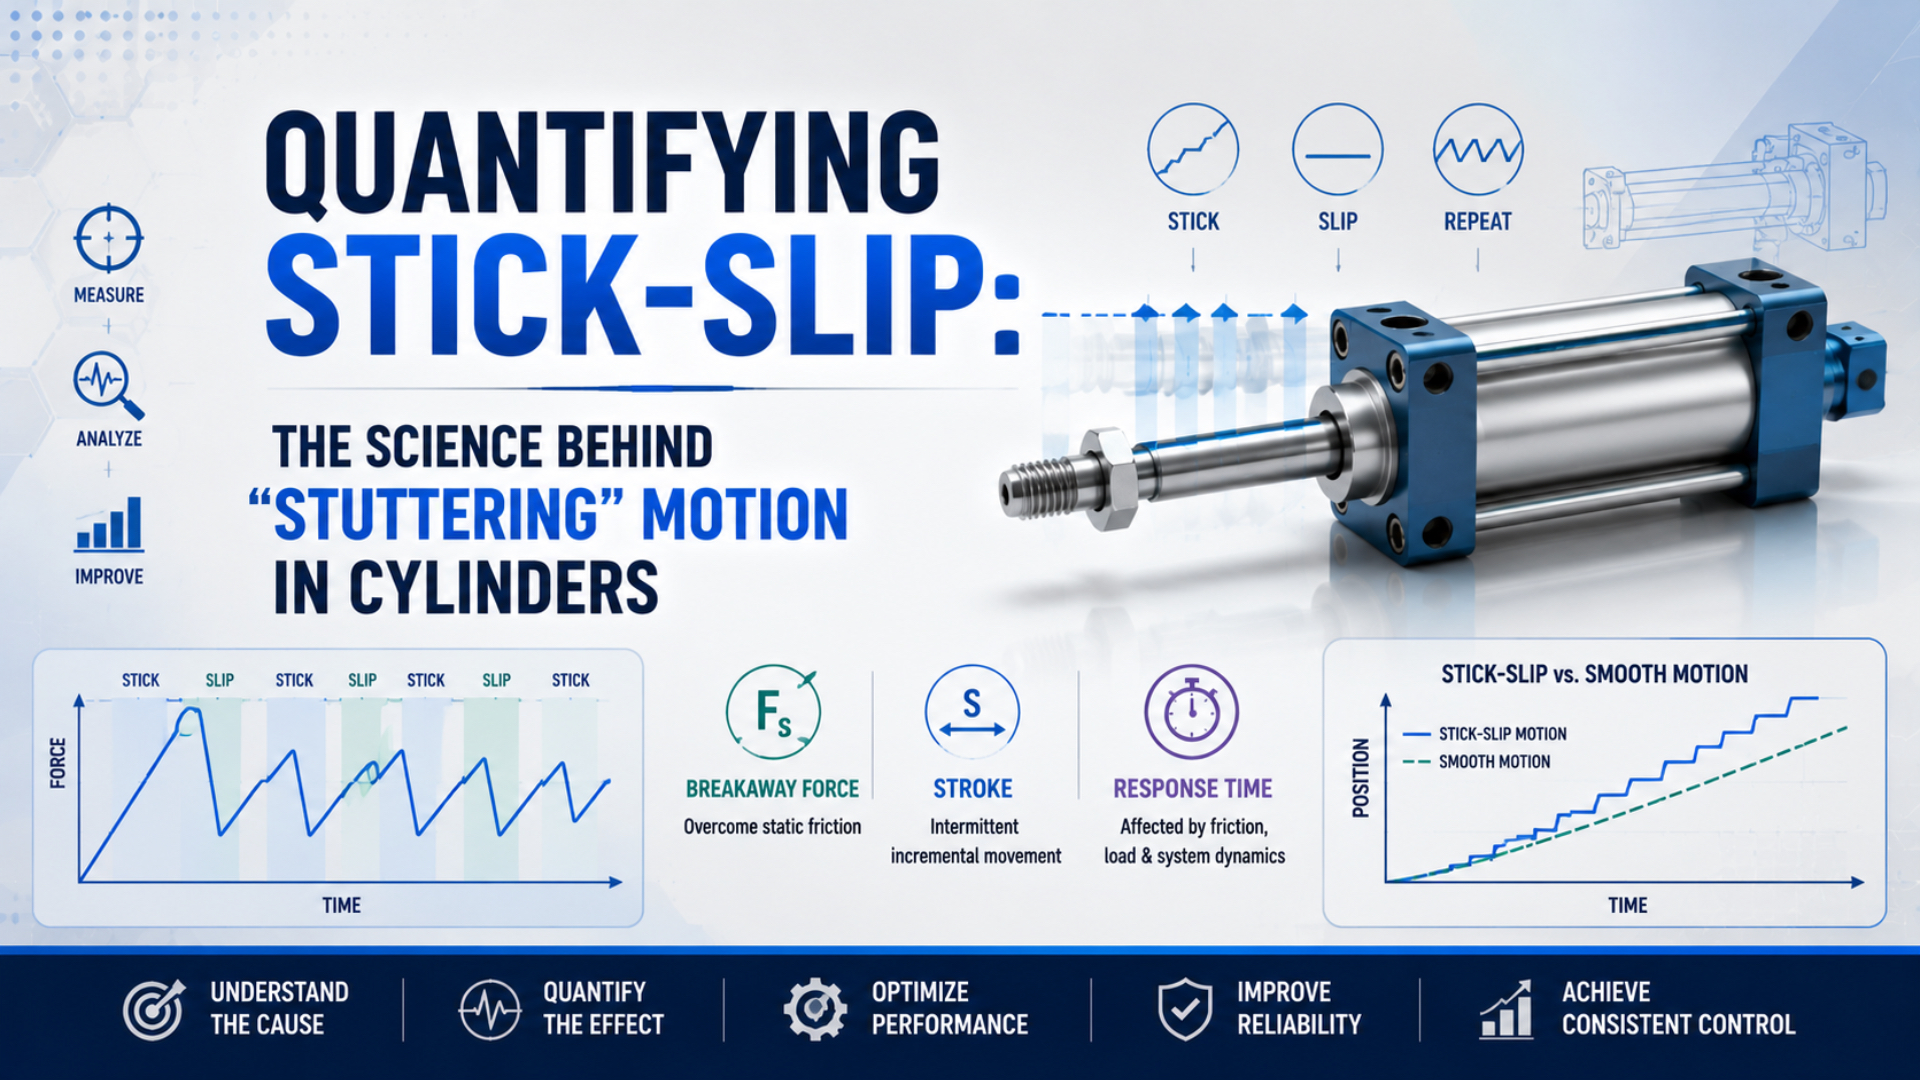
TL;DR: Cylinder stick-slip should be quantified as repeated stops and jumps during a continuous motion command—not judged by sound, average stroke time, or one universal “severity index.” Record position, velocity, both cylinder-port pressures, and the command on the same time base. Then measure stop fraction, dwell time, slip distance, and velocity variation under defined operating conditions.
Quantifying cylinder stick-slip means turning visible stuttering into repeatable motion and pressure metrics. A 2026 experiment tested three pneumatic cylinders, synchronizing piston position with velocity and both chamber pressures. Researchers also calculated friction force. Their results frame stick-slip as a system response. Airflow and compressibility interact with pressure evolution. Load and dwell-dependent friction matter too. A fixed difference between static and kinetic friction cannot explain the complete behavior (Ngoc, Pham, and Xuan, 2026).
Measurement priorities
- Capture the motion command, position, and two port pressures on one clock.
- Define a near-zero velocity band from process resolution and noise, not a borrowed threshold.
- Evaluate the constant-speed stroke separately from acceleration and cushioning zones.
- Report the test configuration with every result; a bare “SSI” number is not reproducible.
What Turns Stuttering Motion Into Measurable Stick-Slip?
Cylinder stick-slip is a repeating stop-release cycle during commanded motion. While the piston pauses, pressure-force imbalance develops; breakaway creates a short movement, and changing chamber conditions can decelerate it into another stop.
A delayed start after a long dwell is a breakaway event, not sufficient proof of stick-slip. A disturbance at a fixed position may indicate binding whereas oscillation confined to the endpoint may be cushion-related.
This definition is operational. Stick-slip exists when a valid motion command remains active as measured velocity repeatedly enters a defined near-zero band. Each pause is followed by a discrete position advance before the evaluation window ends. Pressure traces should then confirm the pneumatic-force pattern and separate it from command or mechanical faults.
For a double-acting cylinder, the instantaneous force balance can be written as:
Pressure values and must come from the cylinder ports. A regulator reading is insufficient. Effective areas and depend on the tested direction. Gravity and process resistance belong in the load term. Cylinder seals are only one source of friction. On an installed axis the external guides, joints, scrapers, cables, couplings, and process mechanism can collectively dominate the resistance seen at the piston.
A video of the rod can show poor motion. It cannot explain why. Different causes can produce the same visible jump. The plausible set stretches from pneumatic pressure buildup and valve-command toggling to a local guide bind or an incorrectly adjusted cushion restriction. Synchronization converts a symptom into evidence.
For a broader explanation of causes and corrective options see our low-speed cylinder stick-slip guide. This article stays focused on measurement and acceptance.
Which Signals Must Be Recorded Together?
The 2026 three-cylinder study recorded position, velocity, both chamber pressures, and friction-related data; its acquisition interval was 1.16 ms. That interval describes one research setup, not a universal machine requirement (Ngoc, Pham, and Xuan, 2026). Your sampling rate must resolve the shortest process-relevant stop and slip while staying within sensor bandwidth. It must also rise above noise.
| Signal | Practical measurement point | What it establishes | Common mistake |
|---|---|---|---|
| Motion command | PLC output or valve command | Whether movement was continuously requested | Inferring command state from cylinder motion |
| Position | Linear encoder or displacement transducer | Stop locations, dwell, and slip distance | Using only end switches |
| Velocity | Derived from position or measured directly | Near-zero intervals and speed variation | Differentiating noisy position without filtering rules |
| Cap-end pressure | Sensor close to the cylinder port | Driving or opposing pressure by direction | Reading only the regulator gauge |
| Rod-end pressure | Sensor close to the cylinder port | Exhaust back pressure and force balance | Treating exhaust pressure as zero |
| Load or acceleration | Load cell, known process load, and motion data | Whether friction can be inferred | Calling pressure force “friction” without accounting for inertia and load |
Use sensors whose ranges do not bury the expected changes in quantization noise. Record raw engineering units, calibration date, sample interval, filter method, and sensor locations. If the pressure transducer sits upstream of a long tube or flow control, its trace may not represent the chamber pressure during a fast slip.
How Should Position Data Become Velocity Data?
Velocity exposes stop-jump motion more clearly than position alone; numerical differentiation also amplifies measurement noise. Keep the raw position record together with calibration details, timestamps, sensor units, and a complete history of every transformation applied during analysis. Apply the same method to baseline and fault data.
For evenly sampled position data, a central-difference estimate is:
Express in millimetres and in seconds; the result is millimetres per second. The central estimate requires observations on both sides, so the first and last samples need either a documented one-sided derivative method or explicit exclusion from the evaluated record. Do not silently change sample rate or units between tests, and keep the smoothing window unchanged as well.
Filtering should remove sensor noise without rounding off the short slip events you need to measure. A practical workflow compares raw position with filtered position and plots derived velocity beside them. Increase smoothing only until stationary noise is separated from real motion. Record filter type and cutoff. Also store window length and phase treatment. A zero-phase offline filter may be useful for analysis but cannot represent the delay of an online controller.
Before calculation define the evaluation window in both time and physical stroke coordinates, then save its start and end boundaries as part of the test record. Store those boundaries with the test data so every later comparison covers exactly the same interval. Exclude valve-switching acceleration and the end-cushion region unless those zones are the subject of the test. Test extension and retraction separately because effective areas, loads, and metering conditions differ.
Four Metrics That Expose Stop-Jump Motion
No single metric captures every failure mode. Use a small set that measures how long the cylinder stops, how far it jumps, and how unevenly it moves. The acceptance limits must come from process tolerance, surface-quality requirements, sensor capability, and a validated good-machine baseline.
1. Stop fraction
Choose a near-zero threshold above stationary measurement noise but below the minimum process-meaningful speed. Within the evaluation window, count samples where :
This percentage is easy to compare when sampling is uniform. For reproducibility, report together with sample interval, window boundaries, motion direction, dwell condition, and any treatment of missing data beside every calculated value. Otherwise, the result cannot be reproduced.
2. Maximum dwell time
Group consecutive near-zero samples into events. For each event :
Report the maximum, median, and event count. A high stop fraction caused by one long stall is operationally different from many short pauses.
3. Slip distance
Measure the position change from breakaway to the next return into the near-zero band:
Maximum slip distance often maps directly to bead variation, dosing error, surface marks, or fixture disturbance. Define start and end detection rules so noise does not create false events.
4. RMS velocity variation
For samples and mean velocity in the constant-speed window:
Report alongside . A cylinder can achieve the correct average stroke speed while alternating between stops and high-speed jumps. The Cylinder Speed Calculator can supply an expected average-speed reference, but it does not diagnose stick-slip.
Consider a hypothetical acceptance review. A loaded cylinder is commanded through the middle 60% of its stroke at a constant nominal speed. Stationary sensor noise is recorded first, allowing the team to set just above that observed band. Five warm cycles and five cycles after a named dwell are captured in each direction. The average speed meets its target, yet several traces contain long near-zero intervals followed by jumps. In this case, average speed passes while stop fraction, maximum dwell, and slip distance fail the process limits. The pressure traces then decide the next diagnostic branch. Repeating force buildup during each pause supports a pneumatic-friction loop; a disturbance locked to one coordinate supports a mechanical inspection. This example does not assign numeric pass limits because those values must come from the real process tolerance and measurement capability. It shows why the acceptance record needs multiple metrics plus synchronized evidence instead of one headline score.
Transferability requires the same velocity threshold, evaluation window, sample rate, filtering, direction, load and dwell history. Without that context, two identical index values may describe very different motion.
How Do Chamber Pressures Confirm the Cause?
Pressure evidence should agree with the motion evidence. During a stick interval the driving-force contribution often builds. Meanwhile the piston remains nearly stationary. At breakaway position and velocity change. Chamber volumes evolve. So do flow and pressure balance. A 1999 meter-out study and 1988 cylinder tests show that exhaust volume, valve restriction, supply pressure, and piston position affect the oscillation pattern.
Do not label as friction. When acceleration and external load are known the following balance can estimate an inferred friction term:
Every input carries uncertainty: pressure, area, load, mass, acceleration, alignment and timing. A controlled test with a documented load model is therefore the most defensible setting for an absolute friction estimate. On a production machine use the two-port pressure trace primarily as comparative evidence; absolute friction claims require every contributing term plus its uncertainty.
Compare changes one at a time. If the stop-release timing moves when a meter-out needle changes, the pneumatic-friction loop is implicated. If both cylinder-port pressures collapse when other actuators cycle, investigate supply capacity or regulation using our pressure-fluctuation diagnostic. If the pause always appears at one physical position with little repeatable pressure buildup, inspect guides and mounting alignment.
Separating Stick-Slip From Other Jerky-Motion Faults
Use the shape and repeatability of synchronized traces before replacing components. The observations below are diagnostic directions, not proof by themselves.
| Trace pattern | More likely explanation | Next controlled check |
|---|---|---|
| Repeated near-zero velocity, pressure-force buildup, then position jump | Stick-slip loop | Vary dwell, load, and meter-out setting separately |
| One delayed start after a defined rest, then smooth travel | Breakaway friction or seal adhesion | Compare breakaway pressure at several dwell times using the breakaway-force method |
| Disturbance at the same stroke coordinate in both directions | Guide bind, barrel damage, cable drag, or misalignment | Safely decouple the load and map resistance versus position |
| Oscillation only near stroke end | Cushion entry or external shock interaction | Open the cushion, reduce entry speed, and evaluate the end zone separately |
| Command signal switches during each pause | PLC, sensor, valve, or control logic issue | Trace command and valve response before changing the cylinder |
| Both port pressures shift with other machine cycles | Shared supply, regulator, or exhaust restriction | Log header, branch, and port pressures together |
In our experience, the fastest useful comparison is usually a repeatable loaded trace against a safe decoupled-load trace. Inspect the mechanics first when a disturbance stays tied to one coordinate; continue with the pneumatic-friction investigation when the pattern follows dwell time, pressure, or metering changes instead.
A Repeatable Cylinder Stick-Slip Acceptance Test
Manufacturer data demonstrates why acceptance criteria must be configuration-specific. SMC lists smooth operation down to 0.5 mm/s for selected low-speed cylinder families and 1 mm/s for some smaller bores. Festo lists stick-slip-free ranges of 8–100 mm/s for several DSNU S10 bores and 5–100 mm/s for the 63 mm bore under horizontal, no-load, 6 bar conditions. These are product-specific test boundaries, not universal pneumatic limits (SMC; Festo DSNU).
Document the test configuration before collecting results:
- Identify the exact cylinder model, bore, stroke, seal option, mounting, guide, valve, flow controls, tube lengths, fittings, and silencers.
- State payload, process force, orientation, supply pressure, temperature, lubrication condition, and warm-up procedure.
- Define commanded speed, direction, evaluation zone, cushion zone, and dwell before each run.
- Synchronize command, position, and both port pressures; verify sensor zero and units.
- Run extension and retraction separately, including normal operation and the first stroke after the specified dwell.
- Repeat enough cycles to show variation, not just the best trace. Preserve raw data and the analysis script or worksheet revision.
Use a signed acceptance record rather than “motion looks smooth”:
| Acceptance field | Unit or definition | Limit source |
|---|---|---|
| Mean velocity | mm/s over named stroke window | Process cycle requirement |
| Stop threshold | mm/s, above stationary noise | Sensor study and process resolution |
| Stop fraction | % of evaluation samples | Validated process boundary |
| Maximum dwell | ms per event | Maximum tolerable process interruption |
| Maximum slip distance | mm per event | Part or motion tolerance |
| RMS velocity variation | mm/s around mean | Good-machine baseline or process study |
| Port-pressure envelope | bar(g) at named sensor locations | Force margin and component ratings |
| Repeatability | Result distribution across cycles | Quality plan |
The sampling and filter settings belong on the same record as the results. A supplier and buyer can then reproduce the test on the actual configuration instead of debating a universal SSI cutoff that was never defined.
When Should Hardware or Control Architecture Change?
First remove mechanical constraint, contamination, blocked exhaust, unstable supply, and incorrect flow-control orientation. Tune extension and retraction separately with the production load. A meter-out circuit can stabilize low-speed motion, but excessive restriction also increases opposing pressure and reduces force margin; see the meter-out speed-control guide.
Choose a documented low-speed or low-friction cylinder when the installed axis is aligned and stable yet cannot pass the written test within the standard model’s specified range. Compare exact model data for bore, stroke, load, orientation, minimum speed, leakage, cushioning, guide capacity, pressure, temperature, and lubrication. Do not generalize one series’ minimum speed to another.
Move to proportional or servo-pneumatic control when the process needs feedback, programmable profiles, load compensation, or intermediate positioning. Our proportional-valve guide explains that boundary. Consider an electric actuator when low-speed contouring is a central requirement. It also fits applications built around multiple positions and encoder-based verification.
Measurement Conclusion
Quantifying stick-slip is a trace-analysis problem. A valid result aligns command, position, velocity, and two chamber pressures; evaluates a defined part of the stroke; and reports stop fraction, dwell, slip distance, and velocity variation with every threshold and filter disclosed.
Evidence should drive the corrective decision. Coordinate-specific faults point toward mechanics. Dwell-, pressure-, or metering-dependent cycles point toward the pneumatic-friction loop. A cylinder that remains outside the process acceptance boundary after the circuit and mechanics are corrected needs a documented low-speed design or a different control architecture—not an unsupported universal severity score.
Cylinder Stick-Slip Measurement FAQs
Published studies and manufacturer catalogues do not establish one universal stick-slip index, speed threshold, or sampling rate. The answers below preserve the test conditions that make a measurement reproducible and distinguish repeated stop-jump motion from breakaway, binding, and average-speed errors (Ngoc, Pham, and Xuan, 2026).
Is one delayed start after a dwell the same as stick-slip?
No. One delayed start is a breakaway event. Stick-slip repeats during an active motion command: velocity enters a defined near-zero band, pressure-force conditions evolve, and the piston slips forward before stopping again. Record the complete stroke after a controlled dwell so the first breakaway can be evaluated separately from repeated in-stroke events.
Can average stroke time quantify cylinder stick-slip?
Not by itself. The average can appear correct while the cylinder alternates between stationary intervals and fast jumps. Use stroke time for cycle performance, then add stop fraction, maximum dwell, slip distance, and RMS velocity variation within a defined constant-speed window. Exclude acceleration and cushioning unless they are being investigated.
Is an SSI value above 0.3 a universal failure threshold?
No recognized universal pneumatic-cylinder standard supports a 0.3 cutoff, so the number cannot serve as a cross-machine limit. Its meaning changes with the equation and near-zero threshold. Sampling and filtering matter too. So do window, direction, load and dwell history. Use process-derived limits or a validated good-machine baseline. Publish the full calculation beside the SSI.
How fast should stick-slip measurements be sampled?
Choose a sample rate that resolves the shortest process-relevant stop and slip without exceeding the useful sensor bandwidth. Check stationary noise first. The cited 2026 study used a 1.16 ms interval. That value describes its experiment, not a default specification. Finally, confirm metric stability at the chosen rate. Dwell and slip distance should not change materially.
Do rodless or magnetically coupled cylinders eliminate stick-slip?
No cylinder configuration eliminates friction. Rodless designs can alter seal and load paths, but that change does not guarantee stable low-speed motion across models or installations. Air compressibility and flow limits still apply. Choose the exact cylinder from manufacturer data. Test the installed axis with its real guide, payload, valve and tubing. Preserve production pressure, orientation and dwell.
Sources and technical references
- Ngoc, H. N., Pham, P. P., and Xuan, B. T., “Experimental and System-Level Simulation Study of Stick–Slip Characteristics in Pneumatic Cylinders”, Actuators 15(5), 243, 2026. Used for synchronized measurements, the three-cylinder test scope, system-level dynamics, dwell effects, and the 1.16 ms experimental acquisition interval. Retrieved 2026-07-22.
- Tokashiki, L. R., Fujita, T., and Kagawa, T., “Stick-Slip Motion in Pneumatic Cylinders Driven by Meter-Out Circuit”, Transactions of the Japan Hydraulics & Pneumatics Society 30(4), 110–117, 1999. Used for meter-out circuit and Stribeck-effect context. Retrieved 2026-07-22.
- Kawashima et al., “The Stick-slip of an Air Cylinder”, Journal of the Japan Society for Precision Engineering 54(1), 183–188, 1988. Used for piston-position, supply-pressure, restriction, and exhaust-volume effects. Retrieved 2026-07-22.
- SMC, Low Speed Cylinder CJ2X/CM2X/CQSX/CQ2X/CUX. Used only for the named families’ published 0.5 and 1 mm/s minimum-speed data. Retrieved 2026-07-22.
- Festo, DSNU Round Cylinders Technical Data. Used only for DSNU S10 option speed ranges and stated horizontal, no-load, 6 bar test conditions. Retrieved 2026-07-22.