

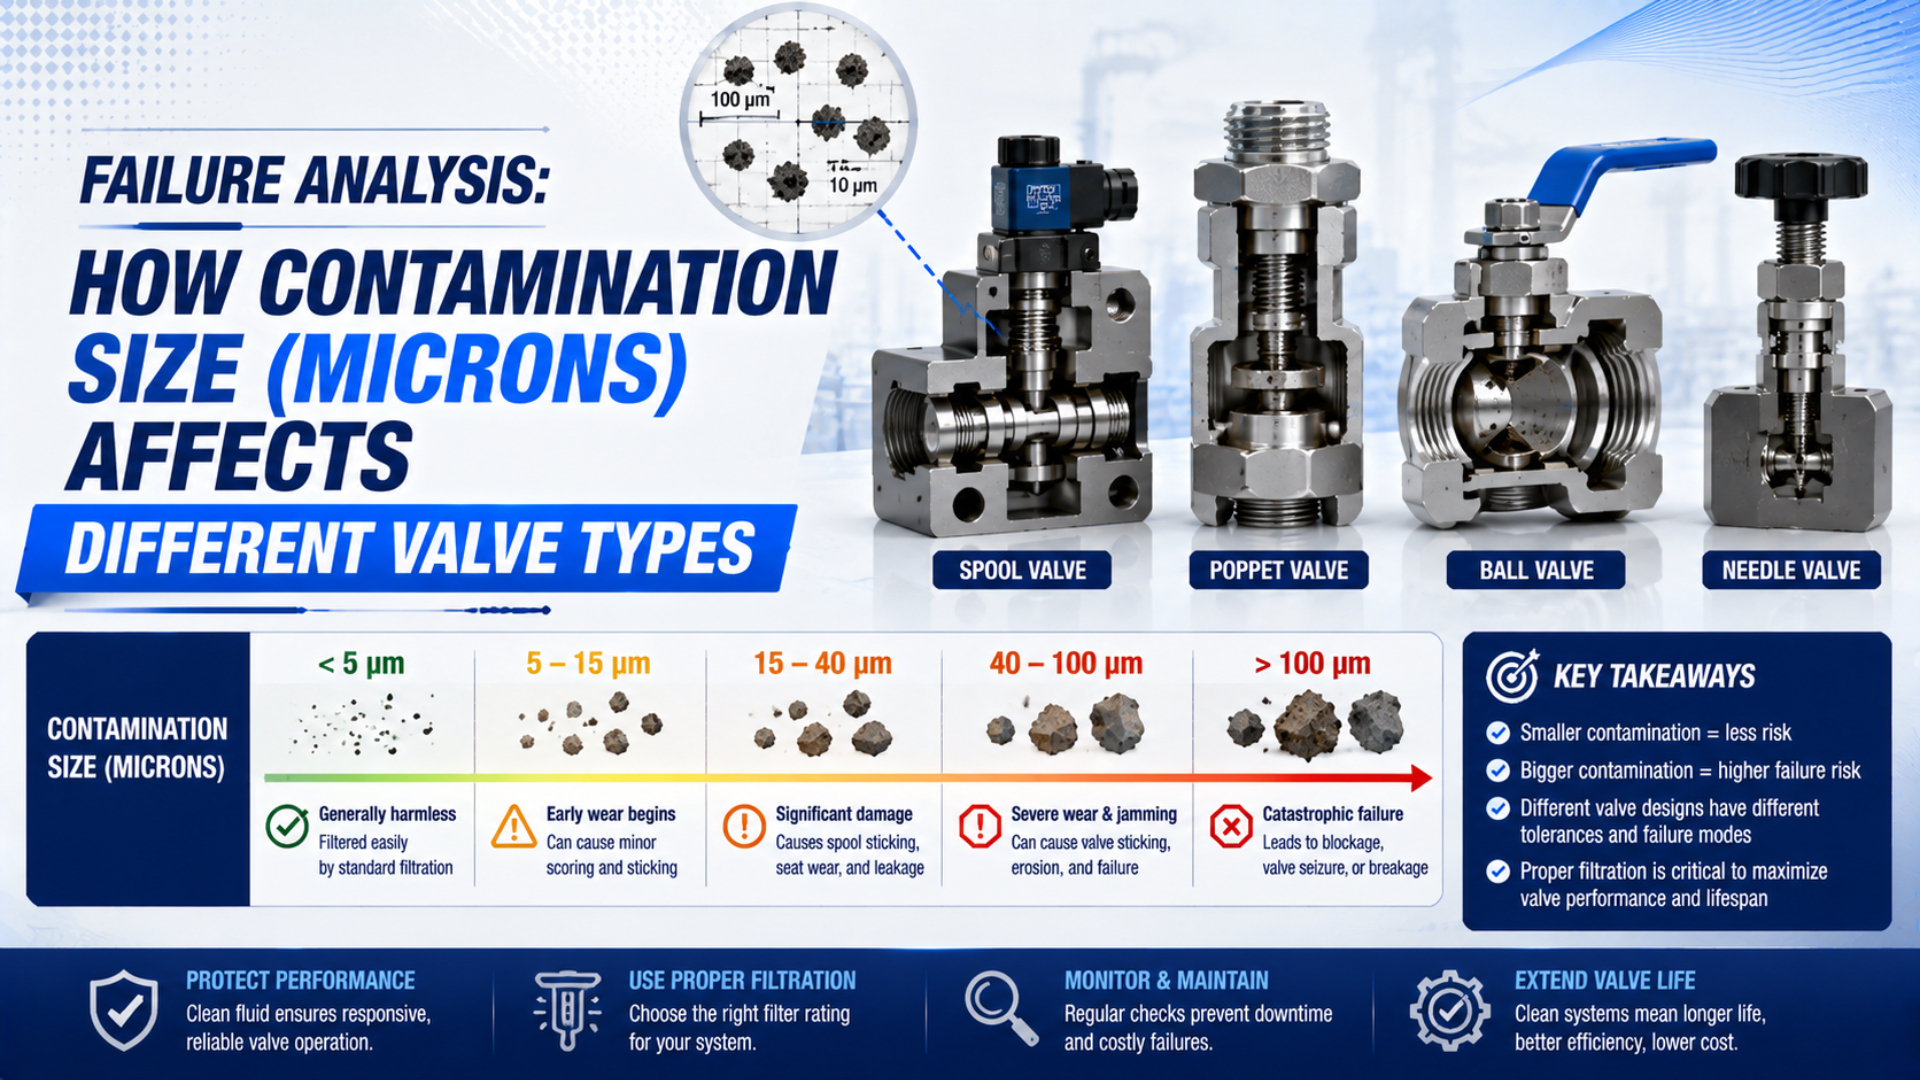
Valve contamination failure analysis is the process of matching a failed valve’s symptoms, internal geometry, residue, air-quality data, and operating history to a credible failure mechanism. Contamination size matters, but a micron value alone cannot prove whether a valve jammed, eroded, leaked, or lost pilot flow.
Why can the same contamination report accompany different failures? A particle that passes one valve’s main flow path may lodge in another valve’s pilot passage, interfere with a sliding seal, or sit on a poppet seat. Concentration, hardness, shape, moisture, oil film, pressure, and velocity change the result too.
Key Takeaways
- ISO 12500-3 identifies 2 particulate-filter test ranges, not universal valve-failure bands.
- Particle size must be compared with the selected valve’s working geometry and evidence.
- A filter micron label doesn’t specify water, oil, efficiency, pressure drop, or loaded condition.
- Preserve residue before cleaning or replacing the failed valve.
What Does Contamination Size Really Tell You About Valve Failure?
Particle size is one diagnostic variable, not a standalone failure limit. ISO 12500-3 identifies 2 filter test ranges, a fine range above 0.01 μm and below 5 μm, plus a coarse range from 5 μm through 40 μm. Those ranges describe filter testing, not guaranteed valve damage thresholds (ISO 12500-3, 2009).
A particle-size result becomes useful only after it is connected to four questions:
- Where was the sample taken? Compressor-room air, a branch header, a valve inlet, a filter bowl, and residue removed from a failed seat represent different boundaries.
- How many particles were present? One large chip and millions of fine particles can produce very different evidence even when both reports include the same maximum size.
- What was the particle made of? Hard metallic debris, soft seal fragments, pipe scale, desiccant dust, sticky varnish, and liquid droplets do not interact with surfaces in the same way.
- Which feature stopped working? A pilot restriction, spool land, elastomeric seat, diaphragm bleed passage, or exhaust silencer each creates a different failure path.
The original size bins often used in maintenance conversations can still describe hypotheses. Fine particles may enter small passages or contribute to surface wear. Larger particles may lodge at a seat or obstruct a restriction. Yet those words are not a diagnosis until the physical evidence agrees.
The most useful size comparison is local: compare the observed particle population with the valve feature that failed. A catalogue micron number belongs to the air or filter specification. A root-cause conclusion belongs to the actual pilot port, seat, sliding interface, seal, or exhaust path where function was lost.
For upstream prevention and ISO air-purity planning, use the separate guide on preventing contamination in pneumatic control valves. This article stays on the failure-analysis side of the boundary.
Why Does Valve Geometry Change the Failure Mode?
Valve geometry changes what contamination can reach and how it interrupts operation. ISO 8573-4 requires particle size and number concentration to be considered together and also addresses sampling limits and uncertainty. That measurement scope explains why a single “largest particle” value cannot represent every exposure or internal clearance (ISO 8573-4, 2019).
Five geometric features deserve separate inspection:
- Sliding interfaces: A spool and bore depend on free axial motion and controlled leakage across lands. Dry particles, sticky deposits, burrs, or incompatible lubricant can raise friction or score the sliding surfaces.
- Seats and poppets: A particle on the sealing line can hold a valve slightly open, create internal leakage, or mark a soft seat. The valve may still shift normally while failing its leakage requirement.
- Pilot passages: A small control path can lose signal before the main flow passage looks restricted. The symptom may resemble a weak coil, low pilot pressure, or slow response.
- Diaphragm bleed paths: Pilot-operated diaphragm valves depend on pressure balance and a controlled bleed path. Obstruction can stop opening, delay closing, or leave the valve in an intermediate condition.
- Exhaust hardware: A loaded silencer or contaminated exhaust passage raises backpressure. That can slow shifting or cylinder motion without leaving debris in the supply port.
This is why “particle larger than clearance” is too simple. Some valves use elastomeric seals that deform. Some particles arrive as clusters. Sticky residue can retain smaller particles until a larger deposit forms. A hard particle may scratch a surface during one shift, while a soft particle may compress and pass without lasting damage.
The article on spool versus poppet valve design explains the functional differences in more detail. Failure analysis should start from that construction, not from a generic valve icon.
How Do Different Pneumatic Valve Types Respond to Contamination?
Valve type changes exposure, but no family has one universal micron limit. Parker recommends a 5 μm-rated filter near its Isys H3 valve and calls foreign material a major breakdown cause, while Festo describes 40 μm and 5 μm standard filtration stages for air preparation. Both are product-context examples, not universal rankings (Parker; Festo).
| Valve construction | Contamination-sensitive feature | Early symptom | Stronger confirmation |
|---|---|---|---|
| Sliding-spool directional valve | Spool lands, bore, dynamic seals, pilot stage | Slow shift, incomplete shift, intermittent sticking | Directional scoring, sticky film, debris at land or pilot passage |
| Poppet or seat valve | Narrow sealing line and return mechanism | Internal leakage or failure to seal | Particle imprint, damaged soft seat, debris on sealing line |
| Pilot-operated valve | Pilot restriction, vent, small control volume | Main stage doesn’t switch despite adequate supply | Pilot pressure absent or slow at the main stage; residue in control path |
| Diaphragm valve | Bleed path, pilot seat, diaphragm sealing area | Delayed opening, delayed closing, incomplete opening | Blocked bleed path, diaphragm damage, contaminated pilot seat |
| Needle or one-way flow control | Adjustable restriction and check bypass | Changed cylinder speed or asymmetric motion | Debris at needle, restricted check, altered pressure across the device |
| Proportional valve | Metering edges, pilot stage, feedback or internal electronics enclosure | Deadband, drift, slow response, inconsistent output | Command, pressure, and flow trace plus internal inspection |
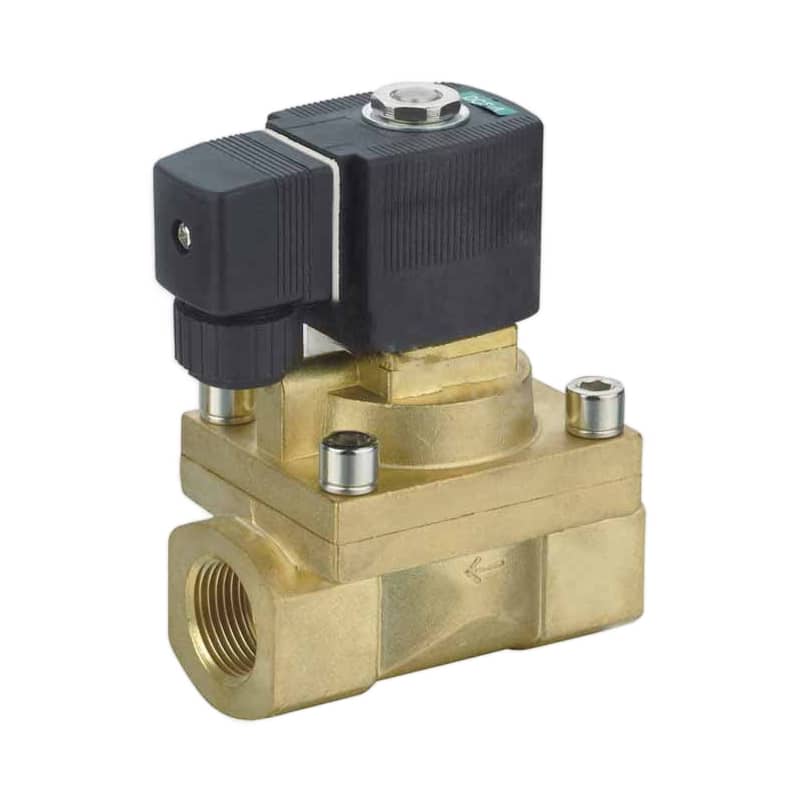
A pilot-operated diaphragm valve can lose function at the pilot seat or bleed path even when the main port appears large. Use the exact product section drawing and manual when tracing contamination.
A direct-acting valve removes one pilot stage, but it can still stick, leak, or fail electrically. A proportional valve may be more demanding because the application cares about small output changes, yet “more sensitive” must be tied to the manufacturer’s specified air quality, response test, and acceptance tolerance. The proportional-valve guide separates valve output from complete closed-loop motion.
Pilot-operated designs deserve a pressure measurement at the pilot port during the failed event. Supply pressure at the FRL doesn’t prove that the pilot path filled or vented. See the pilot-operated valve guide for the signal path.
What Evidence Separates Jamming, Blockage, Erosion, and Leakage?
Failure modes should be separated by observable evidence, not by 4 arbitrary micron bands. CAGI lists 10 common compressed-air contaminants, including rust, pipe scale, atmospheric dirt, water forms, oil forms, and microorganisms. Several can coexist, so a particle counter alone cannot identify every residue or source (CAGI Resource Library, 2026).
Jamming or sticking
The valve resists or fails to complete mechanical movement. Confirm command and pilot pressure first. Then look for scoring, transfer material, burrs, seal swelling, sticky varnish, dry residue, or a spool that does not move freely according to its service procedure. A coil fault, low voltage, or weak pilot signal can imitate contamination.
Passage blockage
The affected path has lost conductance, often in a pilot restriction, bleed passage, needle setting, or silencer. Compare pressure before and after the suspect path during the event. Removing debris without documenting its location destroys the strongest link between the deposit and the blocked function.
Erosive or abrasive wear
Wear is progressive surface loss, not simply the presence of small particles. Look for directional scoring, rounded metering edges, changed leakage, altered flow, embedded debris, and matching material upstream. A single teardown cannot establish wear rate without service history or prior measurements.
Seat leakage or seal damage
The valve reaches its commanded state but cannot isolate ports or hold pressure. Inspect the sealing line for a particle imprint, cut, dent, swelling, hardening, or chemical damage. Leakage can also come from incorrect assembly, overpressure, incompatible media, or a worn spring, so residue must agree with the damage pattern.
In our experience reviewing pneumatic failures, cleaning the valve too early causes the most avoidable evidence loss. Photograph both ports, record the failed state, retain the filter element and residue, and mark the orientation before solvent touches the component. The deposit location is often more useful than a later laboratory particle-size report with no location history.
How Should Particle Contamination Be Measured?
Use the measurement method that matches the question. ISO 8573-4 reports particle size and number concentration, while ISO 8573-8 covers solid-particle mass concentration. The two results are not interchangeable, and both standards address sampling, method limitations, evaluation, uncertainty, and reporting (ISO 8573-4; ISO 8573-8).
Start with a named location and operating state. Useful points include the compressor-room outlet, the end of the distribution header, immediately upstream of the valve group, before and after the final filter, and the failed component itself. Record pressure, temperature, flow condition, date, machine state, and recent maintenance.
Particle counting answers how many particles fall within reported size ranges at the sampled air point. It does not automatically identify material, hardness, shape, or origin. Microscopy, spectroscopy, magnetic response, residue chemistry, and comparison with upstream materials may be needed when source identity matters.
A teardown sample answers a different question. It shows what accumulated or lodged in one component, but the recovery process can bias the result. Large debris may be easy to see while fine particles remain in oil film. Solvent can dissolve varnish. A swab can add fibers. Document the recovery method.
Ask these questions before accepting a report:
- Was the sample representative of the failed operating condition?
- Was the sampling line clean, purged, and suitable for the particle range?
- Did condensation or evaporation alter the sample?
- Are results reported as number concentration, mass concentration, or residue composition?
- Is uncertainty stated, and were blank or background checks used where appropriate?
- Can the result be linked to the failed valve’s inlet or internal evidence?
Air sampling and teardown analysis establish different parts of causation. Inlet sampling shows exposure; teardown shows retention or damage. When both identify compatible material on the correct side of a filter or valve feature, the source-to-failure argument becomes much stronger than either result alone.
Which Filtration Data Belongs in the Specification?
A defensible filter specification needs more than one micron number. ISO 12500-3 uses 2 particle-size test ranges for compressed-air particulate filters and treats the result as a type test. Festo also warns that finer filtration can load quickly and increase pressure drop unless larger particles are removed in stages (ISO 12500-3; Festo).
Specify at least:
- filtration grade and the standard or manufacturer definition behind it
- removal efficiency or rated performance by particle size
- test flow, inlet pressure, temperature, and contaminant condition
- clean pressure drop and permitted loaded pressure drop
- corrected flow capacity at the real operating point
- bowl, drain, and differential-pressure indication
- element service limits and replacement criteria
- required ISO 8573 particle, water, and oil classes at the named point of use
“Absolute” and “nominal” are not enough by themselves. Their meaning depends on the supplier’s test method and stated efficiency. The absolute versus nominal filter rating guide explains how to compare the actual performance definition rather than relying on the label.
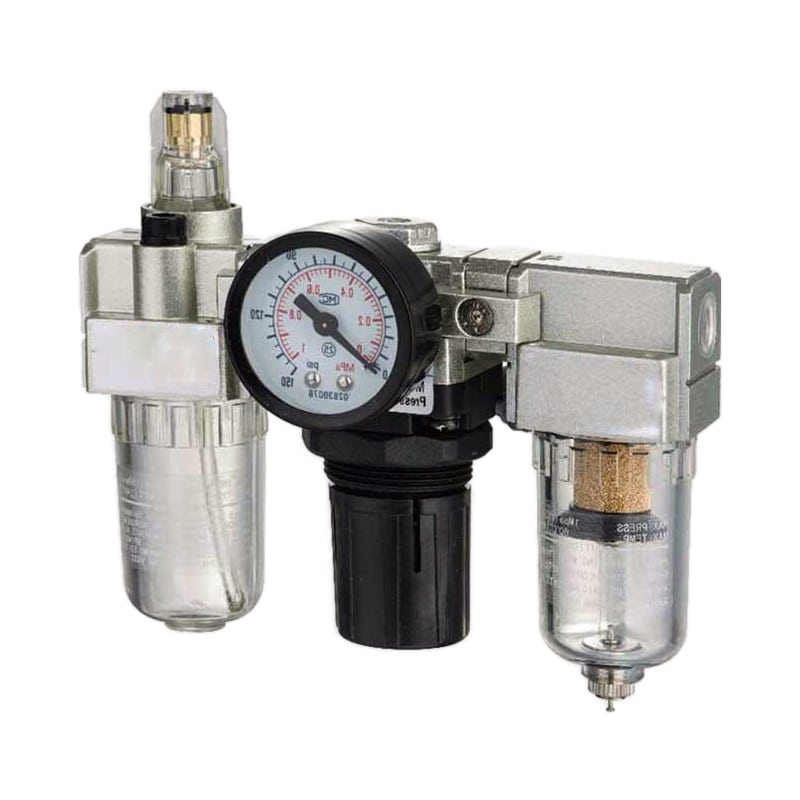
A point-of-use FRL can remove rated particles and regulate pressure, but it doesn’t automatically control water vapor, oil vapor, every aerosol, or contamination generated downstream. Lubrication must match the valve manufacturer’s policy.
ISO 8573-1 separates particles, water, and oil into three purity classifications. A particulate filter cannot set pressure dew point, and a dryer does not replace the final particulate stage. Review the ISO compressed-air quality guide and the coalescing-filter guide when water or oil aerosol is part of the evidence.
Generic orifice and pipe-loss calculations cannot replace product-specific filter efficiency, corrected-flow, loaded-pressure-drop, and air-purity data. Filter selection must use the manufacturer’s tested performance at the real operating condition.
A Six-Step Valve Contamination Failure Analysis
Use a 6-step sequence that protects evidence before changing hardware. ISO 8573-4 requires sampling and measurement limitations to be considered when reporting particle results, so the procedure must preserve location, operating state, and uncertainty alongside the micron data (ISO 8573-4, 2019).
- Freeze the failed condition. Record the command, coil voltage, pilot pressure, supply pressure, downstream pressure, timing, temperature, load, and machine state. Don’t cycle the valve repeatedly if doing so can dislodge evidence or create a hazard.
- Separate contamination from look-alike faults. Verify wiring, signal timing, minimum pilot pressure, exhaust backpressure, actuator binding, and mechanical interlocks. A contaminated-looking filter doesn’t prove the valve failure had the same cause.
- Map the contamination boundary. Inspect the final filter, drains, dryer status, distribution branch, recent piping work, exhaust environment, and any downstream source that can migrate backward.
- Preserve and inspect the valve. Photograph ports and orientation. Follow the manufacturer’s safe disassembly procedure. Collect dry debris, oil film, seal fragments, and damaged parts separately, then document where each sample came from.
- Measure the right property. Use number concentration for airborne particle population, mass concentration where appropriate, and material analysis for source identification. Compare upstream air, point-of-use air, filter residue, and valve residue only when sampling methods are compatible.
- Verify the corrective action. Replace or clean the failed component as permitted, correct the source, then repeat pressure, function, and air-quality checks under the same operating condition. Trend recurrence instead of declaring success after one clean cycle.
What should the corrective action target? If debris appears only after a downstream piping repair, adding a finer compressor-room filter may not help. If both inlet air and valve residue contain matching desiccant dust, the dryer afterfilter becomes a stronger suspect. If the valve is clean but pilot pressure collapses, correct the control path before blaming contamination.
Valve Contamination FAQs
These 5 answers keep particle size, measurement, filtration, and root cause separate. ISO 12500-3 divides compressed-air particulate-filter testing into 2 size ranges, while ISO 8573-4 and ISO 8573-8 distinguish number concentration from mass concentration. None establishes a universal particle size that destroys every valve (ISO 12500-3).
What particle size is most dangerous to a pneumatic valve?
There is no universal most-dangerous size. Risk depends on particle concentration, shape, hardness, moisture or oil film, flow velocity, and the geometry that must move or seal. Compare measured particles with the selected valve’s pilot passage, seat, sliding interface, and manufacturer air-quality requirement before assigning a failure mechanism.
Can a particle smaller than the valve clearance still cause damage?
Yes. Smaller particles can circulate through a sliding interface, accumulate in lubricant or sticky residue, contribute to abrasive wear, or gather into deposits. Conversely, a larger soft particle may deform and pass. Size must be interpreted with material, concentration, surface evidence, leakage, motion symptoms, and the valve’s actual construction.
Does a 5 μm filter protect every pneumatic valve?
No. Parker and SMC recommend 5 μm filtration for particular valve families, but that does not make it a universal requirement. Confirm the exact valve manual, filter efficiency definition, corrected flow, pressure drop, water and oil limits, lubrication policy, and contamination generated downstream of the final filter.
Should a filter be replaced only when differential pressure rises?
No. Differential pressure helps indicate particulate loading, but it does not directly prove outlet-air purity or remaining adsorption capacity. Use the manufacturer’s service limits together with differential pressure, element age, drain performance, bowl condition, air-quality measurements, and any exposure to oil, water, chemicals, or abnormal contamination events.
How can I prove contamination caused the valve failure?
Document the failed state, exclude electrical and pressure faults, preserve residue by location, and compare point-of-use air with the failed feature. The strongest conclusion links exposure, material identity, a credible valve mechanism, matching physical damage, and successful post-correction testing. Visible dirt alone is evidence of contamination, not proof of causation.
Engineering Conclusion
Reliable failure analysis separates 3 questions: what contamination reached the valve, which internal feature lost function, and whether the corrective action removed the cause. ISO 8573-1 likewise separates particles, water, and oil into independent purity classifications, reinforcing why one micron label cannot define the complete air condition (ISO 8573-1, 2010).
Start with the exact symptom and valve construction. Preserve the failed state, confirm command and pilot conditions, record residue location, and choose a compatible sampling method. Only then should particle size influence the diagnosis.
The design response may be staged filtration, a point-of-use filter, better drainage, dryer repair, cleaner assembly, different piping, exhaust protection, compatible lubrication, or a valve better suited to the environment. The right choice follows the evidence. It doesn’t follow a universal 5, 10, 25, or 40 μm rule.