

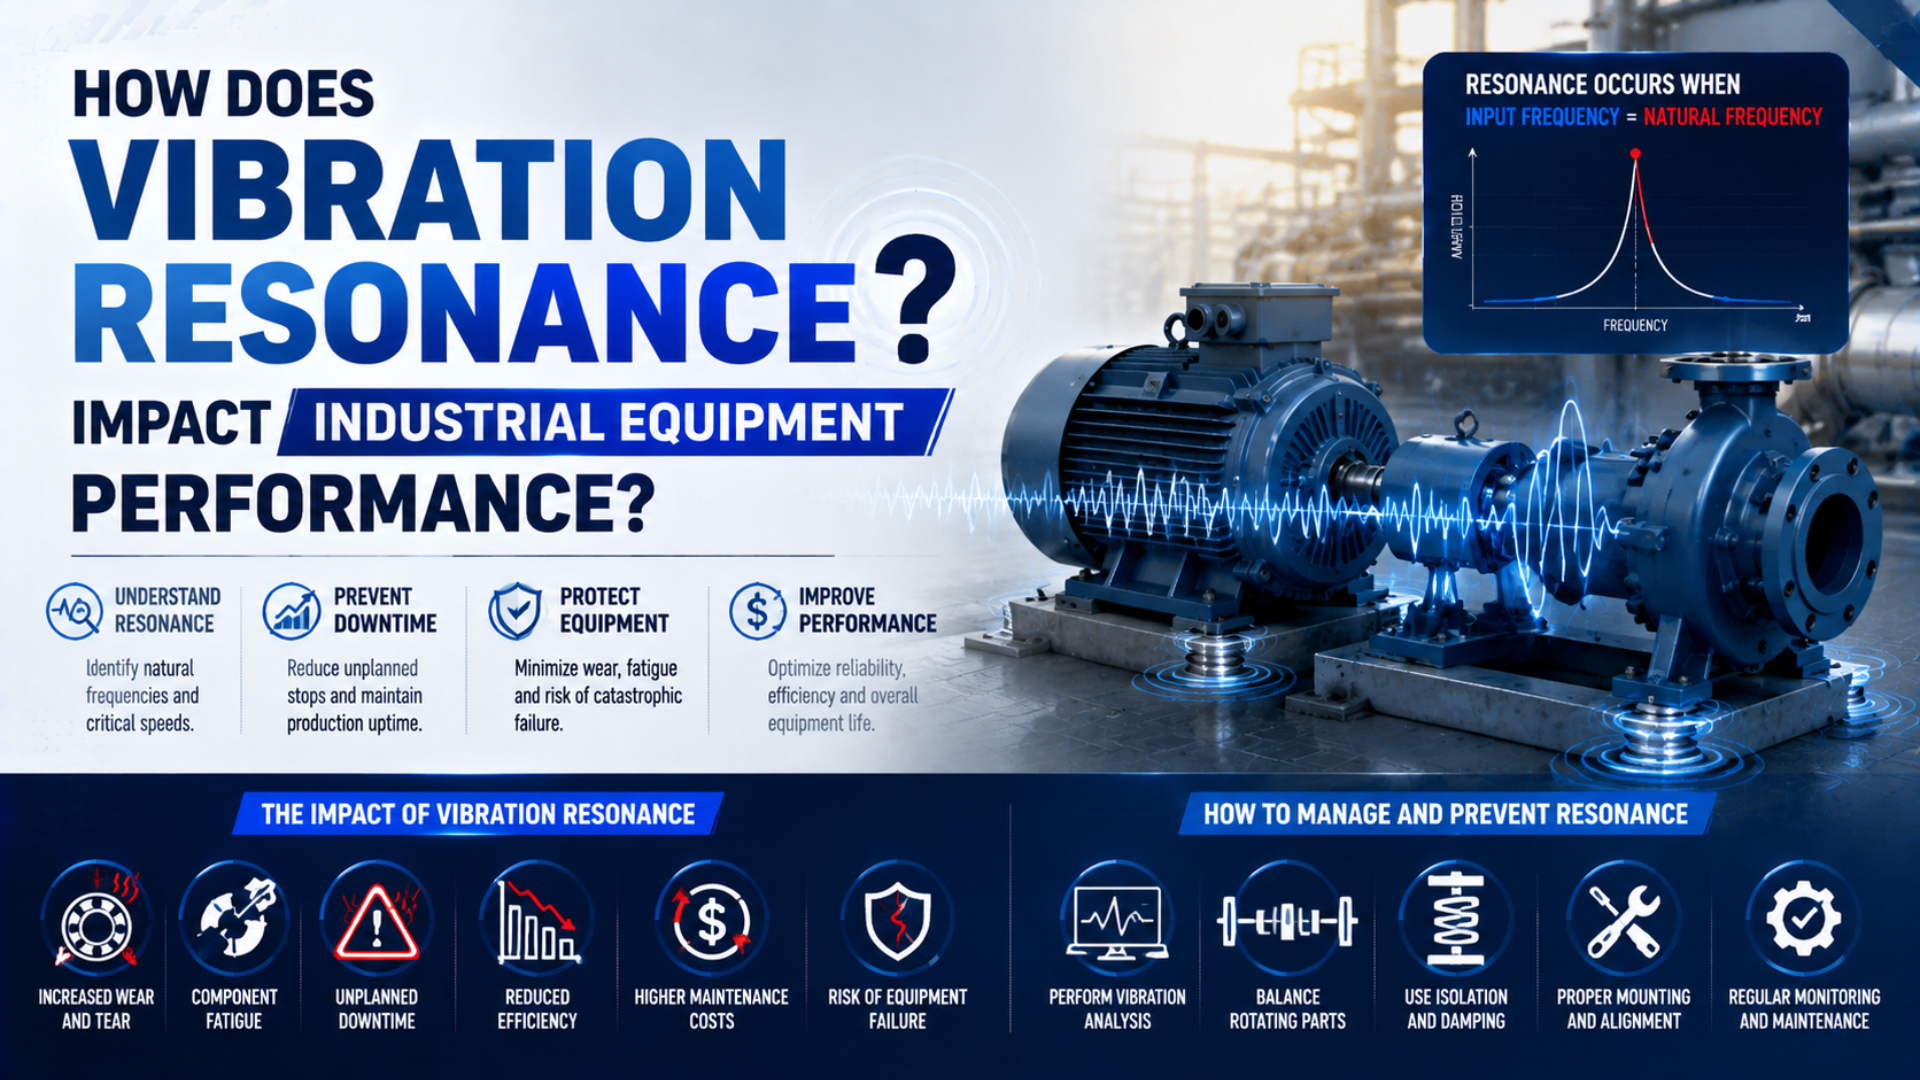
Vibration resonance is the frequency-selective amplification that occurs when a repeating force excites one of the assembled machine’s natural modes. In industrial equipment, the response can reduce positioning stability, loosen joints, overload guides and bearings, disturb pneumatic motion, increase noise, and accelerate fatigue. The forcing frequency, mode shape, damping, and operating state determine the actual severity.
Resonance is not a diagnosis made from visible shaking alone. A maintenance team needs a repeatable vibration signature tied to machine speed, cycle timing, location, direction, and operating condition. One overall vibration number cannot show whether the source is resonance, imbalance, impact, looseness, pressure fluctuation, or a control problem.
Key Takeaways
- ISO 13373 separates vibration work into measurement practice and data analysis.
- Siemens shows that 600 RPM equals a 10 Hz first-order excitation.
- Confirm resonance by tracking a narrow response peak as operating speed crosses it.
- Correct the forcing, mass, stiffness, damping, or transmission path, then repeat the same test.
For the separate task of calculating a pneumatic actuator’s natural frequency from chamber pressure, volume, area, and moving mass, use the pneumatic natural-frequency calculation guide. This article focuses on machine-level consequences and field diagnosis.
Vibration Resonance and Its Performance Impact
In a lightly damped single-degree-of-freedom model, the response at resonance is approximately , so a damping ratio of 0.05 gives a peak magnification near 10. NASA uses this relationship to show why damping limits an otherwise sharp resonant response (NASA vibration-testing guidance, 2017).
Here, is the approximate resonant magnification and is the dimensionless damping ratio. This simple relationship explains the mechanism; it does not predict the vibration level of an assembled production machine without measured forcing, mode shape, and boundary conditions.
Resonance raises alternating loads rather than only producing an annoying sound. A bracket can bend more at one frequency, a carriage can rock on its guides, or a sensor mount can move enough to corrupt a position signal. The same measured acceleration can also mean different stress at different locations because each mode has its own deformation pattern.
Equipment performance can change in several ways:
- position repeatability deteriorates at one speed or cycle rate;
- fasteners, fittings, guards, or electrical connectors loosen repeatedly;
- guide blocks, bearings, seals, or couplings develop localized wear;
- a camera, gauge, or proximity sensor returns unstable data;
- end-of-stroke impact becomes harsher because the structure is already moving;
- product quality changes only within a narrow operating-speed band.
The model-derived curves below use the standard forced-response relationship presented in MIT’s vibration course material. They show why there is no universal “optimal damping ratio” for all machines (MIT OpenCourseWare, 2007).
Which Symptoms Point to Resonance Rather Than General Vibration?
ISO 20816-1 evaluates machine vibration through two broad indicators: vibration magnitude and change in vibration. A resonance suspicion becomes stronger when the amplitude rises sharply within a narrow speed or cycle band and falls again after the operating point passes through it (ISO 20816-1, 2016).
A high overall reading at every speed may indicate a persistent fault or poor measurement location. Resonance usually has a frequency-selective pattern. The structure responds much more strongly when an excitation crosses one mode, although nonlinear contact, variable load, or control behavior can widen or shift the peak.
Look for repeatable evidence:
- the symptom starts and stops at similar RPM, cycle rate, or valve timing;
- one direction or one measurement location rises much more than the others;
- vibration increases during run-up and drops after the machine passes the critical band;
- changing payload, mounting stiffness, air pressure, or actuator position moves the peak;
- a narrow frequency component dominates while the problem is present;
- quality or positioning errors track the same operating band.
Visible vibration alone is not enough. A guard panel can look dramatic because it is light and flexible while the load-carrying frame remains acceptable. Conversely, a small displacement at a stiff joint can still create high alternating force. Record the measurement quantity and location instead of ranking severity by sight or sound.
Separate self-excited machine behavior from environmental loading. The high-G shock and vibration selection guide covers externally imposed qualification conditions, while the high-speed stamping vibration guide addresses repeated press-cycle exposure.
Resonance, Imbalance, Misalignment, Looseness, and Impact Are Different Faults
NI separates four useful signal patterns: long-duration narrow-band behavior, short wide-band transients, decayed resonance, and speed-dependent signals such as imbalance. The same overall vibration value can therefore hide different mechanisms, which is why time waveform, spectrum, RPM, and process timing should be reviewed together (NI, 2026).
| Observation | More consistent with | What to test next |
|---|---|---|
| narrow amplitude peak crossed during speed sweep | resonance | track frequency, amplitude, and phase through run-up or coast-down |
| strong component follows 1× shaft speed | imbalance or speed-synchronous forcing | compare radial directions and balance evidence |
| strong 2× component with axial motion | possible misalignment | inspect coupling, soft foot, alignment, and phase |
| multiple harmonics with unstable waveform | looseness, clearance, or rub | inspect joints, fits, base, and contact marks |
| short broadband spikes at repeatable times | impact or collision | align time waveform with valve, product, or end-stop event |
| oscillation changes mainly with controller gain | control-loop instability | review feedback, deadband, sampling, valve behavior, and tuning |
These are screening patterns, not automatic diagnoses. A loose structure can create a resonance, and imbalance can provide the force that excites it. More than one fault may be present.
The useful distinction is source versus response. Imbalance, valve switching, repeated impacts, and motion commands are possible sources. Resonance is the frequency-selective response of the assembled system. Rebalancing the source and changing structural damping solve different parts of that chain.
If pressure at the actuator rises and falls with the symptom, also compare the evidence with the pneumatic pressure-fluctuation guide. A pressure oscillation can be an excitation source without proving that the machine structure is resonating.
Which Measurements Confirm a Resonance Hypothesis?
ISO 13373-1 lists twelve procedural elements for vibration monitoring, including measurement method, parameter, transducer selection, location, attachment, data collection, operating condition, signal conditioning, and continuous or periodic monitoring. This breadth explains why an isolated handheld reading cannot establish a resonant mode by itself (ISO 13373-1, 2002, confirmed 2024).
Use a controlled field sequence:
- Define the fault state. Record product, payload, actuator position, pressure, temperature, RPM, cycle rate, and control mode.
- Choose repeatable points. Measure near bearings, guides, mounting feet, actuator brackets, and the affected tool or sensor.
- Capture three directions. Axial, horizontal, and vertical data help reveal the active motion.
- Synchronize a reference. Record shaft tachometer, encoder, PLC command, valve signal, or cylinder position with vibration.
- Save time and frequency data. A spectrum shows frequency content; the time waveform shows impacts, clipping, modulation, and timing.
- Change one variable safely. Sweep speed, change payload, adjust pressure, or stiffen one temporary support under an approved test plan.
- Repeat the baseline. A proposed fix is credible only when the same operating state improves.
Phase helps distinguish motion patterns. Fluke notes that vibration phase is commonly checked at a particular frequency such as rotational rate, a system resonance, or an external excitation frequency (Fluke, 2026).
Do not perform a bump test, speed sweep, temporary stiffening, or intentional excitation without an approved risk assessment. Resonance testing can deliberately increase response near a critical mode.
How Do Running Speed and Machine Cycle Create Excitation?
Siemens demonstrates that 600 RPM corresponds to 10 Hz and 6000 RPM to 100 Hz for a first-order rotating event. Order analysis connects measured vibration to shaft speed, blade pass, gear mesh, piston events, or other events per revolution rather than treating every spectral peak as stationary (Siemens, 2026).
The relationship is:
is excitation frequency in hertz, is the order or events per revolution, and is rotational speed in revolutions per minute. For a 6-blade fan at 6000 RPM, the shaft frequency is 100 Hz and the blade-pass component is 600 Hz, or sixth order.
For non-rotating pneumatic machinery, replace RPM with the relevant event rate. A cylinder cycling twice per second creates a 2 Hz fundamental event rate, but its acceleration profile, valve switching, impacts, and product contact can contain higher harmonics. The strongest structural response may occur at one of those harmonics rather than at the basic cycle frequency.
Define the frequency ratio as:
is the excitation frequency and is a natural frequency of the installed system. A value near one identifies a possible crossing, not proof of harmful resonance. Damping, force amplitude, mode shape, measurement position, and nonlinear contact still control the response.
Pneumatic Actuators Can Excite or Shift a Machine Mode
A published pneumatic-cylinder model treats the two closed chambers as two air springs acting on one moving mass. That boundary condition changes when a valve connects a chamber to supply or exhaust, so pressure, piston position, dead volume, valve state, and tubing can all shift the actuator’s dynamic contribution (Doll, Neumann, and Sawodny, 2015).
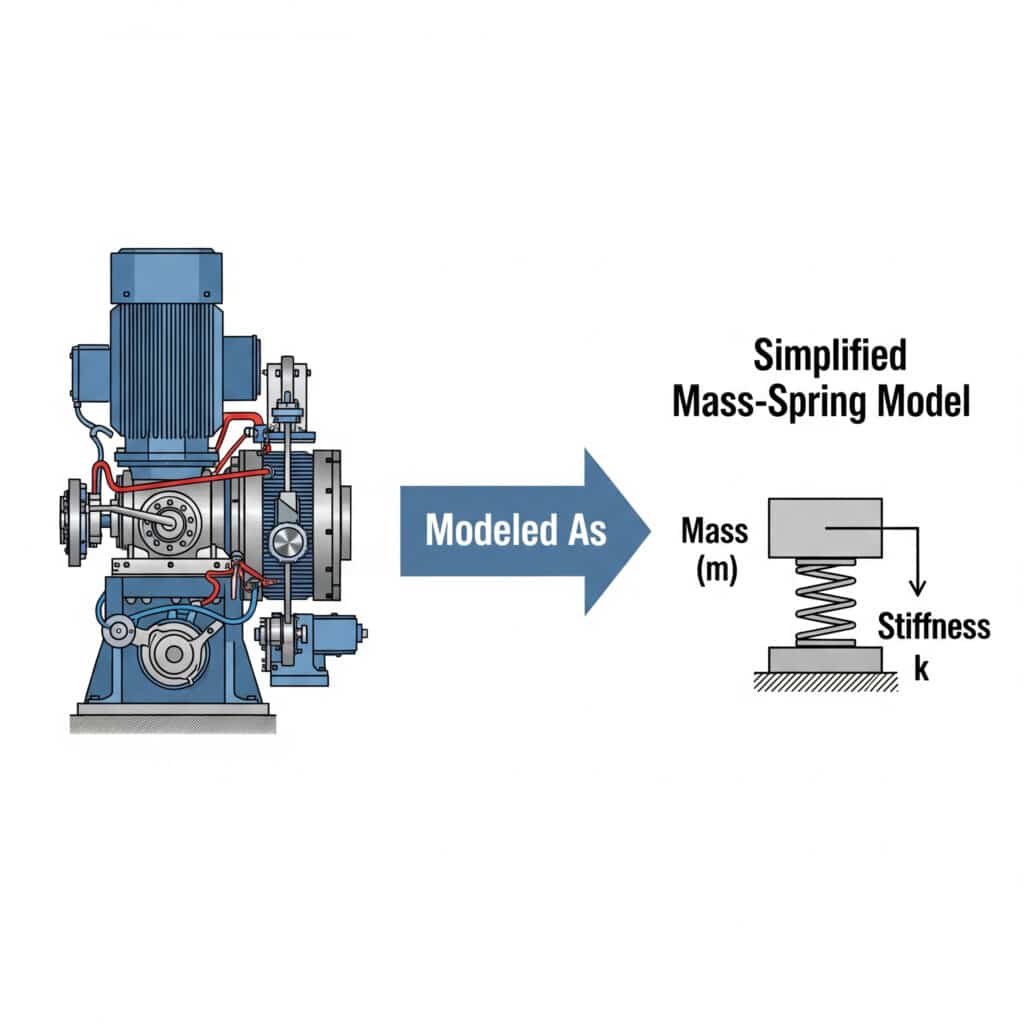
The image is a screening abstraction. A real actuator and machine can have several masses, compliant mounts, guides, joints, frame modes, friction, controller dynamics, and pressure-dependent stiffness.
A pneumatic axis can participate in vibration through:
- periodic acceleration and deceleration of the payload;
- valve switching and rapid chamber pressure changes;
- impact at the workpiece or end of stroke;
- carriage or tooling mass changing the structural mode;
- trapped-air stiffness changing with piston position;
- mounting compliance, load offset, or insufficient guidance;
- long tubing and control delay changing the excitation timing.
What should change during a controlled test? If the vibration peak moves when chamber pressure or piston position changes, pneumatic stiffness may be involved. If payload changes move the peak, effective mass is important. If the peak remains fixed but its amplitude changes with cycle timing, the actuator may be exciting a structural mode without defining its natural frequency.
In our experience, the cleanest A/B test changes one physical input at a time. Changing payload, pressure, speed, and mounting together may reduce the symptom, but it hides which mechanism actually moved the response.
Do not use cushioning as a universal resonance fix. Cushioning addresses end-of-stroke energy, while a machine mode can be excited anywhere in the motion. Compare the symptoms with the pneumatic cushioning guide and the load-mass versus cushioning-capacity guide when impact is the dominant event.
Which Correction Should You Apply First?
NASA’s structural standard identifies four modal parameters before response analysis: natural frequencies, mode shapes, modal mass, and modal damping. This framework prevents a common maintenance error: adding a damper or mass before identifying which mode is active and where the structure actually moves (NASA KSC-STD-Z-0004, 2021).
Choose a correction that targets the evidence:
| Intervention | What it changes | Appropriate evidence | Main caution |
|---|---|---|---|
| change speed or cycle profile | forcing frequency and harmonic content | narrow problem band crossed during operation | may move excitation into another mode |
| balance, align, or remove impact | forcing amplitude | source-specific order or timed transient | resonance may remain but receive less energy |
| stiffen bracket or shorten span | natural frequency and mode shape | measured motion concentrated at compliant support | added stiffness can transfer load elsewhere |
| change payload or moving mass | natural frequency and inertia | peak shifts when load changes | affects actuator force, guides, braking, and structure |
| add damping | resonant peak amplitude | active mode and attachment location are known | damper performance may vary with temperature and frequency |
| add isolation | transmission path | source and receiver are identified | isolation can amplify motion below its effective range |
| revise mounting or guidance | stiffness, alignment, and load path | rocking, offset load, or mount motion is measured | must retain pressure-boundary and structural integrity |
The safest correction often removes excitation before modifying the structure. If imbalance or repeated impact is the forcing source, repairing that source reduces input across several modes. Structural changes become appropriate when the source is necessary and the active mode has been identified.
For pneumatic installations, verify mounting flatness, fastener condition, guide alignment, and load offset before changing cylinder hardware. The rodless-cylinder mounting guide and actuator alignment guide cover those static checks.
Validation Requires the Same Operating State
ISO 13373-2 organizes common vibration analysis around two basic domains, time and frequency, and also covers refinement by changing operating conditions. A valid before-and-after comparison therefore needs the same sensor points, attachment, units, load, speed profile, pressure, temperature, and control state (ISO 13373-2, 2016).
A lower overall RMS value is not enough if the critical narrow-band peak increased. Review at least:
- overall value in the same frequency band;
- spectrum and order components;
- time waveform for impacts and clipping;
- phase at the frequency of interest;
- run-up or coast-down peak location;
- product quality, position error, cycle time, and actuator pressure;
- fastener, guide, seal, bearing, and temperature condition after the test.
Define acceptance before changing the machine. Use applicable equipment-specific standards, manufacturer limits, historical baseline, product requirement, and structural review. ISO 20816-1 is general guidance; it does not create one universal vibration limit for every cylinder, bracket, motor, or machine.
Trend both magnitude and change. A machine can remain below a generic alarm while deteriorating rapidly from its own baseline. It can also exceed an unsuitable generic threshold while operating normally for its design. Document the measurement method and its limitations.
What Should the Maintenance Record and RFQ Include?
ISO 13373-1 requires the operating condition, transducer location, attachment, measurement parameter, and data-collection method to be defined. Those five fields are the minimum context needed to compare surveys or ask a supplier to review an actuator, mounting, guide, damper, or structural modification (ISO 13373-1, 2002).
Record:
- asset, assembly, and component part numbers;
- machine state, product, payload, position, pressure, temperature, and cycle;
- RPM or event-rate reference and synchronization channel;
- sensor model, calibration status, direction, point, and mounting method;
- sampling rate, duration, frequency span, window, averaging, and units;
- overall, spectrum, order, waveform, phase, and run-up/coast-down files;
- photographs or drawings showing sensor and load locations;
- modification made, engineering approval, and test risk controls;
- same-state before-and-after results;
- remaining concerns and acceptance authority.
For a pneumatic supplier, add bore, stroke, moving mass, speed profile, valve and tube details, mounting, guide arrangement, load-center geometry, cushioning or shock-absorber configuration, and the frequency band of concern. “The cylinder vibrates” is not enough for a reliable review.
A maintenance plan should also connect the vibration record with parts evidence. The predictive-maintenance spare-parts guide explains how to turn condition indicators into a defensible replacement and stocking decision.
Vibration Resonance FAQs: What Should Buyers Ask?
NASA’s simple base-excited model places the transition to vibration isolation above approximately 1.41 times natural frequency, but only under its stated single-mode assumptions. That example captures the recurring FAQ answer: frequency ratios are useful screening tools, while real equipment decisions require measured modes, damping, forcing, and installation data (NASA, 2017).
Is every large vibration peak a resonance?
No. Impact, looseness, imbalance, misalignment, rub, pressure variation, and control instability can also create high vibration. Resonance is more likely when a narrow response peak appears as excitation crosses a repeatable frequency and when changing mass, stiffness, pressure, or position moves that peak. Confirm the pattern at repeatable sensor points.
Can I identify resonance with one handheld vibration reading?
Usually not. ISO 13373-1 emphasizes measurement parameter, sensor location, attachment, operating condition, and data collection. Confirm the pattern with repeatable points, synchronized speed or cycle data, a time waveform, spectrum, and preferably a controlled run-up, coast-down, or operating-condition change. Preserve the raw data and exact machine state for comparison.
Will adding mass always reduce resonance?
No. Added mass generally lowers a mode’s natural frequency, but it can move the mode into another excitation band, increase actuator force, overload guides, or change the mode shape. Add or remove mass only after identifying the active mode and checking the complete mechanical and pneumatic load path, mounting capacity, braking demand, and operating-speed range.
Can cylinder cushioning eliminate machine resonance?
Not necessarily. Cushioning manages energy near the end of stroke. Resonance can be excited by mid-stroke acceleration, valve switching, product contact, rotating equipment, or a structural mode. Check whether the vibration is a timed impact or a frequency-selective response before changing the cushion setting, speed control, shock absorber, or motion profile.
When should a vibration specialist or structural engineer be involved?
Escalate when the test requires deliberate excitation, the response threatens a pressure boundary or safety function, several modes overlap, cracks or fastener movement are present, operating limits are unknown, or a structural modification is proposed. Resonance diagnosis and modal testing require qualified personnel, calibrated equipment, documented test boundaries, and controlled risk.
Sources and technical references
- ISO 20816-1:2016, Measurement and evaluation of machine vibration. Retrieved 2026-07-27.
- ISO 13373-1:2002, Vibration condition monitoring, general procedures. Confirmed in 2024; retrieved 2026-07-27.
- ISO 13373-2:2016, Processing, analysis and presentation of vibration data. Retrieved 2026-07-27.
- NASA, Vibration Testing of Small Satellites, Part 1. Retrieved 2026-07-27.
- NASA KSC-STD-Z-0004, Structural design and analysis. Retrieved 2026-07-27.
- MIT OpenCourseWare, forced vibration response. Retrieved 2026-07-27.
- NI, Vibration Analysis and Signal Processing. Retrieved 2026-07-27.
- NI, Order Analysis Example. Updated 2025; retrieved 2026-07-27.
- Siemens Simcenter, What’s an Order?. Retrieved 2026-07-27.
- Doll, Neumann, and Sawodny, Dimensioning of Pneumatic Cylinders for Motion Tasks. Retrieved 2026-07-27.
- Fluke, Phase in Vibration Analysis. Retrieved 2026-07-27.