

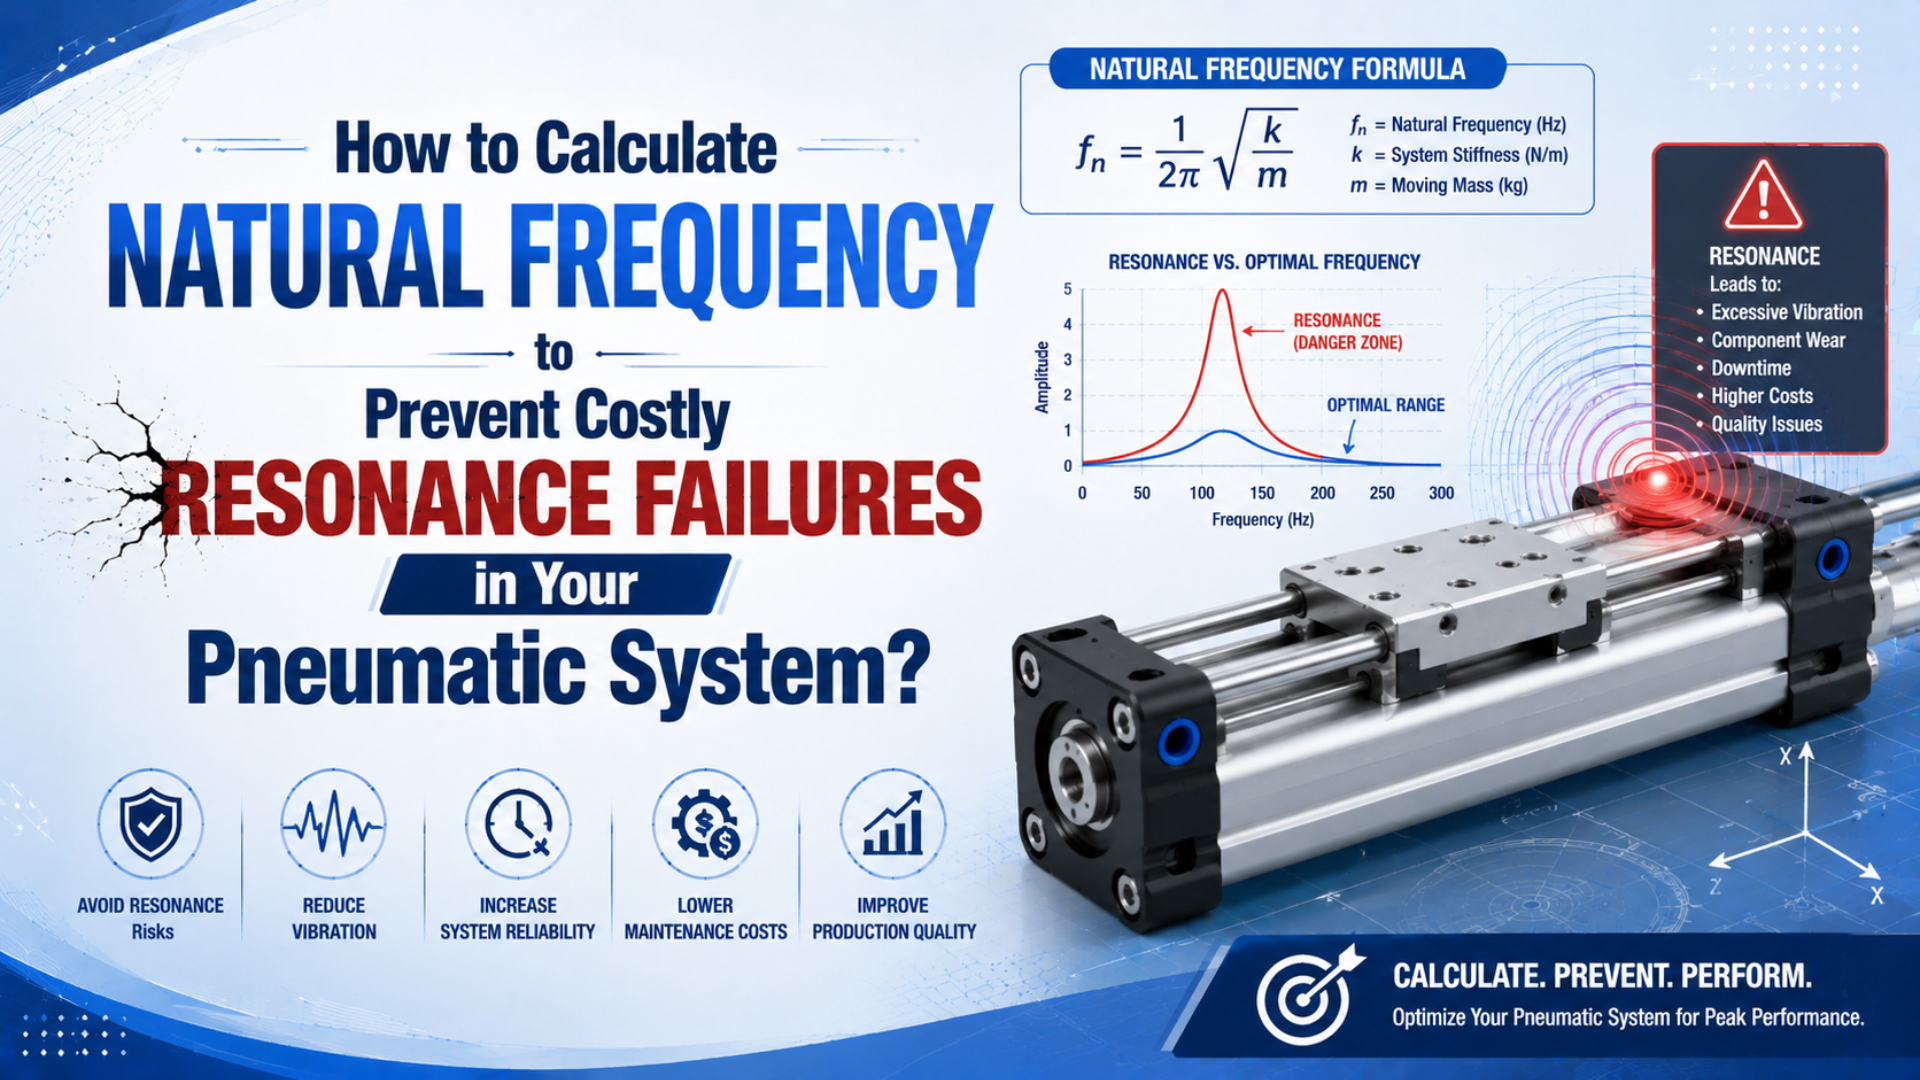
Pneumatic cylinder natural frequency is the free-oscillation rate of the cylinder, moving load, and connected structure around a defined operating state. For an initial screening model, determine both chamber areas and volumes at a stated piston position, use absolute chamber pressures, calculate total pneumatic stiffness, then apply the mass-spring natural-frequency equation.
That result is not a universal cylinder rating. Valve state, tubing volume, mounting compliance, friction, structural modes, control-loop behavior, load changes, and piston position can all move the measured response. The calculation is most useful when its assumptions are written down and its prediction is checked on the assembled machine.
Key Takeaways
- A double-acting cylinder behaves as 2 pneumatic springs when both chambers are closed.
- Pressure must be absolute, and each chamber volume must include dead volume.
- In the worked example, the predicted frequency changes from 4.82 Hz at mid-stroke to 6.83 Hz near one end.
- Damping and excitation frequency determine whether a natural frequency becomes a damaging resonance.
For the static load check that comes before any dynamic model, see our cylinder force formula guide. If the machine is hitting the end cap rather than oscillating around a position, use the pneumatic cylinder cushioning guide instead.
Start With the Correct Pneumatic Model
Doll, Neumann, and Sawodny model a pneumatic cylinder as 1 moving mass connected to an air spring, with both chambers closed so the compressed-air mass in each chamber remains constant (Dimensioning of Pneumatic Cylinders for Motion Tasks, 2015). Those boundary conditions define the screening calculation used here.
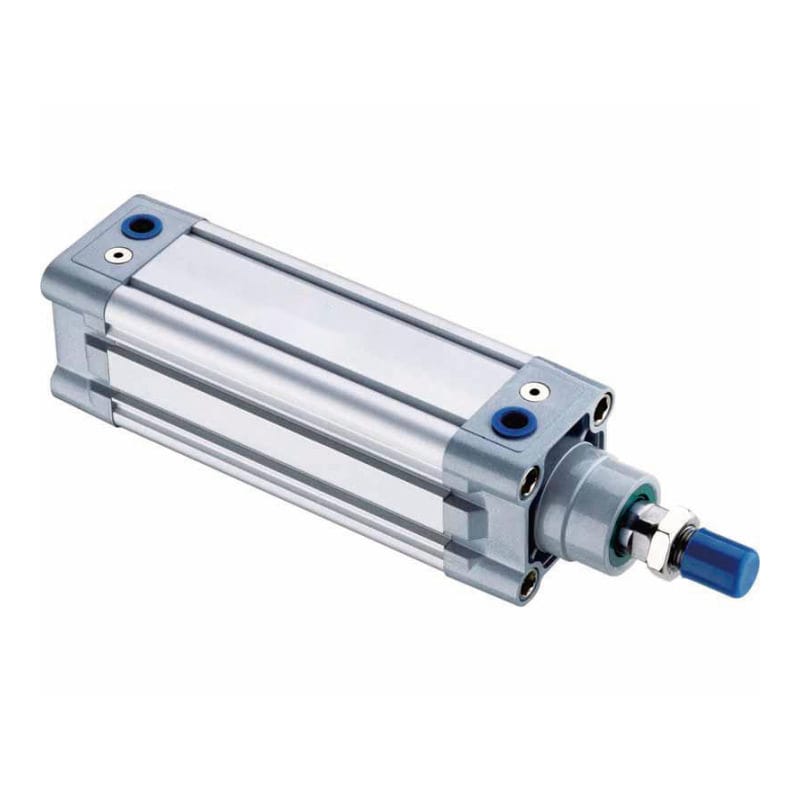
A real directional valve changes the model. If a valve connects one chamber to supply and the other to exhaust, chamber mass is no longer fixed. A servo valve and controller can add effective stiffness and damping, while a long tube or reservoir adds volume and flow dynamics. State the valve condition before quoting a frequency.
The simplest useful model has these elements:
- chamber 1 pressure, area, and total volume;
- chamber 2 pressure, area, and total volume;
- the piston, rod or carriage, payload, and other mechanically moving mass;
- damping from friction, seals, guides, flow paths, and attached structures;
- any mechanical stiffness that truly acts in parallel with the pneumatic stiffness.
Don’t add every nearby component to one stiffness number. A bracket bending in series with the cylinder, for example, reduces the combined stiffness. A parallel return spring adds stiffness. A flexible frame may create a separate mode that needs a multi-degree-of-freedom model or finite-element analysis.
The most useful first question is not “What is this cylinder’s natural frequency?” It is “Which physical state and which mode are we calculating?” A cylinder at mid-stroke with blocked ports is a different dynamic system from the same cylinder moving through a metering valve.
How Do You Calculate Chamber Areas and Volumes?
An experimental double-acting-cylinder model uses 2 effective piston areas and defines each chamber volume as inactive end volume plus the position-dependent swept volume (Experimental Study of Double-Acting Pneumatic Cylinder, 2020). That structure prevents a common error: using full piston area and full stroke volume on both sides.
For a single-rod cylinder with bore diameter and rod diameter :
is the cap-end effective area and is the rod-end annular area, both in square metres when diameters are entered in metres. A rodless cylinder normally uses equal effective areas only when its internal construction supports that assumption.
At piston position , measured from the cap end, the chamber volumes are:
is total stroke in metres. and are the inactive volumes on each side, including end-cap cavities, ports, fittings, sensor passages, and any connected tube volume that remains part of the trapped gas. Enter all volumes in cubic metres.
Tube volume is easy to underestimate. A remote valve or a long hose increases the compressed volume without increasing piston area, which lowers pneumatic stiffness. The pneumatic tube volume calculator can help quantify that input, but it does not calculate natural frequency.
Use absolute pressure in the stiffness equation. Convert a gauge reading by adding local atmospheric pressure, with compatible units. A nominal 6 bar gauge supply is approximately 7 bar absolute near sea level, but the actual chamber pressures while holding or moving may differ from the regulator setting.
How Do You Calculate Pneumatic Stiffness and Natural Frequency?
Czmerk’s double-acting-cylinder analysis shows that passive stiffness changes along the stroke and that dead volumes matter near the end positions (Increasing of Stiffness of Double-Acting Pneumatic Cylinder, 2015). Pneumatic stiffness is the incremental restoring force per unit piston displacement around a defined state. Linearizing both closed chambers gives this model.
is pneumatic stiffness in newtons per metre. and are absolute chamber pressures in pascals. and are effective areas in square metres. and are total compressed volumes in cubic metres. The dimensionless polytropic exponent describes heat transfer during the small pressure-volume change.
For idealized gas behavior, represents an isothermal process and an adiabatic process; intermediate conditions fall between them (Neural Network Modeling of Air Spring Dynamic Stiffness Based on Its Pneumatic Physics, 2026). That source studies air springs, so use the range as gas-process guidance, not as a universal cylinder test value. If no validated value exists, run a sensitivity check instead of hiding the assumption.
If a mechanical spring acts in parallel, its stiffness can be added to . Do not simply add frame, bracket, coupling, or guide stiffness unless the load path proves they are parallel. Call the correctly combined result .
The undamped natural frequency is:
is in hertz, is in newtons per metre, and is in kilograms. Effective mass normally includes the payload, piston and rod or carriage, tooling, and the appropriate moving fraction of flexible links. Do not add the compressed-air mass as though it translates rigidly with the load.
For a lightly damped single-mode estimate, the damped free-vibration frequency is:
is the damping ratio. This relationship is useful only when one mode dominates and damping can be represented approximately as viscous. Seal friction and stick-slip are nonlinear, so low-speed behavior may not fit this model.
Worked Example: A 63 mm Bore Cylinder at Mid-Stroke
Using the 2-chamber equations above, a 63 mm bore, 20 mm rod, 400 mm stroke, 25 kg effective mass, 50 cm³ dead volume per side, 7 bar absolute chamber pressure, and gives a predicted mid-stroke natural frequency of 4.82 Hz. This is a model result, not a catalog rating.
Assume the piston is at and ignore additional mechanical stiffness for this first pass.
| Input | Value |
|---|---|
| Bore diameter, | 0.063 m |
| Rod diameter, | 0.020 m |
| Stroke, | 0.400 m |
| Position, | 0.200 m |
| Dead volume per chamber | 0.000050 m³ |
| Absolute pressure in each chamber | 700,000 Pa |
| Polytropic exponent, | 1.2 |
| Effective moving mass, | 25 kg |
The calculated areas are and . The total chamber volumes at mid-stroke are and .
The two chamber stiffness contributions are approximately 12,120 N/m and 10,809 N/m:
Substituting the 25 kg effective mass:
What if the effective mass doubles while stiffness stays unchanged? Natural frequency falls by the square root of the mass ratio, so the new value is approximately . Conversely, reducing mass without checking excitation can move a resonance upward into another operating harmonic.
Treat the spreadsheet as a sensitivity model. Change one uncertain input at a time, including dead volume, , chamber pressure, moving mass, and structural stiffness. A single neat answer can be less useful than a defensible frequency range that exposes which measurement matters most.
Why Does Natural Frequency Change Across the Stroke?
For a rodless cylinder with equal dead volumes and equal chamber pressure, Doll and colleagues identify the mid-position as the minimum-stiffness point in their simplified model (Dimensioning of Pneumatic Cylinders for Motion Tasks, 2015). A single-rod cylinder is asymmetric, but its two chamber volumes still change continuously with piston position.
Using the same worked-example inputs at 5 positions produces this model-derived result:
| Position from cap end | Pneumatic stiffness | Predicted natural frequency |
|---|---|---|
| 50 mm | 46,051 N/m | 6.83 Hz |
| 100 mm | 29,974 N/m | 5.51 Hz |
| 200 mm | 22,929 N/m | 4.82 Hz |
| 300 mm | 28,267 N/m | 5.35 Hz |
| 350 mm | 41,863 N/m | 6.51 Hz |
The minimum in this example is near mid-stroke because both compressed volumes are relatively large there. Near an end, one chamber becomes small and its stiffness contribution rises sharply. Real pressures may be unequal, and unequal dead volumes can shift the minimum.
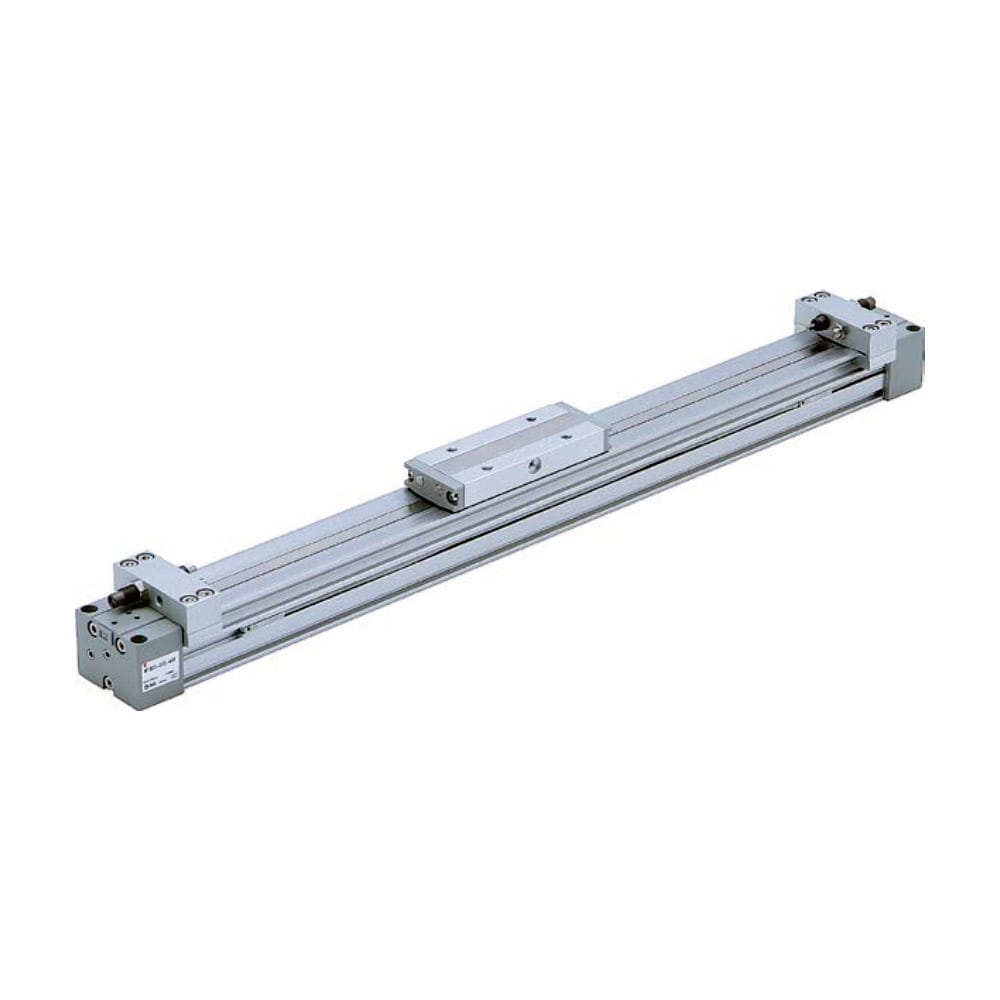
A rodless cylinder does not automatically have a higher natural frequency. Removing a piston rod can reduce moving mass, but a long stroke increases chamber volume, while the carriage, guide, sealing band, magnet coupling, load offset, and mounting span can introduce compliance or additional modes. Compare the complete moving assembly at the same operating state.
This is also why a measured problem may appear only in one portion of travel. Repeat the calculation and test at the operating positions that matter, including the loaded start, mid-stroke, process position, and end approach. For installation effects, use the actuator mounting and alignment guide and the rodless-cylinder mounting guide.
Resonance Depends on Damping and Excitation
At a frequency ratio of , a linear single-degree-of-freedom model gives a displacement magnification of 10 when , but only 2.5 when . The calculation follows the standard forced-response equation below. It shows why no fixed “10 to 50 times” claim can describe every pneumatic machine.
Frequency ratio is the excitation frequency divided by natural frequency. Define it as:
is the excitation frequency and is the calculated natural frequency. For a harmonically forced, linear, single-mode system, the displacement magnification is:
is the ratio of steady-state displacement amplitude to the corresponding static displacement. At , this simplifies to . Low damping creates a sharper peak; more damping lowers and broadens it. The formula is not valid for hard stops, clearance impacts, strongly nonlinear seal friction, valve saturation, or multiple coupled modes.
What counts as excitation? Check the commanded cycle frequency, motion-profile harmonics, valve switching, nearby rotating equipment, conveyor tooth or pocket passage, compressor pulsation, and repeated end impacts. A one-second machine cycle has a 1 Hz fundamental, but its acceleration waveform can contain much higher harmonics.
Don’t label every vibration peak as pneumatic resonance. If changing chamber pressure moves the peak, pneumatic stiffness is probably involved. If the peak stays almost fixed while mounting or payload changes affect it, a structural mode may dominate. If oscillation depends strongly on controller gain, deadband, or sampling, investigate the control loop.
How Should You Verify the Calculation on the Machine?
One double-acting-cylinder study sampled pressure and displacement every 0.1 ms and repeated each condition 45 times to characterize dynamic behavior (Experimental Study of Double-Acting Pneumatic Cylinder, 2020). A factory check need not copy that laboratory protocol, but it should synchronize motion, pressure, and vibration signals.
Use this sequence:
- Define the state. Record piston position, payload, orientation, both chamber pressures, valve command, regulator setting, flow-control settings, tube dimensions, guide condition, and mounting configuration.
- Make the test safe. Isolate personnel from the motion zone, reduce energy where practical, and do not sweep through a suspected resonance at full production force without an approved test plan.
- Measure the right signals. Place an accelerometer on the moving carriage or load and another on the frame when possible. Add both chamber pressures and position or velocity.
- Excite gently. Use a low-amplitude commanded sweep, a controlled step, or a documented impact test appropriate to the machine. End-cap impacts are not a substitute for a safe excitation method.
- Find repeatable peaks. Compare spectra, phase, ring-down frequency, and pressure-position behavior across repeated runs.
- Change one parameter. Repeat with a known mass, pressure, or position change. A real model should predict the direction of the frequency shift.
In our experience, the quickest diagnostic improvement comes from recording both chamber pressures instead of relying on the regulator gauge. The regulator describes the supply setting. It does not prove the trapped pressure, exhaust backpressure, or dynamic pressure at the cylinder when the vibration occurs.
The 2005 pneumatic-servo identification study measured natural frequency as a function of piston position and used that curve to inform controller design (Noskievi, Identification of the Pneumatic Servo System Using Self-Excited Oscillations, 2005). That is a useful reminder: for controlled positioning, the frequency map can matter more than one mid-stroke value.
ISO 20816-1:2016 provides general conditions and procedures for measuring and evaluating vibration on complete machines. It can inform a plant vibration program, but it does not supply a universal pneumatic-cylinder resonance limit or replace the application-specific frequency model and acceptance criteria.
What Should You Change When the Frequencies Are Too Close?
Under the closed-chamber model, doubling moving mass while holding stiffness constant reduces natural frequency to about 70.7% of its original value. Doll and colleagues likewise show that maintaining the same eigenfrequency after doubling mass requires a corresponding stiffness-related sizing change (Dimensioning of Pneumatic Cylinders for Motion Tasks, 2015).
Choose a correction that acts on the identified mechanism:
- Move the excitation. Change cycle timing, acceleration ramps, dwell timing, valve switching, or nearby rotating-equipment speed so dominant harmonics do not repeatedly drive the mode.
- Change moving mass deliberately. Reducing mass raises natural frequency when stiffness stays constant. Adding mass lowers it. Either direction can help or hurt, so recalculate the full operating range.
- Change pneumatic stiffness. Chamber pressure, piston area, trapped volume, dead volume, and valve state affect stiffness. Raising pressure can increase stiffness, but it also changes available force and stored energy. Never treat pressure as a tuning knob without checking component ratings and machine risk.
- Correct the load path. Stiffen a flexible bracket, shorten an unsupported span, remove binding, or add an appropriate guide when the measured mode is structural. Mounting bolts should not pull misaligned parts into position.
- Add damping where energy is dissipated safely. A damper, shock absorber, cushion, or control strategy must match the mode. End-of-stroke impact belongs in a cushion-energy review, not in a mid-stroke resonance formula.
- Retune the controller after identifying the plant. Lower gain, filtered commands, notch filters, or gain scheduling can help a servo-pneumatic axis, but software should not hide loose mounts, an undersized guide, or an impact problem.
There is no universal safe percentage separation for every pneumatic machine. Define the operating speed range, load range, stroke positions, pressure range, and credible disturbances, then verify that measured response remains acceptable throughout that envelope. Document the final settings so maintenance can recognize drift later.
Natural Frequency Calculation FAQs
These 5 questions separate the screening equation from the assembled machine. The model uses 2 chamber pressures, 2 effective areas, 2 chamber volumes, one effective mass, and a stated valve condition (Doll et al., 2015). Missing any of those inputs can change the predicted mode.
Is cycle rate the same as natural frequency?
No. Cycle rate is a commanded operating frequency, while natural frequency is a property of the mass-stiffness system around a defined state. A 1 Hz cycle can still contain higher-frequency acceleration harmonics and impacts. Compare measured excitation content with the calculated and measured modes instead of comparing cycle rate alone.
Should pressure be gauge or absolute in the stiffness equation?
Use absolute chamber pressure. Gas stiffness follows the pressure-volume state of the trapped air, so gauge pressure omits atmospheric pressure. Measure both chambers at the operating condition when possible. The regulator setting is not a substitute for actual cap-end and rod-end pressures, especially when valves, tubes, and exhaust restrictions are active.
Does a rodless cylinder always have a higher natural frequency?
No. A rodless design may reduce moving rod mass, but natural frequency also depends on carriage and payload mass, both chamber volumes, pressure, guide and mounting stiffness, coupling behavior, and stroke position. Long strokes can increase trapped volume and introduce structural modes, so compare complete assemblies under the same boundary conditions.
When must the calculation be repeated?
Repeat it after changes to payload, tooling, piston position, operating pressure, tube or hose length, valve state, mounting, guide stiffness, control settings, or motion profile. Also recalculate when measured pressure differs from the original assumption. The useful result is a frequency range across credible operating cases, not one permanent number.
Can changing cylinder speed eliminate resonance?
It can move the excitation away from a mode, but speed is only one input. A new motion profile can introduce different harmonics, and faster end approaches increase impact energy. Measure the response after changing speed, then confirm cushioning, valve flow, cycle time, control stability, and the full operating envelope before release.
Sources and technical references
Technical sources are linked at the point where each model assumption, equation, experimental method, or derived result is discussed.
Author and company information is available on the About Us page. Readers can send technical questions or source corrections through Contact.