

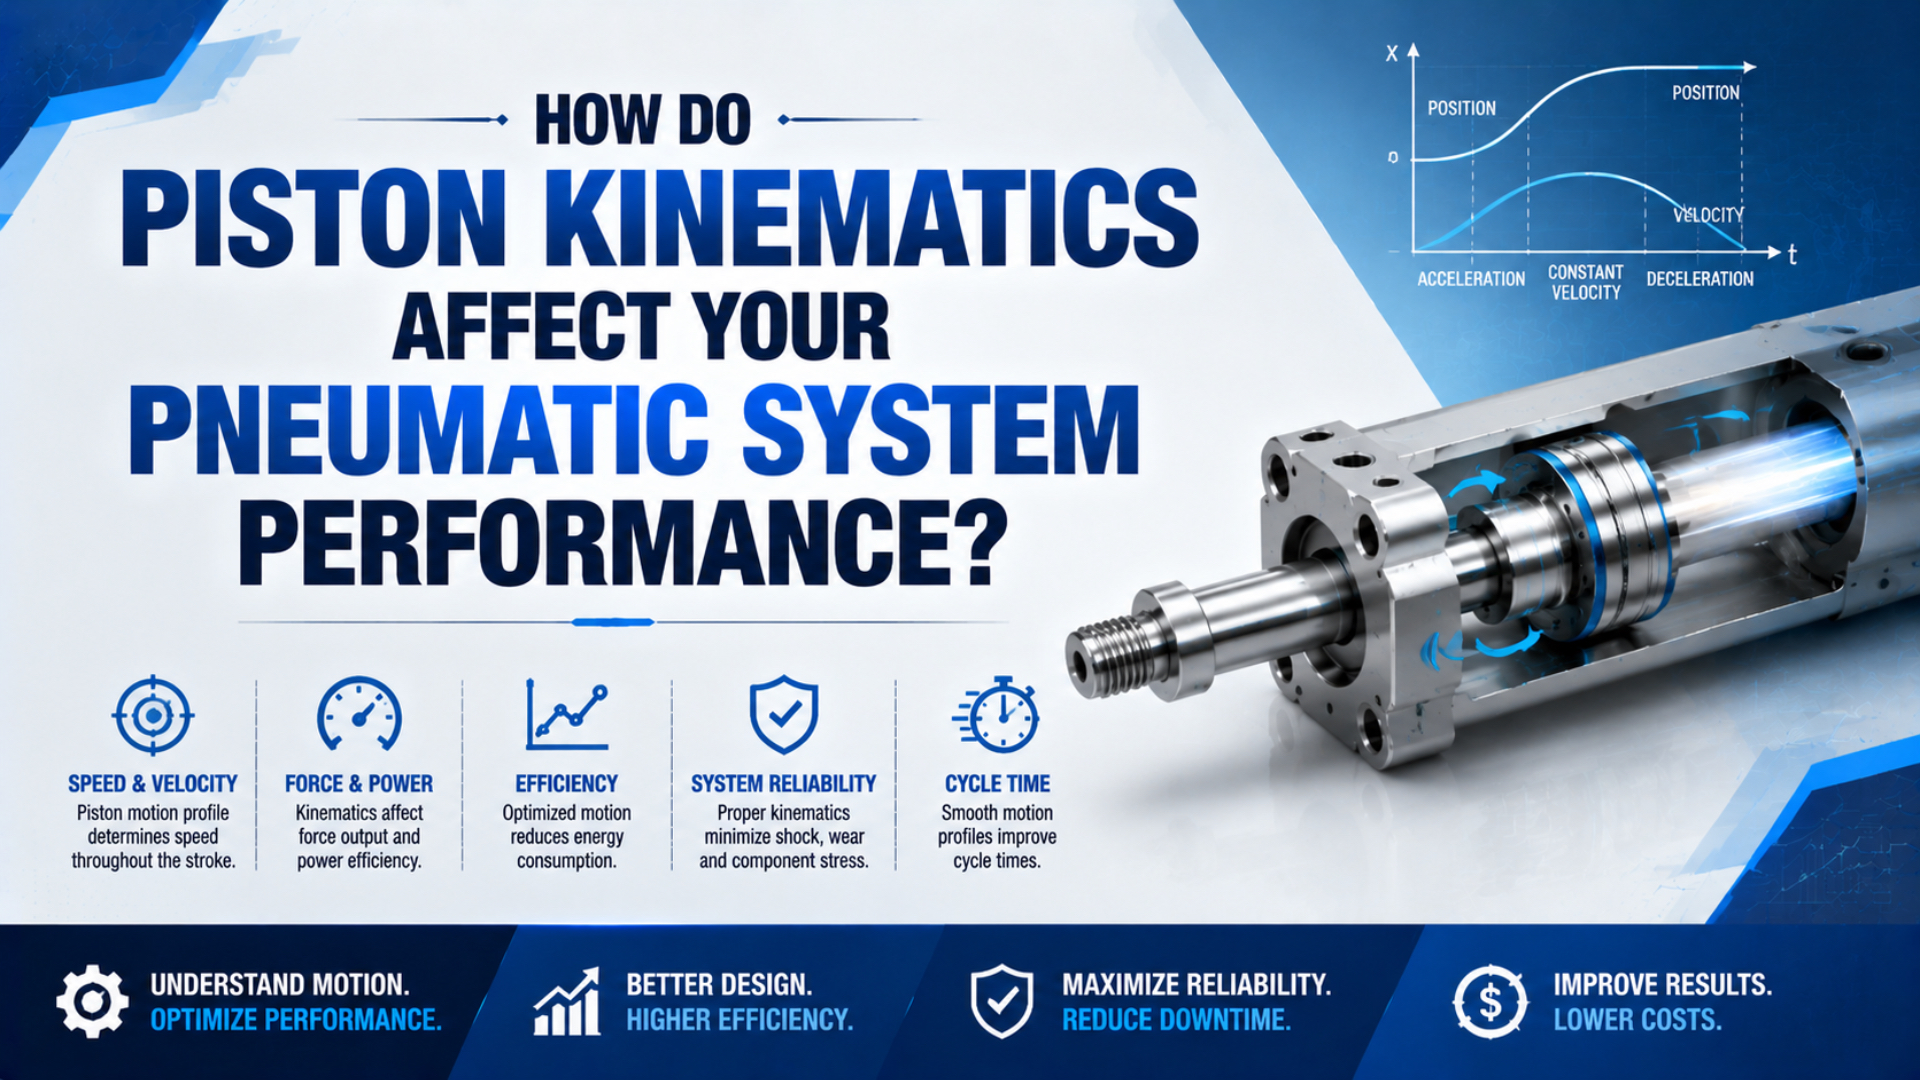
Piston kinematics defines where a pneumatic cylinder must be, how fast it must move, and how quickly its velocity must change. Those position, velocity, and acceleration targets become useful only after they are checked against moving mass, the pressure in both cylinder chambers, valve and tubing flow capacity, friction, external load, and end-of-stroke energy.
That distinction prevents a common sizing error. Supply pressure does not set piston speed by itself, and theoretical cylinder force does not prove that a motion profile is achievable. Start with the required motion, translate acceleration into net force, verify the flow path, and then check how the moving system will stop.
Key Takeaways
- Kinematics describes position, velocity, and acceleration; pressure and force belong to the dynamic feasibility check.
- Both cylinder chambers belong in the force balance.
- A 10 kg moving mass at 0.5 m/s carries 1.25 J of kinetic energy before drive energy is added.
- Final acceptance requires measured position, time, and dynamic port pressure.
What Does Piston Kinematics Actually Describe?
Piston kinematics is the description of motion without assigning its cause. NPTEL defines kinematics as the study of motion regardless of what causes it, so a one-axis cylinder profile begins with three functions: position, velocity, and acceleration. These three quantities must use one shared time reference (NPTEL, accessed 2026).
For piston position as a function of time , velocity is:
Acceleration is the rate of change of velocity:
Here, is normally expressed in metres or millimetres, in metres per second or millimetres per second, and in metres per second squared. Keep one unit system throughout a calculation.
These relationships describe the requested motion, not the cylinder hardware required to produce it. A machine specification such as “move 300 mm in 0.8 s” is incomplete until it also defines the starting and ending velocities, acceptable impact, load variation, dwell time, and whether the motion is horizontal, vertical, or inclined.
The most useful boundary is simple: kinematics states what the load must do, while dynamics tests whether the pneumatic and mechanical system can do it. Keeping those two steps separate makes assumptions visible and prevents supply pressure from being mistaken for speed.
How Does the Motion Profile Create a Force Requirement?
Net force is the vector sum that produces acceleration. NASA states that one newton accelerates one kilogram at one metre per second squared; therefore, a constant 10 kg moving assembly needs 50 N of net force to achieve 5 m/s² before external load and friction are considered (NASA, accessed 2026).
A double-acting cylinder has two pressure forces. With positive motion defined toward the rod extension direction, a useful one-axis balance is:
In this equation:
- is total moving mass, including the applicable piston, rod, carriage, payload, tooling, cables, and attachments.
- and are the simultaneous chamber pressures relative to the same reference.
- and are the effective piston areas for those chambers.
- is the signed external force along the motion axis.
- opposes the direction of motion.
- is the resulting acceleration in the declared positive direction.
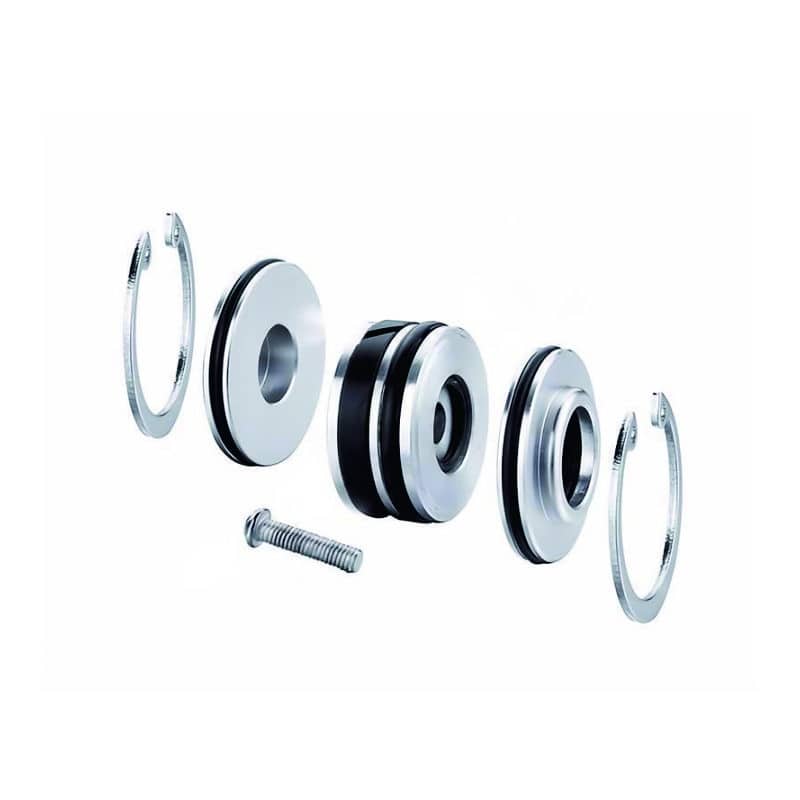
The assembly image illustrates why payload alone is not enough. The applicable moving mass can include the piston, part or all of the rod, a carriage, magnet, fasteners, and attached tooling. The exact boundary depends on cylinder construction, so use manufacturer moving-mass data when available. The piston-mass guide develops this boundary in more detail.
At constant velocity, acceleration is zero, but both chamber pressures still matter. The inlet chamber must balance external load, friction, and exhaust-side pressure force. The exhaust chamber is rarely at atmospheric pressure during a fast stroke because valves, silencers, tubing, and flow controls create back pressure. Orientation also changes the signed load term: weight acts along the motion axis for a vertical cylinder, only its axial component acts on an incline, and weight is normally perpendicular to a horizontal axis. For that reason, a 10 kg horizontal payload does not automatically create a 98.1 N axial load. Convert mass to an axial gravity force only after defining orientation, guide friction, acceleration direction, and the positive sign convention. Then use simultaneous chamber pressures rather than regulator set pressure in the force balance.
Why Doesn’t Supply Pressure Determine Piston Speed?
Piston speed is displacement per unit time, and its first-pass pneumatic relationship is flow divided by effective area. With equal-temperature ideal-gas conversion, 200 L/min of free air at roughly 1 bar absolute becomes about 28.6 L/min of chamber volume at 7 bar absolute; the installed flow path must still deliver it dynamically (Parker Schrader Bellows, accessed 2026).
The first-pass volume relationship is:
is piston velocity, is volumetric flow evaluated at chamber conditions, and is the effective area for the direction of travel. Free-air flow from a valve catalogue cannot be inserted without converting its reference pressure and temperature.
Pressure still matters because it creates force and changes gas density. However, opening a regulator does not guarantee a proportional increase in speed. The observed motion depends on:
- Valve flow capacity at the actual upstream-to-downstream pressure ratio.
- Tube and fitting conductance, length, bends, and inside diameter.
- Meter-out or meter-in speed controls.
- Exhaust silencers and downstream back pressure.
- Chamber volume as the piston moves.
- Load, friction, seal condition, and breakaway behaviour.
- The controller command and valve response.
ISO 6358-1 specifies steady-state test methods for the flow-rate characteristics of pneumatic components using compressible fluids. Those component ratings are inputs to a system estimate, not a promise that the cylinder will reach a particular speed in a real machine (ISO, confirmed 2022).
A fast pressure rise with little motion can indicate breakaway friction or a restrained load. Rapid motion with a collapsing inlet pressure can indicate a flow restriction. The pressure traces and position trace must be read together; neither one diagnoses the system alone.
Use the piston velocity calculation guide for flow-reference conversion and extension/retraction area examples. For high pressure ratios and flow saturation, continue with the choked-flow guide.
Building a Feasible Piston Motion Profile
Stroke time must be converted into a complete velocity profile. A 300 mm stroke completed in 0.8 s has an average speed of 0.375 m/s, but a symmetric triangular profile starting and ending at rest reaches 0.75 m/s; the same travel time can therefore create very different flow and stopping requirements.
Start with six inputs:
- Stroke distance.
- Start and end velocity.
- Maximum permitted velocity.
- Acceleration and deceleration limits.
- Dwell time at each end.
- Position and cycle-time tolerance.
For a constant-acceleration segment, velocity and distance are related by:
and are the segment’s initial and final velocities, is constant acceleration, and is the distance travelled during that segment. The equation is a planning approximation. A pneumatic cylinder’s actual acceleration changes as chamber pressures, effective load, and friction change.
A trapezoidal velocity profile includes acceleration, an approximately constant-speed region, and deceleration. Short strokes may never reach the intended constant-speed region and instead behave more like a triangular profile. That matters because selecting a valve from average speed alone can understate peak flow.
For sensitive loads, a controller may command smoother S-shaped ramps to limit jerk, the rate of change of acceleration. A conventional directional valve with mechanical flow controls will not reproduce a servo motion profile precisely. Match the profile ambition to the valve architecture, sensors, controller, cylinder friction, and allowable position error.
Use the Cylinder Flow Requirement Calculator after defining directional stroke time, bore, rod diameter, pressure, and flow reference. Treat its result as valve and tubing preselection data, then verify the complete installed path.
Worked Example: What Do 10 kg and 0.5 m/s Mean at the Cushion?
A 10 kg moving assembly entering a cushion at 0.5 m/s carries 1.25 J of kinetic energy. Stopping uniformly over 15 mm requires an ideal average deceleration magnitude of 8.33 m/s² and an ideal stopping time of 0.06 s, before pressure drive, friction, leakage, or cushion nonlinearity is included.
The kinetic energy at cushion entry is:
With and cushion-entry velocity :
If the idealized deceleration is constant over cushion distance :
The corresponding stopping time is:
Here, is kinetic energy, is total moving mass, is measured or conservatively estimated cushion-entry speed, is effective stopping distance, is the magnitude of ideal constant deceleration, and is ideal stopping time.
This result does not size a pneumatic cushion by itself. Cylinder pressure may continue doing positive work during the stopping distance, and the cushion’s back-pressure force is not constant. Manufacturer methods may include load orientation, driving force, allowable speed, energy per cycle, and thermal recovery.
The squared velocity term deserves attention. Increasing entry speed from 0.5 to 0.75 m/s raises kinetic energy from 1.25 to 2.81 J at the same 10 kg mass. That is a 125% increase in energy for a 50% speed increase. Slowing the load before cushion engagement can therefore be more effective than making a small change to moving mass.
How Should Cushioning Be Selected and Adjusted?
Cushion limits are product-specific. Parker recommends cushioning for its 2A cylinders when piston speed exceeds 0.1 m/s and the piston makes a full stroke, while its OSP-P instructions require a low-speed initial run and a model-specific starting adjustment rather than a universal fully-open setting (Parker 2A; Parker OSP-P, accessed 2026).
Follow this selection sequence:
- Identify the exact cylinder model, bore, stroke, mounting, cushion option, and operating pressure.
- Determine total moving mass and load orientation.
- Use cushion-entry speed, not average stroke speed.
- Include kinetic energy and any drive-energy term required by the manufacturer.
- Compare the result with the model’s mass-speed graph, energy limit, cushion stroke, and permitted cycle rate.
- Add an external shock absorber or controlled deceleration when the built-in cushion is outside its published envelope.
- Validate at minimum and maximum expected load, pressure, temperature, and cycle rate.
SMC’s MY2 catalogue illustrates why the exact model matters: the published air-cushion strokes are 12, 15, and 24 mm for the listed 16, 25, and 40 mm bores, and selection uses model-specific load-versus-impact-speed limit lines (SMC, accessed 2026). Those values cannot be transferred to another cylinder family.
Adjustment must follow the operating manual for the installed product. Isolate hazards, confirm the load path, start at low speed, pressurize gradually when instructed, and keep people outside the motion zone. Increase speed only after the cylinder reaches both ends without collision, bounce, or hard impact.
The cushion should bring the moving assembly to the end position without a sharp strike or rebound. Closing a needle excessively can create a premature stop, bounce, or high cushion pressure. Opening it excessively can allow mechanical impact. If adjustment cannot satisfy both ends of the expected load range, change the hardware or motion profile.
For open-system cushion pressure and temperature modelling, see the pneumatic cushioning physics guide. The high-speed cylinder checklist covers guides, mounts, valves, sensing, and acceptance data around the cushion calculation.
Machine Verification of Piston Kinematics
Verification needs synchronized motion and pressure data. Parker’s OSP-P commissioning instructions call for checking the complete travel zone at low speed before normal operation; ISO 19973-3 separately standardizes reliability testing procedures for pneumatic cylinders with piston rods rather than assigning service life from one calculated force (Parker; ISO).
Record these signals against a common time base:
- Position from an external encoder, linear transducer, or suitable machine sensor.
- Inlet-side and exhaust-side pressure at the cylinder ports.
- Valve command and, where available, spool or valve-state feedback.
- End-switch timing.
- Supply pressure near the valve.
- Payload configuration and orientation.
Calculate velocity from the slope of position versus time and acceleration from the change in velocity. Apply filtering carefully because differentiating a noisy position signal amplifies noise. Preserve the raw trace, document the sample rate and filter settings, and compare repeated cycles rather than presenting a single unusually smooth run.
Check at least four parts of the motion:
- Breakaway: delay between valve command, chamber-pressure change, and initial movement.
- Acceleration: peak and repeatability before the nominal travel-speed region.
- Mid-stroke: velocity stability and dynamic pressure loss.
- Deceleration: cushion-entry speed, stopping distance, rebound, and end-position settling.
Acceptance limits should describe the installed machine, not just the cylinder. A useful record includes load range, pressure range, stroke time, peak speed, cushion-entry speed, settling time, overshoot, and test conditions. That package lets maintenance distinguish a drifting valve or blocked silencer from changing friction or mechanical alignment.
If loss of pressure or electrical power can leave the load moving, evaluate that state separately with the emergency-stop dynamics guide. Normal end cushioning is not automatically a safety-rated stopping function.
For an application review, send the cylinder model, bore, rod diameter, stroke, mounting orientation, moving mass, required motion time, valve model, tube dimensions, port-pressure traces, and position trace through the technical contact page. Those inputs are more useful than supply pressure and payload alone.
Piston Kinematics FAQs
Piston kinematics must be tied to product limits and measured conditions. Parker uses 0.1 m/s as a cushioning recommendation threshold for the cited 2A series, while SMC publishes different cushion strokes and mass-speed boundaries by MY2 bore size, showing why no universal pressure, speed, or deceleration limit fits every pneumatic cylinder.
Is piston kinematics the same as pneumatic cylinder dynamics?
No. Kinematics describes position, velocity, and acceleration without explaining their cause. Dynamics adds chamber pressure, effective areas, moving mass, external load, friction, and flow behaviour. Define the required motion first, then use the force and flow models to test whether a specific cylinder and valve system can produce it.
Can supply pressure be converted directly into piston speed?
No. Pressure creates force and affects air density, but speed depends on mass flow through the entire inlet and exhaust path, effective piston area, changing chamber volume, load, friction, and back pressure. Use pressure and flow ratings together, then measure dynamic port pressure and position on the installed machine.
Which mass belongs in the acceleration and cushion calculations?
Use total moving mass for the evaluated axis. It may include the piston, applicable moving rod mass, carriage, payload, tooling, cable carrier, hoses, fasteners, and other attachments. Follow the manufacturer’s definition when using a catalog cushion graph because different cylinder constructions assign internal moving mass differently.
Is average stroke speed enough for cushion selection?
No. A load can enter the cushion faster than its average stroke speed, particularly after acceleration and before a short deceleration zone. Use measured or conservatively estimated cushion-entry speed, total moving mass, orientation, operating pressure, and the exact manufacturer’s energy or mass-speed method. Also check cycle-rate or thermal limits.
How can piston acceleration be measured reliably?
Measure position at a documented sample rate, align it with both cylinder-port pressure traces and the valve command, and calculate velocity and acceleration from the time history. Because differentiation magnifies sensor noise, retain the raw signal and state any filtering. Compare repeated cycles across the expected load and pressure range.
Sources and technical references
- NPTEL, Kinematics
- NASA, Newton’s Laws of Motion
- ISO 6358-1:2013, flow-rate characteristics of pneumatic components
- ISO 19973-3:2015, reliability testing for pneumatic cylinders
- Parker 2A pneumatic cylinder catalogue
- Parker OSP-P operating instructions
- Parker Schrader Bellows cylinder sizing data
- SMC MY2 cushion selection data